$NIO Breakout play- NYSE:NIO breakout play.
- I have marked the potential levels.
- NYSE:NIO moon time!
NIO
TSLA New ATH incoming? Overview of primary catalysts.After trading between $346 and $365 intraday on May 27, Tesla shares closed at $362.89—up modestly despite broader market headwinds and lingering investor skepticism.
Here’s a detailed breakdown of the primary catalysts shaping Tesla’s stock price (ranked 0–10):
1. Electric Vehicle Demand Growth
Strength: 9/10
Global EV adoption remains the single largest driver of Tesla’s top line. Despite slowing sales in Europe and China, overall EV penetration continues to surge as consumers shift away from internal-combustion engines.
2. Launch of Affordable Model (Entry-Level EV)
Strength: 8.5/10
Elon Musk has reiterated plans to unveil a sub-$25,000 EV in early 2025, targeting the mass market. Investors cheered a recent reaffirmation of focus on core products over peripheral projects.
3. Battery Cost Reductions & Margin Expansion
Strength: 8/10
Tesla’s relentless drive to lower battery pack costs underpins both profitability and price competitiveness. Q4 cost of goods sold dipped below $35,000 per vehicle, even as margins softened amid mixed volumes.
4. Autonomy & Robotaxi Progress
Strength: 7.5/10
Commercial robotaxi trials are slated to begin in Austin in June 2025, with a dedicated Cybercab in development. While regulatory and safety hurdles loom, the promise of recurring software subscription revenue could be transformative.
5. Competition from Other EV Manufacturers
Strength: 7/10
Legacy automakers and startups alike are ramping up EV offerings. Tesla’s U.S. market share has declined in recent years, highlighting intensifying pressure in key regions.
6. U.S.–China Trade Policies & Tariffs
Strength: 6.5/10
Fluctuating tariffs on Chinese EV imports have led to order suspensions and forecasting challenges. Trade-policy uncertainty remains a wild card given Tesla’s global supply chain.
7. Regulatory Incentives & Subsidies
Strength: 6/10
U.S. federal tax credits under the Inflation Reduction Act and similar programs in Europe and China support EV demand—and Tesla’s eligibility criteria will influence its market growth.
8. Commodity Price Volatility (Lithium, Nickel, Cobalt)
Strength: 5.5/10
Raw material cost swings can erode margins. While long-term supply agreements help, spot shortages or price spikes remain risks.
9. Fed “Higher for Longer” Interest Rate Environment
Strength: 5/10
Elevated real yields reduce the appeal of high-growth names like Tesla. A sustained hawkish stance from the Fed could continue to cap valuations, similar to how it weighs on non-yielding assets.
10. Corporate Governance & Elon Musk’s Public Profile
Strength: 4/10
Musk’s high-profile engagements and occasional controversies can politicize the brand, prompting sentiment-driven stock swings.
Catalyst Strength Rankings (May 2025)
🔸 EV demand growth: 9
🔸 Affordable Model launch: 8.5
🔸 Battery cost & margins: 8
🔸 Autonomy/robotaxi progress: 7.5
🔸 Competition: 7
🔸 Trade & tariffs: 6.5
🔸 Regulatory incentives: 6
🔸 Commodity costs: 5.5
🔸 Fed rates: 5
🔸 Musk profile: 4
Analyst Forecasts for 2025
| Analyst / Consensus | 12-Month Price Target | Rating |
| --------------------------- | --------------------- | ------------ |
| High | \$470.00 | – |
| Median | \$306.00 | Hold/Neutral |
| Low | \$115.00 | – |
| Average (Consensus) | \$306.29 | Hold |
| Dan Ives (Wedbush) | \$315 | Outperform |
| Adam Jonas (Morgan Stanley) | \$430 | Overweight |
* Consensus sees a range of \$115–\$470 with an average near \$306.
* Dan Ives trimmed his target from \$550 to \$315, citing tariff risks and political headwinds.
* Adam Jonas remains bullish with a \$430 target, viewing Tesla as an “embodied AI compounder” despite near-term brand challenges.
Where to Next for Tesla?
* Current price: \~\$362.89
* Key support levels: \$350 and \$340
* Next technical floor: \$330
* Upside triggers: Stronger-than-expected delivery volumes, breakthrough in full-self-driving (FSD) reliability, or renewed cost cuts.
Tesla’s stock remains a balance between long-term disruptive potential and short-term execution risks. While EV adoption and autonomous ambitions underpin a compelling growth narrative, margin compression, competitive pressures, and macro uncertainties will dictate volatility in the months ahead.

Is Nio’s ambition outpacing reality?Chinese electric vehicle maker Nio faces significant challenges despite strategic efforts like the recent launch of the Firefly brand. A successful and innovative company known for its battery swaps, Nio is now grappling with increasing domestic competition, slowing economic growth, and significant financial losses reflected in its low share price and market cap. The company’s path forward, and particularly its ambitious global expansion, increasingly appears fraught with external pressures and technological hurdles that threaten its long-term viability.
Chief among these challenges is rising geopolitical risks. Rising trade tensions between major global powers, including potential tariffs from the US and Europe, directly threaten Nio’s access to the international market and its growth prospects. More critically, the unresolved situation regarding Taiwan poses a serious risk of conflict (a Chinese invasion of Taiwan) and subsequent international embargoes. Such a scenario could disrupt global supply chains, especially for critical components such as semiconductors essential for electric vehicles, and cripple Nio’s production and sales.
Furthermore, Nio is in an expensive technological arms race, particularly in autonomous driving, competing with global leaders such as Tesla. While Nio uses a multi-sensor approach with LiDAR in its Navigate on Pilot Plus (NOP+) system, Tesla’s vision-only strategy and extensive data collection pose a formidable challenge. Both companies face obstacles, and with the complex task of perfecting autonomous technology in diverse environments, Nio must not only adapt to technological advances but also navigate complex regulatory landscapes and execute flawlessly to compete effectively and justify its significant investments in this space.
An Important Bullish Pattern Forms on the NIO Share Price ChartAn Important Bullish Pattern Forms on the NIO Share Price Chart
Today, the share price of NIO Inc. (NIO), a Chinese manufacturer of "smart" electric vehicles, is trading above $4 – a development that may be viewed as an optimistic scenario following the drop to $3 in the first half of April, marking the lowest level in nearly five years.
Why Has NIO’s Share Price Risen?
Bullish sentiment has been supported by news that the company: → increased vehicle deliveries by 40.1% compared to the same period last year; → is launching its premium ET9 model, expanding its range of offerings.
Additionally, news offering hope that high tariffs in international trade may not hinder the company's growth has also had a positive impact on NIO’s share price.
Technical Analysis of NIO’s Share Price Chart
From the perspective of candlestick analysis on the daily chart, a "Three White Soldiers" pattern (marked with an arrow) can be observed. This is considered an important bullish signal, as according to Thomas Bulkowski, author of Encyclopedia of Candlestick Charts, following the formation of a "Three White Soldiers" pattern, a bearish trend (highlighted by the red channel) reverses to the upside in 82% of cases.
However, it is important to bear in mind that resistance may be encountered at:
→ the $4 per share level, as it previously served as a support;
→ the 50% Fibonacci retracement level from the downward move between 12 March and 8 April.
This article represents the opinion of the Companies operating under the FXOpen brand only. It is not to be construed as an offer, solicitation, or recommendation with respect to products and services provided by the Companies operating under the FXOpen brand, nor is it to be considered financial advice.

Tesla (TSLA) - The Big Short?Can Tesla save itself from the Big Short? With earnings coming up on April 29, the anticipated sales and earnings may be dismal. If hedge funds and retirement managers decide to lighten their exposure, this could lead to abrupt moves in the price of Tesla. Basically, if people want to sell and no one wants to buy at this price, then price has to go down. Also if Tesla hits a certain price on the way down, then all the loans like those used to purchase Twitter may margin call due to risk, more selling. This would not be good for Tesla or the market in general. Also keep in mind that April may be a pullback month for the S&P500 and Nasdaq anyway. So, what does Tesla need to do to combat this? 1. Deliver new products or announce the delivery of new product. 2. Deliver on full self driving along with the Robo Taxi service 3. Deliver on a new cheaper Tesla Model that can be used by individual owners to participate in the Robo Taxi network (Income for the buyer). 4. Deliver on a redesigned Cyber Truck. The current design in getting banned in European countries. Therefore, missing out on sells. 5. Deliver on mass productoin of humanoid robots and AI agents (someone has to be first). This will create excitement but can be tricky since it will unleash AI on the world which can be great but also introduce risk that have not been vetted. Such as, who controls the AI? Who is the AI 'loyal' to? What can people or Tesla ask AI to do? Are there morality rules? Is AI subject to the law? Who's laws based on the Country, State, or county/city it resides or where it was manufactured? 6. Advertise all the positive things about Tesla as a company and the cars as a product. Explain why someone should buy a Tesla over a BYD brand electric car in markets around the world.
These are just a few suggestions for Tesla to avoid The Big Short. What are some of your ideas?

NIO Stock Trades Below $5 Following Earnings ReportIn just three trading sessions, the stock of the Chinese electric vehicle company has dropped more than 14%, now hovering around $4.50 per share. The ongoing bearish move remains steady after the company reported a net loss of approximately $985 million and weaker-than-expected sales of $2.7 billion, compared to the $2.8 billion forecast. These disappointing results have fueled consistent selling pressure in recent hours.
New Lateral Range:
Recent price action has led to the formation of a sideways range, with resistance near $5.00 and support around $4.17. The recent bearish movement has pushed the stock to stabilize near the bottom half of this range, giving the current sideways formation more relevance, with no clear signs of a breakout in the short term.
MACD:
The MACD histogram continues to fluctuate near the neutral zero line, indicating that the average strength of recent moving averages is balanced, with no dominant directional bias in the short term. This suggests that the lateral formation may persist, keeping price movements neutral for now.
ADX:
However, it’s worth noting that the ADX line remains consistently above the 20 level, which may imply that recent price moves are gaining trend strength. If the ADX continues to rise above 20, this could reinforce the bearish momentum observed in recent sessions.
Key Levels:
$5.00 – Remains the most important resistance level , located at the top of the current range. Sustained moves above this level could mark the end of a long-term downtrend that has been in place since September 2024.
$4.53 – A key mid-range leve l, where the Ichimoku cloud and the 50- and 100-period moving averages converge. This may act as a neutral zone, where indecisive price action could continue, extending the current lateral formation.
$4.17 – Critical support level , aligned with the recent multi-month lows. A break below this level would signal a potential bearish breakout, possibly triggering a more aggressive downward trend in the short term.
By Julian Pineda, CFA – Market Analyst

NIO Options Ahead of EarningsIf you haven`t bought NIO before the previous earnings:
Now analyzing the options chain and the chart patterns of NIO prior to the earnings report this week,
I would consider purchasing the 6usd strike price Calls with
an expiration date of 2025-6-20,
for a premium of approximately $0.47.
If these options prove to be profitable prior to the earnings release, I would sell at least half of them.

NIO Share Price Soars by Approximately 17%NIO Share Price Soars by Approximately 17%
The stock chart of Chinese electric vehicle manufacturer NIO shows that its price has reached a new high for 2025, following a 10% surge yesterday.
In the process, the stock formed a wide bullish gap and successfully broke through the psychological $5 per share level.
Why Has NIO’s Share Price Risen?
The bullish sentiment is largely driven by anticipation of the company's upcoming earnings report. Last year, NIO achieved record-breaking monthly EV deliveries, reaching 31,000 units in December.
Investors are now eagerly awaiting further details about NIO’s two new mass-market brands, Onvo and Firefly. Onvo has already launched, while pre-orders for Firefly—a compact and intelligent EV priced at around $20,500—have begun.
Additionally, some investors may be shifting capital from TSLA shares (which have been experiencing a bearish trend, as reported yesterday) into NIO stock.
Technical Analysis of NIO’s Stock Chart
Looking at the bigger picture, NIO’s share price remains within a long-term downward trend (marked by the red descending channel). Since the start of 2025, the stock has fluctuated around the median line without dropping below $4 per share, a level where supply and demand have historically balanced out.
However, yesterday’s strong upward momentum suggests that the balance may have shifted in favour of the bulls. Given the positive fundamental outlook, buyers could maintain the recent gains, potentially pushing the share price towards the upper boundary of the red channel—following the trajectory outlined by the blue lines on the chart.
This article represents the opinion of the Companies operating under the FXOpen brand only. It is not to be construed as an offer, solicitation, or recommendation with respect to products and services provided by the Companies operating under the FXOpen brand, nor is it to be considered financial advice.

NIO | China will Lead the EV BattleNIO, Inc. is a holding company which engages in the design, manufacture, and sale of electric vehicles. Its products include the EP9 supercar and ES8 7-seater SUV. It provides users with home charging, power express valet services, and other power solutions including access to public charging, access to power mobile charging trucks, and battery swapping. It also offers other value-added services such as service package, battery payment arrangement, and vehicle financing and license plate registration. The company was founded by Bin Li and Li Hong Qin on November 28, 2014 and is headquartered in Jiading, China.

$NIO Short-term play; touched the .618 fib-retracement level.For the short term, I see NIO rising further on wave 3-5.
Additionally, I see a bull flag playing out.
It could even propel us out of this pattern.
But if it breaks out, can NIO also push through this larger resistance line?
And this one?
All I see is confluence.
Good luck to all.

$NIO Will a similar OBV and Volume pattern lead to a rally?Pay attention to the recent OBV structure (blue). Declining and forming a flat bottom.
The volume in pink displays the same characteristics during each stage of the Inverse H&S pattern: forming an initial peak during the left shoulder, a higher one during the formation of the head (although the head of the current pattern is accompanied by lower volume, but I have an explanation for it), and then peaking during the formation of the second touch of the base, at the start of the right shoulder. Finally, the volume dives along with the last peak of the structure before leaving the pattern altogether.
Additionally, notice how the Weinstein 30-week indicator is finding a bottom here.
During the 'head' or second dip, NIO's price declined on lower volume than in 2019. I can see it as a change of character. It looks like NIO didn't take this dip seriously this time.

The algos have awoken. $NIO Short term squeeze?As soon as the Weinstein 30-week indicator trended up on the 1-minute chart (first time since the start of January), price rallied by 1% and heavy call buying pushed the options premium to the bullish territory.
As a result, the indicator is trending up on the 30-minute chart for the first time since last November. I think that a squeeze is highly likely to occur over the next few days.

$NIO Triple dives, a repeat of 2020-2021. Bears in hibernation.During the first dive, volume is at its lowest. It dips slightly during the formation of the second dive in the middle, then gradually rises as the final shake-off takes shape, eventually reaching a high point.
Observe what's happening, a divergence between price and the On Balance Volume.
2020 // While the stock formed lower lows, the OBV stayed near the same level. During the first dive (part of a triple dive pattern), NIO’s On-Balance Volume kept declining until the second dive formed, after which it began to rise.
2025 // The OBV forms higher highs with each dive. While the price is making lower lows against a descending resistance line, the OBV is trending higher. Why is the price dropping when the OBV has reached the same level? I’m sensing a reversal is on the horizon.
The OBV is acting up.
What do you think? I'm very bullish.

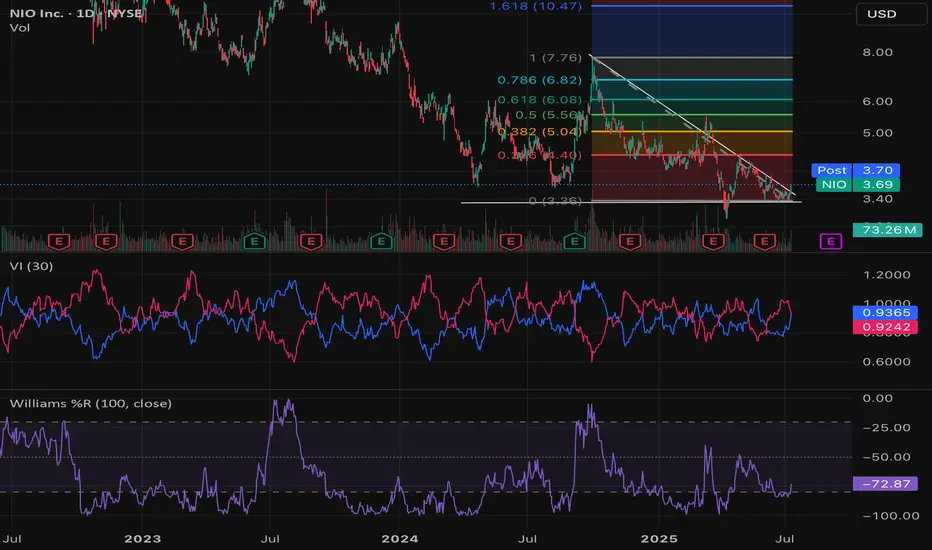
$NIO Fibonacci Analysis. Reversal is coming.Placing the fib-retracement tool on the top of the chart and the recent bottom, I see that many level coincide with the support and resistance areas on NIO's chart.
Short-term, I see NYSE:NIO breaking out of this falling wedge:
It takes ~140 days for the third dive to play out. (Inverse H&S pattern, IMO).
See my previous post for a more in-depth explanation:

$NIO is looking very explosive.Nio has seen a long period of consolidation and the sentiment is at all time lows, it seems.
I think that the stock is in the 'depressive' phase where holders are exhausted, and accumulation is taking place. I'm betting on a breakout to $10, and then $40 on a long-term rally.

$NIO Price will see a rally to $30 during the coming China rallyNYSE:NIO is an EV maker in China, that moves close to AMEX:KWEB and other ETFs.
We didn't see the stock price move like during this TVC:HSI or NYSE:BABA rally, where the large Chinese equities were bid up this week. Instead, NIO has stayed flat.
Looking at the historic structure, and NIO's pattern today, I compare them and form a conclusion that this marks the beginning of the rally.
I think that the bottom is in, and that this 'triple dives' pattern represents a large reversal pattern, dating back 1 year. Just come back to this chart 12 months from now, and tell me what you think.
Update:
Look at the tilt of the support lines and compare them to each other.

PSNY - MACD trying to cross on the daily. First positive signal**MACD is trying to cross on the daily... first positive signal.** ✅
**Second positive signal: the 50-day moving average is about to flip bullish.** 📈
Even these damn daily candles are green! 🔥🚀

The Hang Seng, NIO ADR and NIO Hong Kong: Inverse H&S pattern.These Chinese instruments look bullish in the short- and the long-term.
With an inverse H&S formed on the TVC:HSI , a breakout will push NYSE:NIO higher as well.

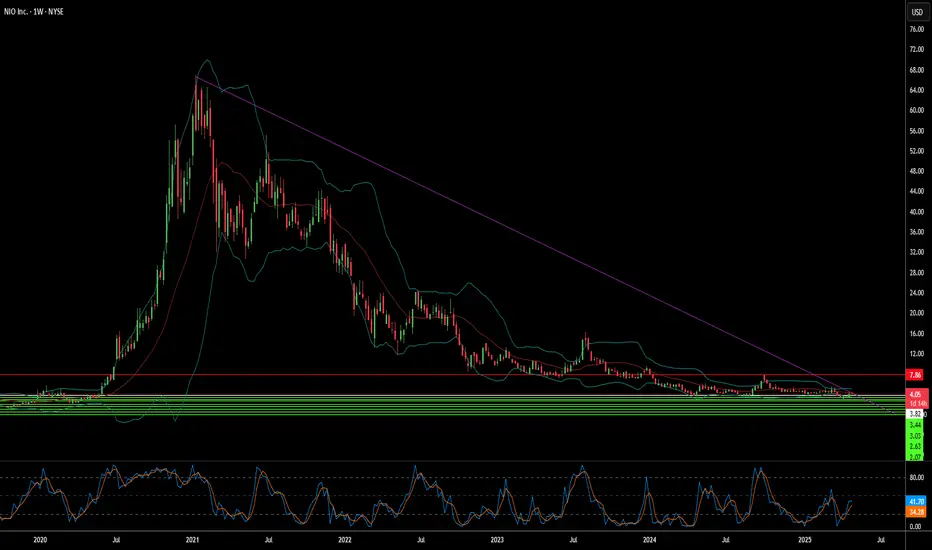
$NIO A massive Rising Channel & Wyckoff Accumulation
NYSE:NIO has been in a downtrend for over 1,450 days—could it finally be time to shine? ⌛️
A massive rising channel: early projection based on top pivots and potential mid-range pivots. 👀
Hey community, do you still believe in NYSE:NIO ?
Are you holding 💎🖐️ and staying unfazed by the downtrend?

$NIO - $2.43 Price Target with BEAR FLAGThere is a major bear flag setting up, go short at the break of the flag for price objective target of around $2.43.

NIO Wedge BreakHey y'all I'm back from hiatus. Had a kid so that took up a lot of my energy. Anyway, NIO looking to break the downward resistance it's been in since October. Looking good. Targets: $7-8

It's Finally Time for NIO to Shine: Bullish Trade Setup AheadNIO Trade Setup 🚗📈
Take Profit 1: $5.00 (23.6% Fibonacci retracement)
Take Profit 2: $5.42 (38.2% Fibonacci retracement)
Take Profit 3: $5.77 (50% Fibonacci retracement)
Take Profit 4: $6.11 (61.8% Fibonacci retracement)
Take Profit 5: $6.58 (78.6% Fibonacci retracement)
Stop Loss: $4.10 (Below the support zone and the lowest Fibonacci retracement level)
Reasoning and Fundamental Analysis 📊
NIO is experiencing strong growth in the electric vehicle (EV) sector , making this trade setup especially promising. In December 2024, NIO delivered a record 31,138 vehicles , marking a 72.87% increase from the same month last year. Additionally, NIO's Q4 2024 deliveries of 72,689 vehicles exceeded expectations , showcasing the company’s solid growth trajectory.
Key factors supporting this growth include:
A diverse lineup of high-performance vehicles, such as the ES6, ES8, ET5 , and the upcoming ET9 model launching in March 2025.
Onvo's L60 model, which has gained traction and is expected to ramp up production to 20,000 units per month by March 2025.
The launch of Firefly, NIO's third brand focused on compact cars, with the first model beginning deliveries in April 2025 in China and expanding to Europe.
NIO’s Battery-as-a-Service (BaaS) model , which allows users to swap batteries at stations, continues to grow rapidly. The company is set to open its 3,000th battery swap station in China soon , enhancing its competitive edge in the EV space.
With plans to double its 2024 deliveries of 221,970 vehicles in 2025 , NIO is strategically positioned to capitalize on the booming EV market. This bullish outlook is the foundation for our trade, where the Fibonacci retracement levels serve as key targets for profit-taking as the stock moves upward. The stop loss is set below the key support zone, offering protection against sudden reversals.
Good luck with the trade! 🚀

China EV Market Weekly Update (W52) In the final week of December, NIO delivered 6,500 units, marking a 20% increase compared to the previous week and 14% YoY growth. For December, NIO's total registrations reached 20,000 units, with the ES6 (EL6 in Europe) and ET5 models dominating sales. Additionally, Onvo, NIO's sub-brand, registered 4,200 units of its L60 SUV (+101% WoW), contributing to a December total of 9,405 units.
Key insights:
Tesla posted 18,600 registrations (+6% WoW). Model Y remains the top seller, but Model 3 is gaining traction.
BYD led the market with 72,100 registrations, though this was down 18% WoW and 6% YoY.
Xpeng and Zeekr hit record numbers, with 10,100 and 8,900 registrations, respectively.
📈 Despite mixed signals across the EV sector, NIO’s growth is a promising indicator of its resilience in a competitive market. The rise in Onvo’s L60 SUV registrations further highlights potential in NIO's multi-brand strategy.
I'm back in the game. I sold my entire position at 7.47 on September 30, and people thought I was crazy. Anyway, I recently bought back around 4.55. This stock is playing yo-yo with our nerves, haha.
Next target? Early March 2025 (Fibonacci time extension) for a gain between +25% and +45%. Good luck to everyone!
sorry for all the drawings, this is my personal chart.
