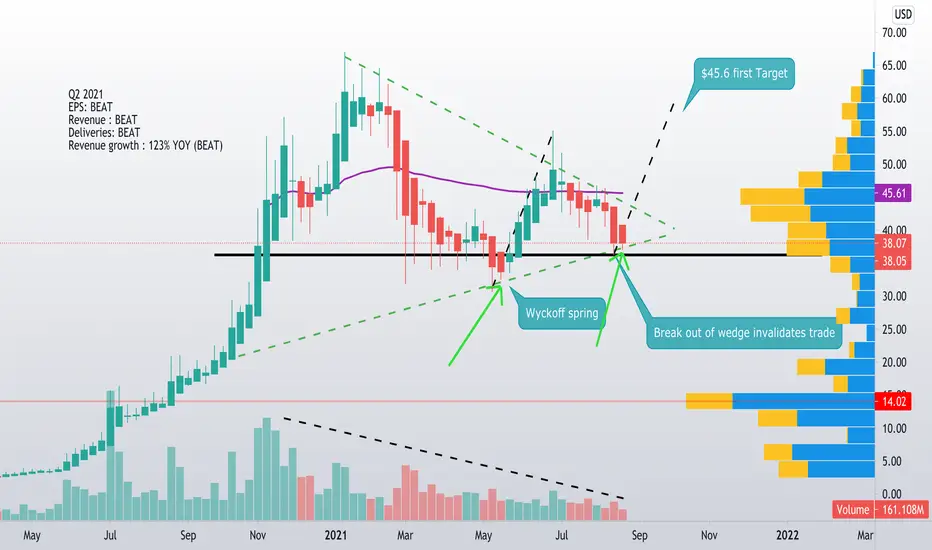
$NIO Weekly NIO continues to hold the wedge formation. Looking for a break out above or below in the next few weeks. Last weeks' candle looks similar to mid May where we saw a run from $34 to $55 .
My bias is to the upside - first target AVWAP $45.6
NIO

bio from red to greenlets go bio to fill the gap !!!
it was a trap today because nio is victim of covid restrictions , closing factories BUT THE DEMAND FOR CARS on august was ATH !

NIO Begins Allowing Customers to Test Drive ES8 in NorwayNio will enter the German market in 2021 at the earliest.
NIO has started allowing Norwegian users to test-drive its ES8 SUV, marking its latest step in entering the international market.
NIO Norway User Head An Ho shared the news on the NIO App, saying that the test drives opened on August 30 and nearly 300 spots were filled within three days of application.
On the first day of the test drive, about 60 Norwegian users got to experience the ES8 first-hand, Ho said.
At the performance experience area on the runway at Eggemoen Airport near Oslo, test drivers experienced the ES8's acceleration, as well as its handling performance.
At the local Heen Grustak off-road track, test drivers experienced the vehicle's performance in off-road scenarios.
NIO built a Mini version of the NIO House in Eggemoen Airport, where users can enjoy drinks from the NIO Café, according to Ho.
In addition, NIO transported an NIO EP9 supercar from the UK to the test drive venue, allowing users in Norway to get up close with the car.
This is NIO's latest move in the Norwegian market.
The company's app for Norwegian users was made available on the local App Store and Google Play Store on August 16.
The launch of the app means that local users are starting to have an exclusive online community, which NIO says "Shape a Joyful Lifestyle, is a vision we are pursuing together."
The app currently offers Discover, This Moment, a personal account management page, and NIO Life, meaning the company is bringing its lifestyle brand to Norway as well.
This article was first published by Phate Zhang on CnEVPost, a website focusing on new energy vehicle news from China.

Second Series of STOCKS Buying Areas!Hi followers and other TradingView users,
To discover new and exciting stocks for you, for me, for everyone then please name five stocks that interest you and describe why they interest you.
So, I would like to know FIVE of your favorite stocks, criteria to get your mentioned stocks into the list:
1) Name FIVE of your favorite stocks - full name and ticker. For example, Apple ( AAPL ), Tesla ( TSLA )...or just ticker, the ticker is a must-have!
2) Hit the "like" button of this post.
3) Hit the "follow" the get the update as fast as possible.
TOP10* most mentioned stocks get analyzed. My technical analysis will point out some possible breakout opportunities to buy the strength and corrections to watch - pointing out some lower levels where your alerts should be set!
* if it is not possible to identify logical buying areas from the graph, then I choose the ones (from the list) that have them.
Stay healthy,
Vaido

Supply and Demand Zones - An Approach to Identifying Key LevelsIn this video I will break down my process in identifying supply and demand zones through technical analysis.
Being able to identify these key areas allows for the trader to recognize potential levels of resistance and/or support.
I also go over a few other technical analysis approaches I use when looking to identify similar key levels on a chart. From my experience, it works best for me to stick with the first technical approach that I am able to identify when looking at a particular symbol's chart. The more you look at a chart the more you will find an opportunity to squeeze in another form of technical analysis, often leading to clutter and uncertainty.

Long $NIO CMP $38.93Long $NIO CMP $38.93 May breakout soon. Possible cup and handle pattern on daily chart. So far low volume. Keep it on watchlist if starts trading above 50 EMA

NIO: What you need to know about it!Hello traders and investors! Let’s see how NIO is doing today!
In the 1h chart, we see an accumulation . The support is at $ 36.68, which NIO retested twice, and the resistance is the $ 39.62, retested 3x. The 21 ema is flat, and it is always useless during sideways movements.
We have an open gap at $ 40.83, which probably will be filled, but NIO must escape from this congestion first. It is interesting to note that NIO has no other meaningful resistance besides the $ 46.36, and if we see an upwards breakout from this congestion, this is going to be our target.
In the daily chart, the situation looks interesting. It seems the $ 39.62 is a pivot point , and this could work as a nice reversal for the mid-term on NIO. We already did a higher low, if we trigger this pivot point, and do a higher high, it’ll be perfect.
Probably we’ll defeat the 21 ema, and the next target is the $ 46.36, as we said, as this was the previous top level.
However, it is a little too soon to assume anything, so, let’s wait for more confirmation. NIO looks promising, but it must trigger its signs first.
If you liked this analysis, remember to follow me to keep in touch with my daily updates.
Have a good day!

$NIO Target 54.08 for 23.47% $NIO Target 54.08 for 23.47%
Or next add at 33.52
I’m starting to feel a little bullish on NIO… this has been a consolidation level before… We are below a bunch of moving averages here so I might be a little early, but that’s ok. I’m long bullish on NIO…
I do NOT think this is going to make any new ALH’s any time soon, but a good run is coming, I think…
-----
—
On the far right of the chart is my Average (Grey) Current Target (Green), and Next Level to add (Red) Percentage to target is from my average.
ONLY ADD at support levels & FIB levels… labeled (most of the time)
(Support=Green, Resistance=Red, Trendlines=Blue) Fib will be labeled if any and their colors will vary.)
I start every position with .5 - 1% of my account and build from there as needed and as possible.
I am not your financial advisor. Watch my setups first before you jump in… My trade set ups work very well and they are for my personal reference and if you decide to trade them you do so at your own risk. I will gladly answer questions to the best of my knowledge but ultimately the risk is on you. I will update targets as needed.
GL and happy trading.
IF you need anything analyzed Technically just comment with the Ticker and I’ll do it as soon as possible…

$nio everything under controlstill up trend from uptrend support line at bio
without reason decline before the major big move
disclaimer


NIO: Giving us early signs of reversal!Hello traders and investors! Let’s see how NIO is doing today!
Yes, NIO is giving us early signs of reversal, as we thought in our last analysis. Now it is dropping, but is there any reason to panic? Let’s see.
The $ 39.62 seems to be a resistance for NIO, which made it drop again to the 21 ema, and it might even retest the $ 37.89, the first pivot point that reversed the trend.
I don’t see this as a reason to worry, as NIO is doing just fine for now, and we lack bearish structures in the short-term. If we lose the $ 37.89 then ok, the bullish thesis will not work as we wish, but if we defeat the $ 39.62 NIO will fly again.
We have an open gap at $ 40, and no other meaningful resistances up to $ 46.36. The Risk/Reward ratio seems to favor the bulls here.
However, in the daily chart, the bulls are still in trouble. We lack bullish structure here, and the reversal signs in the 1h chart may be not enough. The 21 ema is pointing down, and we are below it.
It feels like if we are about to see a bullish reaction, it is still too early to tell. If we defeat the $ 39.62 in the 1h chart, it’ll be a good start, but as long as NIO keeps moving sideways, we can’t assume anything.
Let’s keep our eyes open here. If you liked this analysis, remember to follow me to keep in touch with my daily updates.
Have a good day.

NIO stock analysis using my boxes strategyToday I am taking a look at a Chinese EV manufacturer NYSE:NIO stock price movement.
NYSE:NIO stock price has been moving mostly sideways since the end of last year.
Price was trapped in between two major supply and demand areas: 30.5 and 54.5. This area is outlined by a big box.
The only exception was the breakout on January 2021, but price quickly reversed after rejection from the trend-line at 66.7 level.
Key points of analysis:
Boxes capture consolidation of a price range or simpler a sideways movement.
Stock price trends after a box breakout to test support/resistence.
When you see this kind of movement in price the best strategy for a shorter-term trading is buying at the support levels and selling at the next resistence.
My outlook for the stock:
I believe it will go higher in the shorter term to test 47-49 levels.
Trade wisely and good luck!
-----------------------------------------------------------------------------------------------------------------
Disclaimer!!!
This is not financial advise.

$NIONio forming a symmetrical triangle on the daily chart.
Sitting right at upwards support could give great RR ratio.
MACD getting ready to curl while the RSI is trying to push above 50.
Keep this on your watchlist.
- Factor Four

NIO on Resistance level S@F3Nio on resistance level in a LLT setup
2 trades coming up
expecting resistance to hold as it is a major zone

$NIO NIO delivered 7,931 vehicles in July 2021, representing an impressive 124.5% year-over-year growth. The company’s cumulative deliveries of its ES8, ES6, and EC6 vehicles hit 125,528 in July.
NIO entered a long-term manufacturing agreement with Jianghuai Automobile Group Co., Ltd., and Jianglai Advanced Manufacturing Technology (Anhui) Co., Ltd on May 24. Under the agreement, which is valid through May 2024, NIO’s vehicle production is expected to increase by 240,000 units annually.
For the fiscal second quarter, ended June 30, NIO’s revenues stood at RMB8.45 billion ($1.31 billion), representing a 127.2% increase year-over-year. NIO’s vehicle sales increased 127% year-over-year to RMB7.91 billion ($1.23 billion). Its gross profit grew 402.7% from its year-ago value to RMB1.57 billion ($243.77 million).
The Street expects NIO’s revenues to rise 109.8% year-over-year to $1.45 billion in the current quarter, ending September 2021. Its EPS is expected to grow 47.3% in the current quarter versus the same period last year. Shares of NIO have gained 171.2% over the past year.
All seven Wall Street analysts that rated NIO have rated it Buy. The stock’s $66.01 median price target indicates a potential 73.3% upside from its last closing price of $38.10. The 12-month price targets range from a low of $57.00 to a high of $72.00.

NIO - chart updateNIO: Yellow zones are key levels to activate this wave 3 in white. Long term play: Buy zone 33-40 USD.

NIO To $40? Summary:
I will be placing options calls for NIO to hit $40 a share by 8.27.21 and placing these calls based on candle stick trend, Elliot wave analysis, and trend lines.
Thesis:
NIO will hit $40 based on its current uptrend in candlestick analysis, trend lines show price path and projections based on symmetrical price history. This is a very risky play as the MACD show weakening bullish divergence on the 45min as well as a high RSI. However we have an ATR of 2.80 on the daily which is supported by the Elliot wave trend line at $41.74. The solid yellow bar is an official wave while the dashed line is a drawn in continuation which we have supporting evidence that it can be continued.
Supporting Evidence:
-Average True Range 2.80 ( on daily )
-Candle analysis ( higher highs and higher lows )
-Buy signal initiated 8.20.21
-Elliot Wave formed from private script
Failure Is An Option:
-MACD shows decreasing bullish volume
-ATR is $48.00
-RSI 60.30
Conclusion:
As I consider myself a trend analyst, following the trend is key. I have had past failures due to misleading indicators. I have grown to rely on too many indicators when they are simply a tool and not a fortune teller. In 2020 when I was most profitable I followed the trend and used the indicators as a guide. I guess what I am trying to say as I am not relying on indicators on this call and ignoring the MACD, ATR, and RSI. Would love to hear your thoughts in the comments & make sure to follow and watch this succeed or fail as that is always an option.

NIO LongHello everyone! As you guys can see, we are currently trading bellow 200 EMA. Previously it acted as a great level of support. I expect it to continue doing so. Keep in mind we also have a gap to fill. So I think that $NIO is going to do so in the next couple of trading setions. Good luck!


NIO: The start of a reversal?Hello traders and investors! Let’s see how NIO is doing today!
We have an important bullish structure in the 1h chart, and this could make the difference for the short/mid-term. NIO is triggering the bullish pivot point at $ 37.89 , and if we close above it, we’ll see something new, something NIO hasn't done since it started its fall from the $ 46 area.
We have 2 open gaps that are targets for us, and they might help NIO to reverse the trend.
Now, we must keep above the 21 ema, and if this pivot point works, we might see a good reversal in the daily chart:
In the daily chart, we have a bullish Harami , which doesn’t tell much, but the Harami’s high is the pivot point seen in the 1h chart, so we have at least one confirmation of a possible rally in the daily chart.
I like the fact that the volume increased after we found a bottom, and any reaction here might lead NIO to the 21 ema in the daily chart again, around the $ 41 in the short-term.
We lack other bullish signs that could confirm a reversal in the mid-term, but the signs we see today are a good start.
Let’s follow NIO closely from now on. If you liked this analysis, remember to follow me to keep in touch with my daily updates.
Have a good day.

TrendyTrades: NIO above 37.90Looking for a close above 37.90 and we're taking NIO long into the gap fill. Lets goooo!
