NIO

What's next for us? 🤓Ok, didn’t trigger any good buy recently, and it is just falling to its supports. It lost all the Fibs retracements we talked about last week (but they did work pretty well for some time), and now it seems all is red for NIO.
The good news is that the RSI is very oversold, meaning we might see a rally tomorrow to the 48. The problem is that we aren’t near any support, but are close to the gap and the 44.89.
The 4h chart is not oversold, and this indicates we might still close the gap and hit the support at 44.89, or the 43.89. We have no important sign, but the conflict between time frames is interesting. Will NIO do a rally to the 48 in the 30min, or will it fall to the supports in the 4h chart?
There’s nothing interesting here for now, but I’ll keep you guys updated.
If you liked this trading idea, remember to click on the “Follow” button to get more trading ideas like this, and if you agree with me, click on the “Agree” button 😉.
See you soon,
Melissa.


Nice Short On NIO This Week Or Next?TL Break + New supply created on NIO.
I'm Expecting a strong break lower this week, options are giving great rewards.
I will add to my position at the 51.0 mark if we happen to retrace.
Short bias on Nio. What do you think ninjas?

$NIO Feeling For Support $48.50Video update on $NIO after a significant pullback last week! Where is support?

NIO 88$ before december 2021I will trade by this strategy on NIO dec 2021\2022 Warrants 35\65$ CALLS

What to expect next week? (another target hit) 🎯Yes, we got it right another good movement on NIO, e just missed the target for 20 cents! I’m sorry, but I’ll consider it target hit!
The RSI was extremely oversold this morning and NIO bounced back to the 38.2% retracement.
Now we have a hammer in the 4h chart, but we are still trapped inside the retracements, and I don’t see NIO doing nothing good while it is between these points. But if it triggers the hammer I’ll consider a good thing!
Today I won’t set any target for NIO, and I’ll just wait for new movements next week. I’ll update you guys on Tuesday.
If you liked this trading idea, remember to click on the “Follow” button to get more trading ideas like this, and if you agree with me, click on the “Agree” button 😉.
See you soon,
Melissa.

SGBX Building Blocks For Which Direction?SGBX has had a great run so far, can't argue with that. But now that volume is a bit lighter, is it building blocks for new highs or for a failure at resistance again? The .50 Fib line has been a relatively consistent area of resistance over the last few weeks. Meanwhile, .618 seems to be an area that SGBX has bounced from after a pullback. As it approaches the 50 again, volume could play a key role. Also, any industry influence may be something to pay attention to as well. For instance, it has exposure to several popular niches including EV:
"SG and Blink Charging Co. (NASDAQ: BLNK), an owner/operator of EV charging equipment and services, entered into an exclusive Master Development and Production Agreement last year. Blink’s EV charging solutions will be deployed along with SG Blocks’ container-based modular building structures. Essentially, the two will create EV charging containers providing charging solutions for EV drivers. While this isn’t the only industry SG focuses on, it does give them some exposure to one of the newer tech niches to watch in 2021."
I think as this continues to consolidate, the $5.70 area may be the closest to pay attention to for it to either break and hold above or fail. Also, depending on the volume (and it isn't on the chart right now), the 50DMA is starting to curl up toward the 200DMA. Volume would need to pick up to confirm any possible golden cross however. We'll see what happens.
Quote Source: Best Penny Stocks To Watch If You Like Tech? 7 For Your List In 2021

I warned about the 52.70... 👇Yes, once again, NIO did exactly what technical analysis said it would. We lost the 52.70 today, and this made NIO drop to the target we talked about yesterday, the 38.2% fibs retracement at 50s, exactly as we said it would yesterday.
The RSI was too overbought and could easily see this coming. But what about now?
In the 4h chart we see the fibs retracement we talked about. It is amazing how technical analysis works. Now it is harder to tell. A trade from the 52.70 to the 50.45 was easy, but now is different. I think if it loses the 50.45 again, we’ll go south to the 48.33 (61.8% retracement).
NIO is still overbought, but I say that now the moment is harder because we can never underestimate NIO’s momentum. We must proceed carefully and always wait for confirmation, ok? The momentum is still bullish, and a simple drop doesn't mean that NIO will crash (which is something I don't believe will happen, as I have a few NIO with me as well, that I carry since the $30s). I’ll be back tomorrow.
If you liked this trading idea, remember to click on the “Follow” button to get more trading ideas like this, and if you agree with me, click on the “Agree” button 😉.
See you soon,
Melissa.


NIO - Long for a short whileWe are hitting a solid support and can see NIO bouncing till $53.8. Sellers are exhausted and that might mean buyers taking control. Keep an eye on the volume though as the movement to $53.8 might not be a confident/ sustainable one. Avg. volume has been low.
If you find my analysis useful and helpful, please do consider subscribing and liking my work. This helps me stay motivated.
For any questions or comments, do let me know!
-- For educational purposes only. Do your own research before making investment decisions.

NIO: Do you know about the Principle of Polarity?Hello traders and investors! NIO hit our target at $ 50.40 this week, since we set the target at this level, on Jun 14 ( link to this analysis below this post, if you are curious).
Now it defeated the $ 50.40 resistance, and today it is doing a pullback to this price again. This follows the Principle of Polarity : Previous resistances/supports are going to work as supports/resistances in the future. This happens because the market has a memory, and some key points are just perfect for the players to set their orders. Just to give you another example, I think this is better seen on WISH, as we discussed about in this analysis:
What’s more, NIO is doing a good reaction above this support, and it is quite close to the 21 ema as well.
In the daily chart, we have a classic Dark Cloud Cover pattern, but as long as it keeps above the $ 50.40, all we can say is that this is just a pullback in the 1h chart. The volume is quite high, though, and if NIO triggers this pattern, it might very well retest the 21 ema in the daily chart.
We have been bullish on NIO for a quite long time now, even when everyone was very pessimistic about it. This DCC is not enough to reverse the bullish bias, but it might indicate some weakness.
Keep in mind that NIO has an open gap at $ 58.65, and this is going to be our next target, if it does any good bullish pattern around.
If you liked this analysis, remember to follow me to keep in touch with my studies, and support this idea if it helped you!
Thank you very much.

Could this ever drop? Watch these points! 🚀Ok, NIO is flying like a rocket and there is nothing on the charts telling me it’ll stop doing this. But we do have some points to watch in the next days.
Yes, NIO is oversold, but this doesn’t mean it’ll drop. It means we should be careful and not be surprised if we see it dropping. We have 0 confirmation of a pullback, but one point to look is the 52.70. If NIO breaks it, it might drop to one of the fibs retracements in the 4h chart:
We are outside the BB again, and the RSI is near the 80 level. A correction to the 50 (38.2% retracement) would be nothing for NIO. But again, no confirmation yet.
What if NIO drops to one of its retracements? We should look for buy signs, because it is a bull trend. No rocket science here.
If you liked this trading idea, remember to click on the “Follow” button to get more trading ideas like this, and if you agree with me, click on the “Agree” button 😉.
See you soon,
Melissa.

50 has been always a critical level of NIOAt this price, NIO's market cap is 81 billion dollars, which ranks NIO 7th among all the Automakers in the world..!
Yes, you must be shocked, NIO above BMW, Ford, Honda, Ferrari..!
This will be corrected by time..! I'm 99.99% confident..!
This company has produced 102,803 cars so far! (As of 30th April 2021)
All the bubbles are temporary..!
Typically, a bubble is created by a surge in asset prices that is driven by exuberant market behavior. During a bubble, assets typically trade at a price, or within a price range, that greatly exceeds the asset's intrinsic value (the price does not align with the fundamentals of the asset).

weekly chart shows what you cant see..!Daily chart:
4hs chart:
1hr chart:
30 minutes:
A note to those who are worried about my losses shorting NIO:
I shorted NIO 7 times in the past 4 months, (buy naked put at 43,34,39,47,48,47,48.5)
closed 4 trades with +100% profits in less than 24 hrs
closed one with +100% profits in 48 hrs
closed on with 25% profits
closed the last one with a 30% stop loss.
in each trade, only 5% of my capital was involved!
and I was not alone, at least 60-80 of my followers did the same thing..!
have you ever asked yourself why in the last 6 months the number of my followers increased from 178 to 5532 ???
because I can do something like this:
time and price 100% accurate!
on January 11th, 2021 I detected NIO top!
Sorry, I think it was January 2nd..! when the market was closed! price was 48.74, I predicted the Top at 35% higher in the first 2 weeks of January 2021..!
and published the 1st short idea at 57..!

NIO - Potential 16% Rise! 💪-Lets wait and see how big boy will slowly recover back to the good old levels.
-Potential rise in %: 16%

NIO BUY OR LONG , TARGET $80NIO confirm the " Cup And Handle " pattern has the upper handle of the Cup, it is an
exception, target determines $80 area, stop loss 7%

Could NIO keep climbing? 🌈 ☀️The something incredible we were saying last week happened today! The BB are spreading again, and NIO is back to the world of living, after being dead for some days.
We are breaking the 46.19 from below, an impressive movement, and this was the condition for a bullish reaction as we also talked about last week.
Now what?
NIO closed the gap at 49.16, but the RSI is not overbought in the 4h chart. This tells us that NIO still can climb more. The head and shoulders pattern wasn’t triggered, and it is not a threat anymore.
This reaction occurred above the 20ma and the BBs are spreading here too.
All of these are great signs for NIO, and it seems it’ll keep climbing, until we see something new around.
If you liked this trading idea, remember to click on the “Follow” button to get more trading ideas like this, and if you agree with me, click on the “Agree” button 😉.
See you soon,
Melissa.

NIO: Still a bull trend, as we thought.Hello traders and investors! I told you that the main bias was bullish!
Let’s quickly update NIO’s last movements: Despite the main bullish bias, Nio was in a short-term bear trend, which was completely denied when it defeated the $ 46 , as we said in our last analysis. The H&S chart pattern wasn’t triggered, so, we had no bearish confirmation in the mid-term (not even in the short-term). Check my last analysis about NIO, if you are curious. Link below.
Now, we see a powerful movement today, but it didn’t hit our target at $ 50.40 yet. What’s more, if it does a top sign around, it might drop to its support levels again, but we have no confirmation yet. Remember: To not get burned, always wait for confirmation.
We are quite close to the green line in the daily chart, but the problem is if today’s bar is an Exhaustion Bar or not.
It is too soon to say anything, but since we have a sequence of higher highs/lows in the daily chart, all we can assume is that the bias is still bullish. If NIO loses this bar’s low, then ok, it might see an Exhaustion Bar, indeed.
The idea of an H&S is now invalid, and now see no possible bearish reversal patterns around, just a possible pullback sign, if we lose today’s low.
These are my insights for NIO. If you liked this analysis, remember to follow me to keep in touch with my daily studies, and support this idea if it helped you!
Thank you very much!

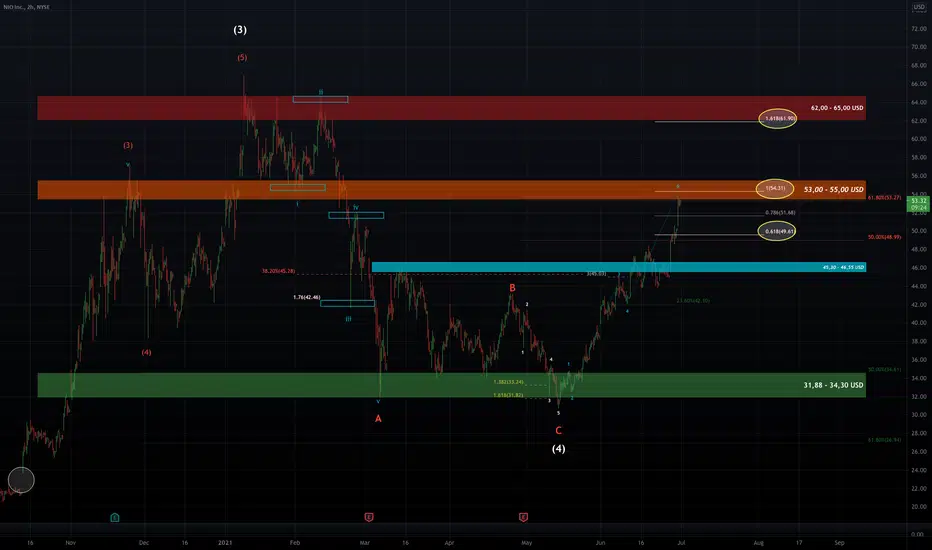
NIO - chart updateNio: Minimum target for this impulse check. Close above 49.61 is important. Next targets: 51,68 // 54.31 // 61.90

NIO LONGLooking to add to my NIO position should the price break down towards the zone marked.
Long term bullish.
** Not trading Advice**

🟢 $NIO Target 53.05 for 32.39%$NIO Target 53.05 for 32.39%
Or double position at 27.09
NIO RSI support bounce to target? Maybe...
—
On the far right of the chart is my Average (Grey) Current Target (Green), and Next Level to add (Red) Percentage to target is from my average.
I start every position with 1% of my account and build from there as needed and as possible.
I am not your financial advisor. Watch my setups first before you jump in… My trade set ups work very well and they are for my personal reference and if you decide to trade them you do so at your own risk. I will gladly answer questions to the best of my knowledge but ultimately the risk is on you. I will update targets as needed.
GL and happy trading.
I finally added my YouTube Training Video to my profile tagline since I’m not allowed to on here. It’s a quick 15 minute training video on how to set up your chart and how to spot opportunities. So check here first but If you have questions just message me.
