NIO Rejected on 1W Order BlockWe can see a clear rejection on the 1W chart for NIO. On the 4H, NIO has just choched. Stoploss should be placed below the order block, aiming for the last top.
NIO

TSLA tyring to get to blue skyTSLA on the daily chart descended from a triple top Summer '22 into a downturn which
reversed after earnings in late January. Since then with the usual waves of up action and
retracement it has risen into its current range also going through a cup and handle pattern
from early April into late May. On the chart with the volume profile and anchored VWAP
overlaid, price is at the confluence of the POC line and the mean anchored VWAP - over the
past year the highest volume of trading was at about $185. RSLA is now above that
bullish momentum. TSLA short-selling bears are getting destroyed right now. Their buying to sell
is the genesis of a potential short squeeze. The latest trend started after an announcement of
partnership with Ford regarding charging stations. I have drawn onto the chart what I see
as horizontal resistance lines for targets in a trade. Aslo on the chart is a set of zero-lag EMAs
to provide further context. I will take a trade of four additional call options with a strike of
$185- I will close one for each horizontal target reached. I will run the last contract on a
trailing stop loss of 20% while expecting an overall conservative realized take profit of over
300%. The stabilization of macroeconomic headwinds in both the US, Europe and China
will allow significant tailwind to push TSLA higher. One of those tailwinds could be the
imperative that a rising price places on short sellers including a vast array of put options.

PSNY break out above the Ribbon (Setting up for Mark Up phase)PSNY has been relatively stagnate for a while.... which is good after an emotional dump into a new low. It means its accumulating. This company is undevalued compared to the other electric car companies out there. I wouldn't expect this stock to move a lot up front. However its cheap to do a leap on this til jan 24 and let it do its own thing. Out of all of the electric car stocks this one seems the healthiest financially and is actually delivering 100k of vehicles with goals to out do its self this year.
The indicator is the ESVO it shows where price and volume are in sync and when price breaks out above them its a sign that its hit accumulation and preparing for a mark up phase. The push back down into the ribbon is the last step before it takes off... This should bounce off the ribbon when it comes down and continue to make for new highs until it runs out of steam. This could be days , weeks , months, or even years..... depending on what time frame its doing it in and what part of the bigger move its in. Look at ENPH when it was $50.
by iCantw84it
05.02.23

NIOWedge break on exploding volume, in oversold conditions gapping above 50SMA. pt1 is 10% away if market gets legs watch this closely

NIO Options Ahead of EarningsIf you haven`t bought NIO here:
Then Analyzing the options chain of NIO prior to the earnings report this week,
I would consider purchasing the 8usd strike price Calls with
an expiration date of 2023-7-21,
for a premium of approximately $0.65.
If these options prove to be profitable prior to the earnings release, I would sell at least half of them.
Looking forward to read your opinion about it.

BUY NIO BUY EARNINGS CALLSStarted a 5 year long position today will attempt to enter full position below $10. Today I entered large earnings gamble on call options.
NIO longs for an earnings playNIO has earnings coming up at a good time when the China ecomony is recovering from
the lockdown and holding interest rates down to support economic expansion. NIO is also very
busy selling their EVs in Scandinavia. On the one-hour chart, NIO has risen above the demand/
support zone and seems to be retracing the recent downtrend. The indicator shows momentum
and RSI to have crossed the 50 line but money flow is lagging. Volume is picking up in the last
few weeks and price has now crossed over the POC line of the volume profile as another sign
of bullish buying pressure and dominance. I will trade a long trade in NIO now before the
earnings expecting good price action and volatility will yield decent profit in the trade.
The stop loss will be below the support zone and the first TP at $8.00 being the top of the
high volume area of the profile while the 2nd TP will be $8.50 and final at $9.00.

NIO Stock: Is a Spring Reversal Imminent?I had been shorting NIO stock due to the very apparent downtrend as portrayed by the 50 and 100 EMA. However, I noticed that the swings from high to low were getting narrower, signaling a loss in momentum. Throwing some zones on the chart, you can see a small trading range has formed.
I compared the Wyckoff accumulation schematic to the NIO chart. The schematic calls for hard selling followed by strong buying and consolidation. In NIO, there was hard selling in March and May, with strong volume. This indicates that there were large interests selling their shares during this time.
However, in November 2022, we saw a selling climax with strong volume. This was followed by a bounce in price called the automatic reaction (AR). This bounce is likely due to institutional investors buying up the supply. The secondary test, which occurred on expectedly lower volume, further supports this theory.
The millionaire-making question is whether we have seen an ST in phase B. If we have not, it is likely that the trend will continue lower to the sub-$5 range. However, if we have seen an ST, it is likely that we are seeing a spring. A spring is a shakeout before institutional investors decide to take the stock higher.
I think it is important to note the increase in volume during the month of May when the spring started. High volume during a spring suggests that big money is scooping shares for cheap. I believe that this is the perfect time for institutional investors to swoop in and use earnings as an excuse to push the stock higher.
What are your thoughts?

NIO: Going to $5-8. Bulls will be miserable all year :(It seems like NIO stock has fallen a lot, doesn't it? Well guess what... it should fall another 60%+ from here.

TSLA Cup & Handle Bullish ContinuationTSLA as shown on the 60 minute chart has been in a cup and handle since the last earnings
report. Trading volumes increased then and the print is a gradual downtrend reversed to a
gradual uptrend then the handle formation and finally the breakout above the lip of the cup.
TSLA and Ford this week announced collaboration on a charging network primarily with Ford
customers getting use on existing TSLA stations and both companies expanding the network.
Perhaps this mutually benefits both companies. China holding interest rates and perhaps
lowering them more easily allows financing of new Telsas in TSLA's biggest market. Based
on the technicals about the cup and handle and the height of the cup. the pattern which has
good reliability predicts bullish continuation of $40 upside. In consideration of this I will
take a trade of an additional 2 contracts ( strike $180 Exp mid November).

BABA @ Long Term SupportOn the 4H Chart, BABA is sitting in the the demand zone at a double bottom retest. Earnings
two weeks ago beat expectations. Fundamentally, China is holding interest rates down and
may even decrease their prime rate. Domestically, chaos continues with more rate increases
possible and the debt ceiling issue impending resolution versus diseaster. I see trading and
investing in foreign based intruments such as BABA , NIO along with ETFs diversified into
China, Europe, Korea Japan and maybe others to be a useful means to diversify risk. I will take
a long trade in BABA because I believe it will rise from its usual bottom.

NIO $NIO Long#NIO NYSE:NIO
📈Chart Pattern: Falling wedge
🫵Perspective: Long
💔Stop loss: Breaking $ 6.95
NYSE:NIO SKILLING:NASDAQ AMEX:SPY

FSR follows TSLA / NIO in uptrendFor the month of May on the 15-minute chart Fisker is up 27% while the general market QQQ
is up merely 4%. FSR riding an ascending parallel channel tested the channel yesterday. This
was met with high relative buying volume. (Fundamentally, TSLA and NIO are rising as well
as EV stocks gain some momentum ) The Better RSI indicator is oscillating between oversold
and overbought providing reasonable entries. The volume profile shows the highest volume
support from $ 61.0 to 6.65. The uptrend started at 5.10 and the POC line which is the likely
Fib 0.5 level on a future retracement combined in context suggest a target of 7.10 for the
current uptrend. I find this to be suitable for a long trade setup also factoring in a stop loss
at 6.55 just below the parallel channel.

ARVL Penny EV Stock Momentum from EarningsOn the 2H Chart ARVL is always been underneath the Ichimoku cloud. Since earnings this has
changed. The earnings were nothing special. ARVL as a startup is still losing cash; it is priced
on the potential of the future. ARVL is in the delivery truck and bus segment of the growing
EV industry. It does not compete directly with TSLA. On the chart relative strengh also rose
over its cloud going from 40 to 70. Notably it crossed above the Ichimoku cloud simultaneously
with crossing over the POC line. Traders including myself watch for confluences to support
bias and a trend.
My feeler call option with 5 DTE trade was taken on Friday is up 228% over the weekend.
I will now take ten more but extend the DTE to 6/2 I see this as a typical penny stock high
reward high risk. This is like TSLA in its infancy. Also the higher it gets away from delisting risk
the more momentum it might have. This compares well and perhaps better than
LCID NKLA and PSR because it has a niche focus which protects it from the center
of the competition with other EV stocks.

TSLA is pushing againTSLA on the 4H chart started 2023 with an upward trend taking it from basically $100 to a
doubling by February 15th then a reversal in a fibonacci retracement fashion to mid level
level by March 10th with a bounce up and then resettled in the same area by April 20th
then holding above the upper of a VWAP band until its reversal a week later. At present,
TSLA is pushing higher and has crossed ever a low VWAP band as well as the mean from the
anchored VWAPs. TSLA reversed on April 27th at the bottom of the high-volume area of the
profile and is now progressing through it. I believe that this is a good long setup. The stop
is VWAP at $178 The target is $ 196 which is the neckline of the head and shoulders from
February as well as the April 1 pivot high. i believe that TSLA has enough interest and
typical momentum to push $10-11 despite headwinds like interest rates and loss of
market share in China and the Nordic countries due to USD strength. The volume indicator
shows relatively high volume compared with this past winter. I think this accumulation will
result in price appreciation as things progress ( as per Wycoff).

NIO breakout from descending wedge NIO is shown on a 4H chart. It has been downtrending for 3 months. Howver, April and May
has high relative volume trying to reach the capitulation of a bottom. Thursday May 4th
marked a near term bottom. NIO is now rising and breaking out of a falling wedge drawn onto
the chart. It has crossed over the POC line of the volume profile ( This is the price level of
the highest volume of trading). Price is impending a mean anchored VWAP. Relative strength
has spiked. With this confluence of bullish signals, I have taken a long position which has
appreciated 4.6% in the first half of the trading day having opened the position in the pre-
market. I will now take a trade of call options striking $ 7.00 DTE 7/21. The rising dollar
strength has confounded TSLA's sales in China and the Nordic countries. NIO is on the ready to
pick up the slack.

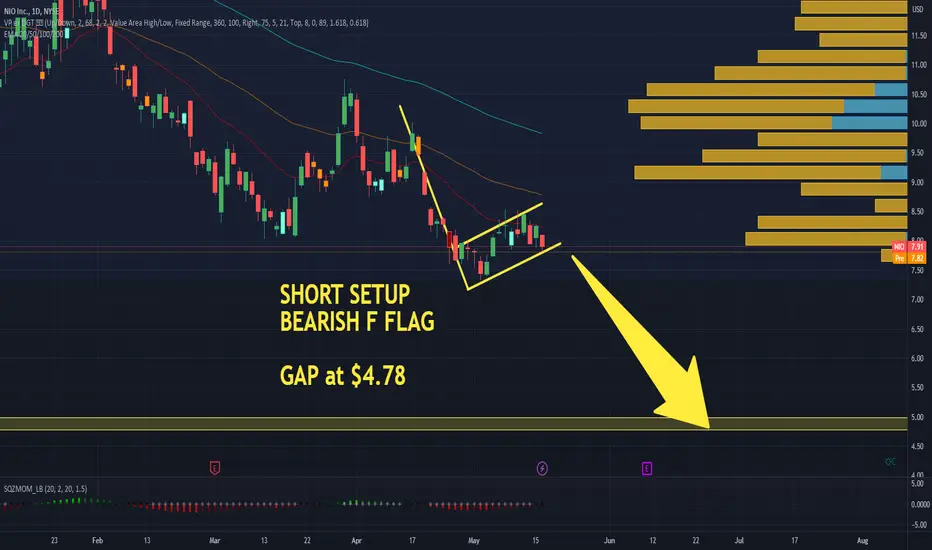
$NIO - BEARISH Flag Setup to $4.78Nio has finally setup a nice BEARISH F FLAG. Watch for a break below the flag. Short at the break and follow thru with a new leg extension. There is a gap that needs to be filled at $4.78

NIO: Trading in a Dangerous Area; Watch Out For These Key Points• NIO is trying to reverse the trend on the 1h chart, as now it is above the 21 ema, which is ascending;
• What’s more, NIO just filled one of its gaps at $8.29, but it seems this area is acting as a resistance now;
• The problem is that we don’t see a clear bullish structure, like a higher high/low yet. This gives the impression that this was just a short-term rally, not a real bullish reversal;
• To make things worse, NIO is on the verge of losing its previous support line at $8.03, and this could completely frustrate this rally;
• Therefore, NIO must close above this key point today, in order to avoid a bearish continuation;
• On the other hand, it seems that the $8.29 is our key resistance, and only by breaking it, NIO would actually turn bullish again. In this case, it could fill all the previous gaps and hit the $9.47 again.
• On the daily chart we see that the 21 ema acted as a resistance, and NIO failed in breaking it. This 21 ema is at $8.33 right now, close to the $8.29 seen in the 1h chart, making this area a dual-resistance level;
• Therefore, it is crucial for NIO to break this resistance as soon as possible, in order to trigger a meaningful bullish pattern.
I’ll keep you updated on this. Remember to follow me to keep in touch with my daily analysis.

TSLA Due for a pullback ?TSLA here in on a 30-minute chart. It is in a channel that has as its basis the 42 ( 7x6) EMA
with the upper and lower bands the 2.618 Fibonacci extensions of the basis value. Accordingly
when hitting the lower band, there is a high probability of reversal to trending up. Conversely,
when hitting the upper band, the price is highly probable to reverse into trending down. Here
TLSA is actually outside that Fibonacci band and getting closer to the absent 4.33 band
TSLA rose more than 5% in the last trading day. Reversion to the mean may apply.
The True Strength Index indicator shows a cross about to occur in the supply /resistance zone
a confirmation expectant for a reversal. Similarly, the Fisher transform shows the signal and
mean lines crossing and inflecting into a negative slope at the top red line. In the immediate
term history, TSLA ran up on Thursday 4/27 / Friday 4/28 hit the upper Fibonnaci band and
dropped after the weekend. I can see this as repeating
Aside from mathematics from the all-important trader psychology side of things, a large #
of traders are up on their position having made it through some downward price action
and then reaccumulation. It is now time to take full or partial profits and close some positions
In the meanwhile, short sellers can see the rise in the last trading
session as a pullback in the trend down and time being ripe to add to their position.
Other short sellers might liquidate and in doing so hold TSLA's price steady in buying to cover.
I can't see the psychology underway. I can however see the indicators and the mathematics
that is their foundation. I will take a trade of put options expiring 5/19 at a strike of
$175. I will watch for a reversal of the reversal mid to late week and upon seeing
it take a partial profit and hold the rest.

NIO REVERSES within descending parallel channelOn the 30-minute chart, I have drawn the upper (red) and lower (green) trendlines
of the descending parallel channel. While it had been riding the upper edge of
the Fibonacci/ EMA channel, it has reversed and headed toward the base EMA with
the candles green to red. The zero-lag MACD indicator lines crossed above the
histogram while the True Strength Index oscillator has had a line cross in the supply /
resistance zone for further information. I conclude it is time to close long positions
in profit and cross the aisle into short positions. I will take a put option trade for
the expirations of 5/19 @ $ 9.50 but a less risky trade would be a longer exiration
by 1-2 weeks ( while at the same time decreasing the reward potential.)

NIO SHORTstrategy short trend
NIO delivered 6,658 vehicles in April 2023, increasing by 31.2% year-over-year
NIO started the delivery ramp-up of the EC7 in late April 2023
NIO delivered 37,699 vehicles year-to-date in 2023, increasing by 22.2% year-over-year
Cumulative deliveries of NIO vehicles reached 327,255 as of April 30, 2023
SHANGHAI, China, May 01, 2023 (GLOBE NEWSWIRE via COMTEX) -- SHANGHAI, China, May 01, 2023 (GLOBE NEWSWIRE) -- NIO Inc. (NYSE: NIO; HKEX: 9866; SGX: NIO) ("NIO" or the "Company"), a pioneer and a leading company in the premium smart electric vehicle market, today announced its April 2023 delivery results.
NIO delivered 6,658 vehicles in April 2023, representing an increase of 31.2% year-over-year. The deliveries consisted of 1,713 premium smart electric SUVs, and 4,945 premium smart electric sedans. Cumulative deliveries of NIO vehicles reached 327,255 as of April 30, 2023.
In April 2023, the majority of deliveries were attributable to ET5 and ES7, while NIO has been upgrading its product offerings from NIO Technology 1.0 (NT1.0) to NIO Technology 2.0 (NT2.0).
In late April 2023, NIO started to steadily ramp up the production and delivery of the EC7, a five-seater smart electric flagship coupe SUV from NT2.0.
On April 18, 2023, NIO debuted the All-New ES6, a smart electric all-round SUV, at the Shanghai Auto Show. Derived from NT2.0, the All-New ES6 will bring user experiences beyond expectations in terms of design, performance, comfort, intelligence, safety, and sustainability. NIO expects to officially launch the All-New ES6 and commence deliveries in May 2023.
The All-New ES8, a smart electric flagship SUV based on NT2.0 that was launched at NIO Day 2022, is expected to commence deliveries in June 2023.
At the Shanghai Auto Show, NIO also launched the 2023 ET7, a smart electric flagship sedan based on NT2.0. The 2023 ET7 boasts more than 15 product upgrades, providing users with a more comfortable driving and riding experience, a more refined interior and a more intuitive digital experience. Deliveries of the 2023 ET7 will start in May 2023.
About NIO Inc.
NIO Inc. is a pioneer and a leading company in the premium smart electric vehicle market. Founded in November 2014, NIO's mission is to shape a joyful lifestyle. NIO aims to build a community starting with smart electric vehicles to share joy and grow together with users. NIO designs, develops, jointly manufactures and sells premium smart electric vehicles, driving innovations in next-generation technologies in autonomous driving, digital technologies, electric powertrains and batteries. NIO differentiates itself through its continuous technological breakthroughs and innovations, such as its industry-leading battery swapping technologies, Battery as a Service, or BaaS, as well as its proprietary autonomous driving technologies and Autonomous Driving as a Service, or ADaaS. NIO's product portfolio consists of the ES8, a six-seater smart electric flagship SUV, the ES7 (or the EL7), a mid-large five-seater smart electric SUV, the ES6, a five-seater all-round smart electric SUV, the EC7, a five-seater smart electric flagship coupe SUV, the EC6, a five-seater smart electric coupe SUV, the ET7, a smart electric flagship sedan, and the ET5, a mid-size smart electric sedan.
Nio is considered a trailblazer in the Chinese premium electric vehicle market. The company designs, produces and vendors connected electric vehicles, using smart innovations in autonomous driving, artificial intelligence and connectivity.
The company introduced its first EP9 supercar in 2016. Nio aimed to deliver exceptional speeding up and innovative technology of the electric powertrain.
In 2017 the company launched its first high-volume manufactured EV model, the ES8, which is a seven-seater SUV with the body made completely from aluminum alloy. Later, in 2019, Nio started the first sales of the ES6, a 5-seater electric SUV.
Besides smart vehicles, the company offers additional services, including Power Swap, a battery swapping service, Power Home, a home charging solution, and Power Mobile, offering charging services through special trucks. The company also offers Power Express – an on-demand pick-up and drop-off charging service available 24 hours a day.
Founded in 2014, Nio is headquartered in Shanghai. Nio shares floated on the New York Stock Exchange through an $1.8bn IPO in 2018. Since then the Nio stock quote has been listed and traded on the NYSE.
Since the beginning of 2020, the Chinese electric vehicle manufacturer has positioned itself as a strong competitor for the iconic EV maker Tesla. During roughly 10 months of the year it generated an impressive 600 per cent return for investors.
The price of Nio stock showed an extraordinary performance, driven by an overall optimistic outlook for the electric vehicles industry and subsequent analysts’ price target hikes, which boosted the company’s valuation to $39bn.
Looking closely at the Nio stock price chart we can notice that a serious bull run started in June 2020 as the coronavirus pandemic accelerated a shift towards renewable energy sources.
In times when numerous countries have started favouring electric vehicles as an effective way to decrease the level of pollution, Nio has emerged as a well-grounded business capable of bringing significant profit from the world’s transformation and transition from fossil fuels to alternative sources of energy. This serves as one of the major reasons why the Nio Limited share price has seen a significant upside momentum recently.
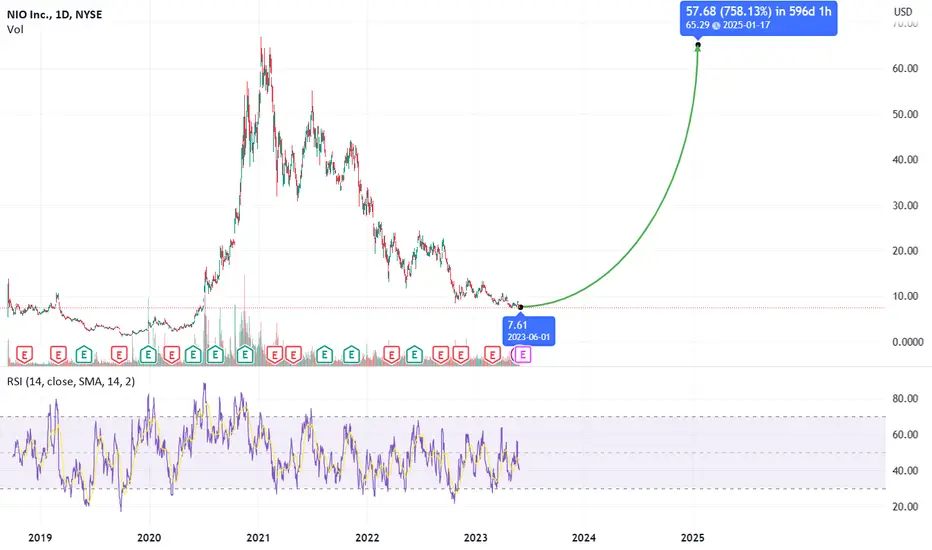
Nio stock has skyrocketed since the end of May. Analysing the Nio stock today, we can say that in a 1-year period the NIO share value has been fluctuating within a range of $1.66 – $54.20. Providing their Nio stock predictions for the next 12 months the majority of Wall Street investors are rating the stock as a buy.
The company shared an ambitious goal to produce a total of 150,000 vehicles in 2021, which is a boost of 28,000 units per quarter. This plan can also contribute to a successful Nio stock rally once achieved.

$NIOProvided we Reclaim and Hold 8.38 ill be looking for $33 as next resistance, longer term (5-10) years im bullish NIO, If 8.38 acts as resistance next area ill be looking at is $5.36 ish
