NKE

Nike: Just Do It! 💪Nike has been a strong player on the capital markets for a long time. Accordingly, we will see the stock price rise further in the future, too! There is little doubt on our side that this stock is staying a long-term Bull – Michael Jordan would be proud! Now, we are primarily expecting the price to continue to rise above $147.93. However, there is a 45% chance that we see a minor dip below $131.23 down until $120.90. Again, we think this stock is going up in the long run, which means that even from the price of $120.90 we will see the price increase after that correction.
Stay sporty, stay trading!

Bearish Ingulfing + Wedge+ Bearish Divergence Bearish Engulfing + Wedge+ Bearish Divergence indicating a deep drop with NKE we just need breaking down the upper trend on weekly chart for the confirmation, it would be nice to hold an option put position

Wedge on NikeA wedge pattern was formed on the 1 hour timeframe. If the price manages to break through the support level of 85.97-87.32$, I expect a further fall.

NKE Bouncing Support Towards ATHRetesting previous all time highs and bouncing from the current support levels, NKE is well on it's way to new all time highs next week.

NKE - Good swing ER runNKE - Respecting trend line and about to reach all time high, Elliot wave 3 target 150, with ER on Dec 18 expecting this to reach this target and always watch out if any trend line break for bearish too, stop loss if dropped below 130-125
Looking to enter - 12/18 - 145c - 0.9
Note : Please do make your own analysis before entering the trade
- NV

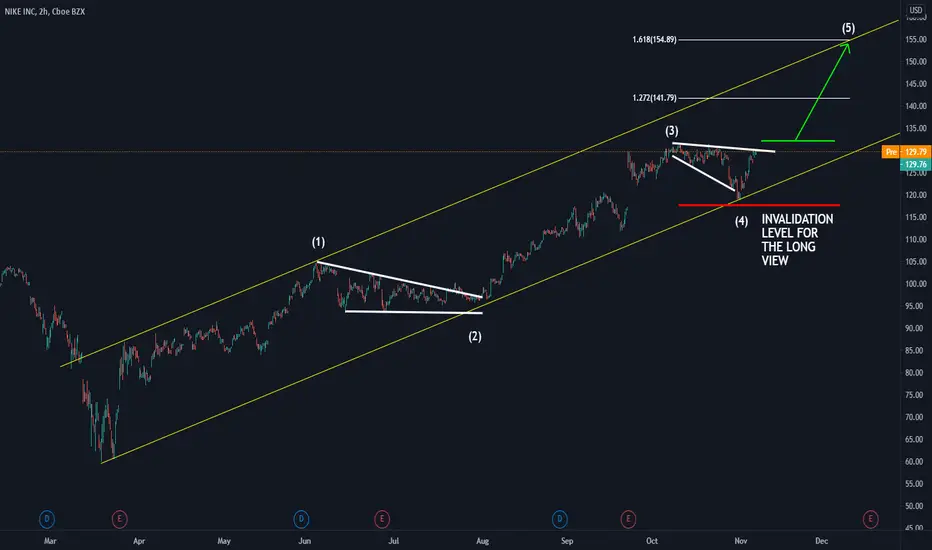
NIKE inside an ascending channel. Potential for another waveToday we will share an analysis of NKE. This can be used as a curiosity or to create a setup with an appropriate Risk Reward Ratio towards the Target.
Main items we can see on the chart:
a) The price is inside an ascending channel providing a bullish context
b) Currently, we can see a clear corrective structure with similar proportions as the previous one
c) Using Elliott Wave theory we can make a count 1234, and we expect 5 to come (Remember that Elliott defined that 5 waves will compose any impulsive movement)
d) We expect a bullish movement towards the higher zone of the ascending channel
e) Also, we have an invalidation level in case the price does not go in the expected direction
f) Remember: Trade safe, protect your capital, and always understand what you are doing!
NKE to break higher on technicals and earningsNike had a good earnings report this past quarter beating over 100% of the analysts' expectations on some strong volume too. We can see the potential of the break of the top on these higher lows as well.
The current resistance is at $130-$131 where we have see the level get tested time and time again on strong bullish momentum and candles, meaning whoever is stopping form price moving through that level has a lot of stops hidden above. That buy stop run could open up price aggressively to the first target at $145.00 or so.
There is the possibility we pullback to close the gap or into the $123 support too before rocketing higher. The higher probability move is the breakout though. With the potential Santa Claus rally coming through and the elections resolving some of the uncertainty in the market, it would see that retail especially online retail may get a nice push this year due to quarantine as well.
This idea is for educational purposes only, should not be taken as investment advice or trading advice.

Poppin' Tags in $XRT?Multiple retail names posting blowout numbers. Budget retail like FIVE, NKE, HBI, and URBN could also still see upside momentum. Notice the rejection off the 2018 highs. Selling bullish verticals in case it's a slow grind

NKE/Nike has BUY positionAs you can see after breaking those purple areas, Its a good entry point, but price might have some struggles after reaching the second purple cluster. So after breaking it, it would be another good entry point.


NKE Starting to fall below Moving AVGOn the 4 hour chart, NKE is just about to dip below the moving average. This relative strength index shows that it is sitting high near 70. We should be expecting to see a sell signal relatively soon.
Disclaimer: I am not an expert, I am just starting to grasp meaning behind these indicators and by no means making recommendations. I trade at my own risk and so should you.

SLIGHTLY BULLISH ON NKEHi community!
Here I´m shearing my thoughts on NKE.
Looking for a bounce from the retest of upper side of this ascending channel.
Selling some premium with the put spread near the actual price and the call spread far away just working as a buffer in case needed.


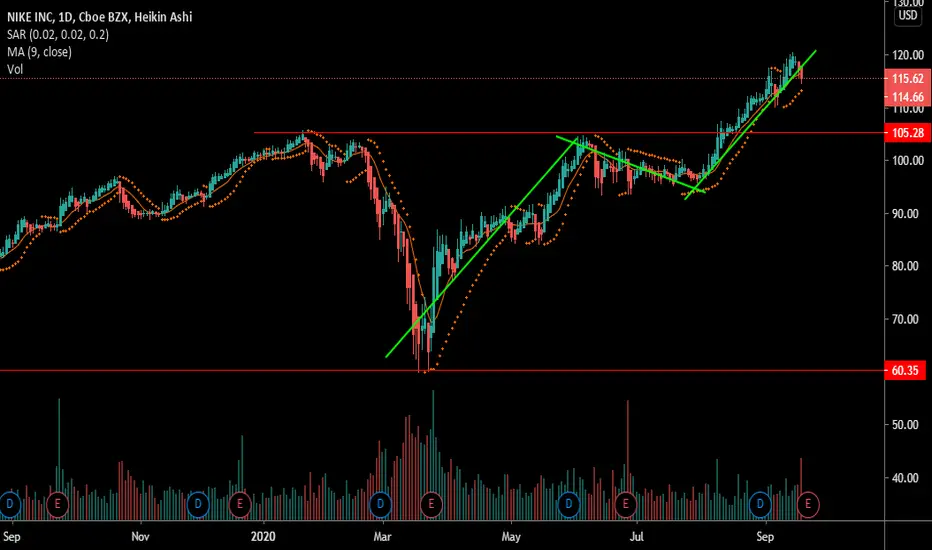
Nike Climbs While The Rest Of The Market Dips.Nike has been off the radar for some time, especially since it started consolidating from December
2015 to May 2018. The trend following its breakout of consolidation has lacked the energy and
momentum of the prior trend when Nike shares saw a growth of 612% from March 2009 to December 2015.
The trend experienced its first pullback and made contact with the resistance turned support at $68
in December 2018 before slowly rising again.
Then due to the recent global pandemic, Nike shares plummeted towards the support at $68 once again.
We then saw a sharp increase in price, seeing a rise back above the 200 simple moving average and since
then we have seen a linear trend in play.
The market as a whole are experiencing pullbacks and Nike looks set to end the week pulling back itself.
Despite this, Nike is outperforming the rest of the market at the moment.
Nike has the daily 20 simple moving average below it at the moment which may provide support,
then we have the 50 simple moving average as a second option for support.
Nike remains at the top of our watchlist for the simple fact that it has started to trend well and may
continue to do so for some time going forward.
See below for more information on our trading techniques.
As always, keep it simple, keep it Sublime.

NIKE INC. SHORT📈 NYSE:NKE SHORT H4
🛒SELL BELOW = 110.40
🎯Target1 = 106.10
🎯Target2 = 103.40
🎯Target3 = 99
🛑Stop loss or cancel trade = 117.55
🙈Recommended risk = (1%-2%)
#NKE #NKESHORT #NKESELL

Elliott Wave View: Nike (NKE) Breaks to All Time HighNike (NKE) has made another all-time high suggesting the bulls remain in firmly in control. Elliott Wave View of Nike suggests the stock is still within the cycle from March low as an impulse. Currently, the stock is within wave (5) from March low. The rally from March Covid-19 low to $117.42 ended wave (3). Pullback in wave (4) completed at $110.05 as a double three correction. Down from wave (3) at $117.42, wave W ended at $110.21, wave X ended at $113.84, and wave Y of (4) ended at $110.05.
Wave (5) rally is now in progress as an impulse Elliott Wave structure. Up from wave (4) low at $110.05, wave ((i)) ended at $113.26 and wave ((ii)) pullback ended at $112.66. The stock then resumed higher in wave ((iii)) towards $116.21, wave ((iv)) pullback ended at $114.34, and the final wave ((v)) ended at $118.23. This also ended wave 1 of (5) in higher degree. Pullback in wave 2 is proposed complete at $114 as a zigzag. Down from red 1 at $118.23, wave ((a)) ended at $115.43, wave ((b)) ended at $116.91, and wave ((c)) of 2 ended at $114. Near term, Nike still needs to break above wave 1 at $118.23 to avoid a double correction in wave 2. As far as pullback stays above $110.05, expect the stock to find support in 3, 7, or 11 swing for new all-time high.

NKE BUY OR LONG , TARGET UP TO $140NKE confirms the " Cup and Handle " pattern and targets this pattern at $140
NKE BUY : $105
NKE TARGET : $140 +-2
Stop loss : 8%
Wish you a good deal!

Just Do ItNKE breaking north of $100 after long battle. We've been in some 98.5c's a few weeks out targeting a move to $105, with a stretch target of $110.

NIKE : Swing, 100% Price ActionNYSE:NKE : Follow the uptrend. #UniversTrader
Feel free to like❤, comment📝, share👫 and follow me for other analyzes🌍
