NOT


Macon Tech up strong after Zacks Strong Sell - what gives??MTSI has some cool chip technology and beaten up like most tech stocks in US-CH trade war saga.
Zack posts strong sell prior to MTSI have strong upward climb today after missing Q4 Rev. targets. Acquisition candidate>>>? What gives??
Zacks Investment Research, Inc. downgrades MACOM TECHNOLOGY SOLUTIONS HOLDINGS INC from HOLD to STRONG SELL.
BY Investars Analyst Actions - private
— 2:10 AM ET 11/14/2018
On November 14, 2018 Zacks Investment Research, Inc. downgraded MACOM TECHNOLOGY SOLUTIONS HOLDINGS INC ( MTSI ) from HOLD to STRONG SELL.


Becoming excellent vol.1I want to write today about excellence in life. You can apply these principles to trading, although I am not here to talk about trading specifically - much.
As you may know, I've entered this market at around this price point twice, both times I was stopped out with minimal loss. So far, I haven't been entirely wrong about the market, but I haven't made money. Okay. I'm glad I am wrong PUBLICLY because it forces me to up my game - it reminds me that this is more about my personal financial growth. I am trying to help people learn trading and generally good financial practices because it is not something you are ever taught in school and is very important. I can help people best by also BECOMING the best. I am not the best, or even remotely intelligent with my practices, but I would like to be and I believe I will get there (maybe with some competition - but I will give them hell). Below are ramblings about how/why I think I will get there. I will show you three things that should help you and explain to you how to solve problems - any and all. What you do with this information is unbounded and up to you.
This post isn't about becoming financially successful (directly) or my goals (who cares). I want to talk to you about excellence and the patterns I see in those who are excellent. People are excellent, and that's a broad statement so let me define it, when: they not only have VAST amounts of knowledge, but have also found the best ways to acquire knowledge. As you get better at something, you begin to understand more clearly what you need to do to get to where you need to go. You can only solve problems once you are aware of questions. You can only answer questions if you OBSERVE phenomena. Traditionally, people pair the duet of questions and answers and think this is how humans acquire knowledge. It's not. There is a precursor to the question: the observation. You can only question something once you observe it in some way, not axiomatically by sight, but there must be some sensory interaction with the thing to be questioned. This sounds obvious and I'm sure you are sitting there thinking I am a dumb shit (I am) but I haven't made the life changing posit, it is: most people do not observe reality AT ALL EVER, the few who do do it narrowly; to observe reality AT ALL is profound. The people who actually can observe reality often change the world. Isaac Newton could observe reality. I don't know that he observed reality at all times, and I doubt it - so he likely did it narrowly and even doing it narrowly was profound.
Let's talk about what I have observed to be very effective for the people that are excellent. I have an acquaintance who I am convinced will become a billionaire if he wants to - he can do anything he sets his mind to (I have decided I am going to make sure he follows through on everything he sets his mind to). He has started a hedge fund and I know it will be a big success. When I first came to his house and was alone with him, one of the first things I noticed was that he writes down what he must do for the day. He creates various tasks for himself that vary in complexity and therefore time and so he tries to maximize his production curve by always keeping on top of what needs to be done. He is not perfect in his implementation, but people who are excellent don't have to be, and no one ever will be - but he strives for excellence and it follows. This is the element of thinking ALGORITHMICALLY to excellence. You come up with a recipe to solve your goals and you follow it. Write everything out you need to do, try to get into a constant routine (we are machines), and follow through. I think he just uses a yellow legal pad for this.
So, the first step is about creating a plan and following it, but let's expand on following it. My brother is a professional pianist, but he is not a concert pianist. He did, however, go to school with a concert pianist: Kenneth Broberg. What he observed from Kenneth was that he would keep track of exactly how much time he was at the piano. I don't remember how much time he played for a day, but we will go ahead and call it eight hours, because that sounds about right to me. If someone interrupted Kenneth, he would stop a timer he kept. He made sure the eight hours was continuous and focused. He was incredibly methodical in his execution and he was serious. Kenneth is an EXCELLENT pianist. This displays the application of the first principle, but also displays another: dedicated work. If you are going to be excellent you are going to have to work quite hard for many hours a day, probably every day, and for a long while. This is why most people can't be excellent. If you are going to be excellent at something you are going to need to continuously dedicate yourself to becoming so.
These will get you to the level of excellence, but there is something missing, right? What's missing, well, we have OBSERVED these people and see their actions lead to a certain path. We can now QUESTION. The ANSWER, I do not have for you - it varies for everyone. I have an ability to help people reach their potential by KILLING the parts of them which do not serve them and by helping them grow the parts that will. I cannot give someone a reason as to why they are doing something or should evolve or even want to evolve. I create my own path and everyone MUST create their own path (you must self actualize). I can't tell you your individual answer, but I can tell you how I have found my own answers and how people like Steve Jobs have found their own: deep self-reflection and meditation. I do not wish to write much further and I'm sure the tl;dr threshold was crossed after the first paragraph and so that seems logical. As well, most people aren't moved by the spiritual because it has been perverted by salesmen. If you don't have a why in your life, do yourself a favor and OBSERVE yourself and then question yourself. Observe how you are behaviorally in a comprehensive way. Why is this the case? Observe what you are good at. Why are you good? Observe what you are bad at. Why are you bad? Observe what you can change. Why can you change this? Observe what can you not change. Why can you not change this? Observe how you feel about not being able to change things. Why do you feel this way? Observe how you feel about your own death. Why do you feel this way? etc. Lastly, I meditate by either thinking of nothing at all (try focusing on white noise like a fan or something in the beginning is helpful - it's hard to train your mind how NOT to think) or by focusing on breathing (I just say "in" and "out" over and over). I meditate for an hour a day and have been for quite some time. By doing this, you will at the VERY LEAST acquire an intense focus and clear headedness that will make you feel secure and serene. At the very best, you will find everything you NEED to know about yourself and the world you live in. They call that stage of your journey enlightenment. I've read you will know you are at that level when you get there.
Good luck, I hope you discover that what is written here is true. Understand what I mean by observ ing reality.
-YoungShkreli

GE General Electric Speculative Buyondip with Stops below 12.50GE General Electric Not Dead Yet
It's been a long time since the last update on GE - it's not been warranted either by the look of it.
It's still unloved and untrusted.
Depending on profile, this looks like one to accumulate at the these levels. After spending months
in a relentless down-trend that began with the break below 30 (several months before any bad
news hit the St) and which looks to be drawing, slowly, to an end, this looks like one to accumulate
at the these levels and on dips back to 12.60.
Downside is showing a loss of momentum and it's now moving away from the heavy parallel which
has killed all rally attempts in the past few months.It's now using it as support on this current move lower.
It may be unloved still, but this old girl still has a certain beauty.
Look to buy around current levels down to 12.60 with stops below 12.60 by 10 pips or so.
First target at 17.35, then 19.35. It will require a degree of patience, though ; )

BTCUSD: Bitcoin - Clear and Still Present Danger BTCUSD Bitcoin
Must apologise for rubbish call yesterday and no follow up.
Was expecting a period of light relief over the weekend. No
such luck. The spike that came shortly after the match had
finished was a big one and the ensuing rejection period
flipped Bitcoin straight back down to the lows again and
triggered a short from 7399 as it broke below here.
If still short here can either close out again for 90 or so profit
but ready to short again on a break below 7200 - it may only
reach 7162 at first and try to rally back to 7200 but once this
is broken below it should decline in stages back to 6615-6517
range.
But in the nearer term Bitcoin is trying to rally again - it's still
thin and treacherous and still cannot trust this counter-rally
even though it can push higher again from here.
There's a good spike off the lows today so it looks like another
continuation pattern is forming now. But there is no upside
here worth contemplating so far except for brave day traders
who may wish to follow a break above 7350 on Bitfinex
looking for 7467 and maybe 7540 at likely best before it
comes off again.
Otherwise we have to wait - again - for that probable break
lower, when and if it eventually arrives.
Patience. A virtue. This is the lesson of 2108.
2017's watchword was HODL. 2018's is PATIENCE.
We have to learn it and adapt to change.
Not what anyone really wants to hear. But it's true nonetheless

BTCUSD, 5th Wave not completed yet!My EW count seems to differ of opinion and that the cycle is not completed. Wave 3 must extend to at least 1.618 which only the last low had done. In addition we need divergence between wave 3 and 5. There is none, there will only be once the new low had been completed. What is happening here right now is that we are going to make a flag for the final push down or just a deeper up correction (fake out) to complete the 4th wave before the final push down.
For the 5th wave to be valid it must break the low of the 4th and some therefore $5k area is still on the cards, this cycle is not completed so dont get too excited yet, only once we break the last last can we even consider the cycle completed.

Historical Data Experimentplease note: this is not a complete trading idea. This analysis is entirely based off historical data.
Many of us know that Bitcoin has seen several major correction throughout its lifespan. The last major correction took place back in late 2013, which resulted in a 90% correction from the top.
The chart above shows the percentages and ratios I collected from the 2013 crash that were then overlaid onto the recent Bitcoin chart.
Creating the possible route Bitcoin could take IF it follows the 2013 path.
The percentages & time frames that were collected are shown in grey. The red and green colors shows what I expect to happen based on the data.
The chart below shows the percentages collected for this experiment.
DISCLAIMER:
Please note I am only providing my own trading information for your benefit and insight to my trading techniques, you should do your own due diligence and not take this information as a trade signal.

Cryptocurrencies are not deadCryptocurrencies are not dead
This is not financial advice. Do your own research or ask professionals prior to invest.

DXY: Dollar Index Update - Not done yetDollar Index DXY
The dollar remains under medium term pressure and evntually
it should fall away in stages through the blue lines of near
term support potential to 88.31, and likely touching the
longer term trend line at the extremity of the fall before
bouncing away strongly again.
In the very near term DXY is making a little continuation
pattern below the low of the last decline at 90.97-91.01 and
flipping in a 1% range bounded by 91 on the upside and by
90.17 on the downside. As it does so, gold and Eur dance to
its tune.
Even if it can manage to move up above 91.01 it is likely only
to rally towards the upper parallel at best, touch it, and
recoil back lower once more. To escape the year-long down-
trend DXY has to break that upper parallel and hold on the
retest. Only then will the Dollar's trend turn back to positive
and we switch from selling rallies to buying dips once more.

BCHUSD Athough on support this is not over yetBCHUSD
Another spawn from the Bitcoin stable that has behaved technically perfectly - could be fresh from the latest chart
book showing what a 'stock' can do under perfect conditions - but this time looking at downsides, not upsides...
It's fallen below it's dynamic support line and then come back up to retest it from the underside....and repeatedly
failed...that's the big clue that this is headed south from here - can be shorted now with stops above the line, yes? It's
exactly the opposite of what a 'good' breakout to updside will look like. And in doing so it has fallen in 4 sections/waves to
the low, searching for support from the beginning of this structure to left of chart, finding it on the lows of that
structure and rallying there.
But this decline is not done yet until Bitcoin itself makes a clear bottom. Near term support at 2322 must hold up here
to avoid another test of 2248 at least, if not to 2209. Any failure to hold this latter level during the course of this week
will tip BCH back into serious bear territory again and will likely force price much lower still, to 1840 at least, if not to
1766 where we can look to get long again if struck.
But it's holding for now above 2322 so is neutral to mildly positive...but once 2320 gives way it flips back to negative
again and we look to pick it up from lower levels from there.

IOTA IOTUSD No interest in buying this rally yetIOTA IOTUSD
Iota is testing important support at 3.229 with a low at 3.20.
this latter level must continue to hold (and will do so long as
Bitcoin holds up, which will not be for much longer now, it's
just completing its own counter-rally now). Any failure to hold
3.20 will force Iota lower still to 3.03 and then should this
level fail to 2.73 at least if not back to 2.47.
Even though it's on support and rallying now, have no interest
in buying here until Bitcoin makes a clear bottom. We can
pick it up cheaper still urther down the line.

Litecoin: LTCUSD Update and stops for remaining longsLitecoin: LTC
Longs should have been out as the dynamic support failed at
around the 276 level - see how often there will then be a
challenge of the same support from the underside, which
works for an hour or so before it falls away...not always, but
maybe 50% of breaks are like this and the other half are
clean, hard and fast.
Last comment suggested looking to buy again at 245 with
stops below 238 - well it wasn't very helpful, with a spike low
at 235 so some will have been carried out with the rest of
them...if you set your stop under 234, well done. But LTC
must continue to hold up here at lowest - and that depends
on Bitcoin holding up too, which is unlikely looking at that
chart in isolation...so if still long here be careful. Any break
below 234 by more than 5 points is unlikely to be a fake-
out...it will then likely fall to 219-210 minimum and more
probably to 188-172 range where we can look to pick up some
more.

No idea what I'm doingHere's my idea, and I bet you it won't come true, but I'm new here and want to chat.

Bitcoin: BTCUST Still not over yetBitcoin Last shot
Well that long didn't do too well - stopped out for about 200 profit unless you were smart and trailed a tight stop under it -
500 points profit lost by bad stop management. If it was going to halt the last high was a pretty obvious place - too busy
updating other calls. Just plain dumb. Late. 16 hours playing with Bitcoin. Last shot for tonight...
Despite the set-back Bitcoin is struggling on, now carving out a new set of parallels which have a corrective feel about
them. It's still a buy off the lower parallel with stops quite tight, trailing underneath it and it will be a sell off the upper
parallel later if touched at around 15600 in maybe 3 hours' time if the lower parallel continues to hold.
It really should then fall away, potentially quite hard most likely back to 12094 and if this fails back to the lows. If this
price action develops and it heads south hard and fast rather than more haltingly, then watch how it behaves at the
lows...it should start to fight and flip around there to show it's got a chance of holding and getting long with stops within 50
points of the low...if it doesn't fight here it means we need to be prepared in advance psychologically to deal with the initial
shock. We'd be looking at a full-fledged rout of every last bull left in town - driving price back as low as 8324 and maybe as
low as 7843 at the extreme. This is not over yet until that upper parallel is breached and held on the retest by the bulls
again. That would be a major surprise too. But it is Bitcoin guys. We know it's capable of pretty much anything. And so it
needs covering. To turn from bearish back to bullish Bitcoin has to cross that upper parallel, hold on the retest and then
break above 15814 and hold. If and only if it can manage that will the next long get triggered back to 17908 to start with and
likely back to highs thereafter.
And if Bitcoin loses the smaller parallels that are now holding it up before it reaches the upper parallel it means
another test of the lows is likely underway but a little earlier than currently anticipated.
Longer Term clean chart to follow

Bitcoin; BTCUSD Head and Shoulders Top Now !BITCOIN: BTCUSD This thing moves like lightning.
Shifting shapes: Head and Shoulder Top
Still don't think this has finished its rinse out yet.
Evenn more worrying, after dealing with the failed reverse
HandS this morning there looks like there's a massive head and
shoulders TOP formation appearing on the chart...stay away
for now unless short...it's still ina weak technicalposition
whilst anable to get back above resistance (old support) at
7080 right through to 7135 (more old support) and whilst
below here that Head and shoulders will grow in importance
and power...and an implied downside target at 6563.
Stay away from the cookie jar until we see the dust settle.

Crazy idea about Bitcoinsometimes I like making crazy idea that people do not think easily.
It looks so funny, but i'm open-minded at anytime.
Have fun :)

10 days in row Trend day special $NQ_F Same as it ever was, quarter/month end in to month/quarter start, don't overthink the obvious until it breaks buy every open, sell every close! CME_MINI:NQ1!

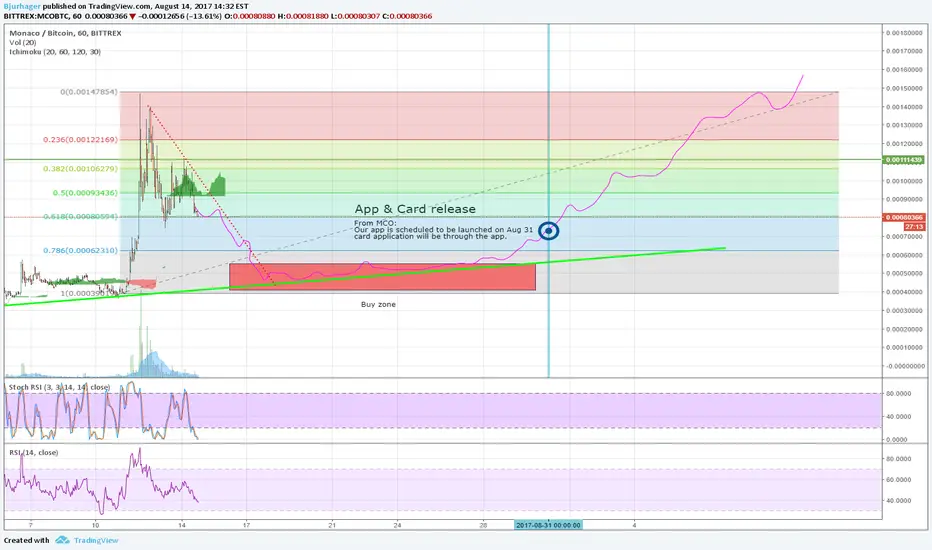
MCO Crazy idéaSo... yeah, This is what i'm hoping for.
BTC Going like crazy and don't look to stop in the next hours wich means money goes from other coins to be on the BTC train.
As MCO following the downtrend i belieive we are going down to the support trend ( green ) and will slow down from there.
The Monaco card & app will be released on 31 aug accoring to Monaco support and people will look for the lowest entry before that date. So i think we will follow that trend and start to push from it close to aug 31.
If the release is a success we are going a long way up. If not, god knows :)
If you don't know what MCO is you can visit their site:
mona.co
Please share your idéas in comments.

BITCOIN: BTCUSD 3080 Next?BITCOIN: BTCUSD Wow. Bitcoin has moved into yet another higher gear - where next? If you're riding this tiger you could use a break of the most acute trend line as an early exit signal -
