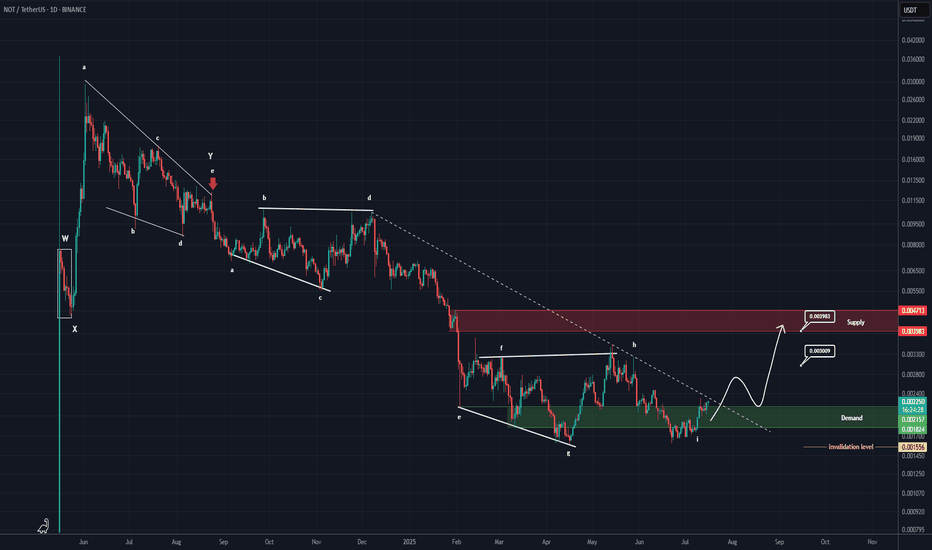
NOTCOIN New Update (1D)From the point where the red arrow is placed on the chart, the correction labeled as NOT has started.
The correction appears to be a symmetrical one, which now seems to be coming to an end. The current upward wave could be the X wave.
In previous analyses, we had also considered the structure to be symmetrical, but on a larger degree. However, based on the data currently available, it seems that the degree of this symmetrical structure is smaller.
If the price holds above the green zone, it may move toward the targets and the red box. The targets are marked on the chart.
A daily candle closing below the invalidation level will invalidate this analysis.
For risk management, please don't forget stop loss and capital management
When we reach the first target, save some profit and then change the stop to entry
Comment if you have any questions
Thank You
Notcoinanalysis
NOTcoin: Where can we buy it? I wrote to you...Hello friends🙌
🔊Considering the price drop we had, you can see that the price has finally found support, but our channel has been broken, and the indicated supports are good points for buying in steps and with capital and risk management...📈
🔥Join us for more signals🔥
*Trade safely with us*
Should we buy Natcoin now or wait?Hello friends
According to the complete analysis we have done for you, we have concluded that the price has reached an important support with a deep correction that buyers were able to support the price to some extent, and if the support is broken, there is another important support that we have determined that the price can be expected to grow from there.
Our suggestion is to buy steps at important supports, of course with capital and risk management...
Targets have also been specified.
*Trade safely with us*
NOTCOIN : IT'S TIME TO BUY GUYSHello dears
If you are risk-averse, this analysis is for you...
According to the bullish pattern that has formed, you can see that we had a decline and now it is time to take a logical risk, that is, we buy at the specified levels with capital management to move towards the specified goals...
*Trade safely with us*
NOT Coin: Poised for a Breakout? Key Resistance Level in FocusGreetings, fellow traders.
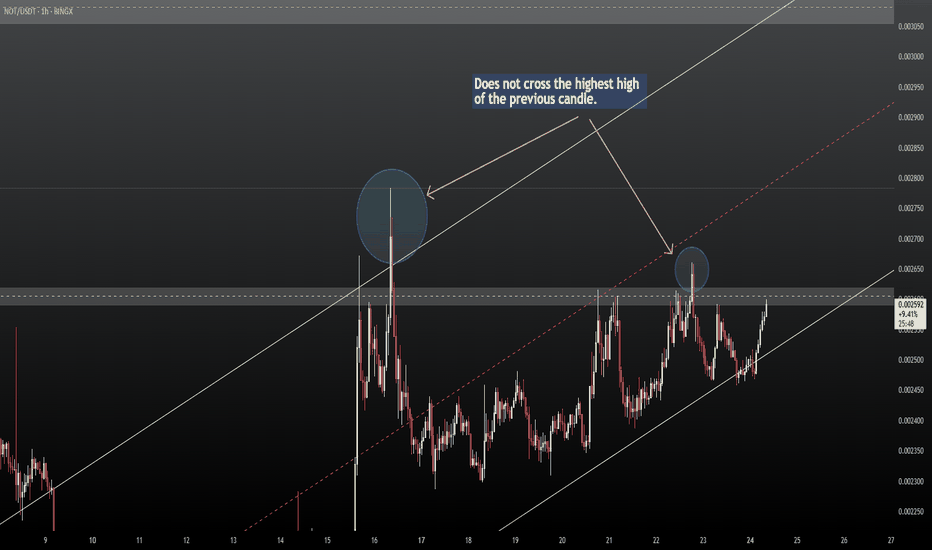
While many cryptocurrencies are experiencing upward momentum or consolidating in preparation for potential rallies, Notcoin (NOT) has recently surged 4-5%, reaching a critical daily resistance zone.
Breakout Potential:
This resistance level has proven significant, with NOT having tested and failed to break through it twice this week. A successful breakout above this zone could unlock substantial upside potential.
Long Trade Setup (Conditional):
Entry Trigger: A confirmed close of a 1-hour or 2-hour candle above the current daily resistance is required. Then, initiate a long position when the price of the subsequent candle surpasses the high of the confirming (breakout) candle. This two-step confirmation helps mitigate the risk of a false breakout.
Target 1: $0.003000 - $0.003100
Target 2: $0.003700 - $0.003800
Risk Management:
This is a higher-risk, breakout-based setup. Implement appropriate risk management, including a defined stop-loss strategy, to protect capital in case of a failed breakout.
Disclaimer: This analysis is for informational purposes only and does not constitute financial advice. Conduct thorough due diligence and risk assessment before making any trading decisions.
The possibility of NOT currency growth📊 We said #Notcoin would bounce back two nights ago at the peak of its decline, when it had fallen 17% from its peak, and we are witnessing its comeback. It has shown a 9% growth from exactly where we said it would.
❓ But what will happen?❓
🕯 If #NotCoin can close its price above the 0.006126 range on the daily time frame, we can hope for growth, in which case this growth could continue by 6% to the price of 0.006652.
🔼 The important support for this currency is still at the aforementioned price level of 0.005555 on the daily timeframe.
NOTUSDT AnalysisHey traders!
Taking a look at NOTUSDT, we can see it's currently trading within a mini ascending channel.
Bullish Scenario:
If we see an increase in buying pressure and volume, along with a break above the $0.007050 resistance level, we could see NOTUSDT continue its upward momentum towards the $0.007500 resistance. A confirmed break above $0.007500 could potentially open the doors for further gains, targeting the $0.007800 level and extending the uptrend within a broader macro ascending channel.
Key Resistance Levels:
$0.007050
$0.007500
$0.007800
Bearish Scenario:
On the flip side, if the price breaks down below the ascending channel's support and confirms a close below it, we could see a significant pullback. The $0.006700 and $0.006500 levels would be the initial support zones to watch. However, a further decline could lead the price towards the historical support zone between $0.005500 and $0.005600.
Remember:
This is just my personal analysis, and it's crucial to conduct your own research and consider your risk tolerance before making any trading decisions.
Keep an eye on trading volume and price action for confirmation of any potential breakouts or breakdowns.
Consider setting stop-loss orders to manage your risk effectively.
Let me know if you have any questions or thoughts!
Happy trading!
NotCoin"🌟 Welcome to Golden Candle! 🌟
We're a team of 📈 passionate traders 📉 who love sharing our 🔍 technical analysis insights 🔎 with the TradingView community. 🌎
Our goal is to provide 💡 valuable perspectives 💡 on market trends and patterns, but 🚫 please note that our analyses are not intended as buy or sell recommendations. 🚫
Instead, they reflect our own 💭 personal attitudes and thoughts. 💭
Follow along and 📚 learn 📚 from our analyses! 📊💡"
150% Profit📊Setting a trading signal based on price levels involves identifying key thresholds that can trigger buy or sell actions. Here’s how you can set signals for the NOTUSD asset based on the provided price levels:
✅Buy Signal:
Entry Point: Consider buying when the price is around 0.0066. This level seems to be a lower support point, offering a potential entry for a bullish move.
Confirmation: Wait for additional confirmation, such as a price rebound or positive volume increase, to ensure the support holds.
🟢Take Profit Signal:
First Target: Set the first take-profit level at 0.0087. This represents a significant price increase from the entry point.
🟢Second Target: The next take-profit level could be at 0.01689, which aligns with the higher price range mentioned.
🔴Stop Loss Signal:
Risk Management: Place a stop-loss order slightly below the entry point, around 0.0054, to minimize potential losses if the price moves against your position.
Sell Signal:
Exit Point: If the price reaches 0.000505 and shows signs of reversal or resistance, consider selling to lock in profits.
Re-Entry Signal:
Pullback Opportunity: If the price retraces to 0.000460 after a peak, it might offer a re-entry point for another potential upward move.
By setting these price-based signals, you can systematically approach trading the NOTUSD asset, balancing potential profits with risk management. Always monitor market conditions and adjust your strategy as needed. 🚀
#NOT/USDT#NOT
The price is moving in a descending channel on the 1-hour frame and is expected to continue upwards
We have a trend to stabilize above the moving average 100 again
We have a descending trend on the RSI indicator that supports the rise by breaking it upwards
We have a support area at the lower limit of the channel at a price of 0.006226
Entry price 0.006567
First target 0.006765
Second target 0.006949
Third target 0.007180
notcoin update"🌟 Welcome to Golden Candle! 🌟
We're a team of 📈 passionate traders 📉 who love sharing our 🔍 technical analysis insights 🔎 with the TradingView community. 🌎
Our goal is to provide 💡 valuable perspectives 💡 on market trends and patterns, but 🚫 please note that our analyses are not intended as buy or sell recommendations. 🚫
Instead, they reflect our own 💭 personal attitudes and thoughts. 💭
Follow along and 📚 learn 📚 from our analyses! 📊💡"
Notcoin update ! "🌟 Welcome to Golden Candle! 🌟
We're a team of 📈 passionate traders 📉 who love sharing our 🔍 technical analysis insights 🔎 with the TradingView community. 🌎
Our goal is to provide 💡 valuable perspectives 💡 on market trends and patterns, but 🚫 please note that our analyses are not intended as buy or sell recommendations. 🚫
Instead, they reflect our own 💭 personal attitudes and thoughts. 💭
Follow along and 📚 learn 📚 from our analyses! 📊💡"
notcoin idea"🌟 Welcome to Golden Candle! 🌟
We're a team of 📈 passionate traders 📉 who love sharing our 🔍 technical analysis insights 🔎 with the TradingView community. 🌎
Our goal is to provide 💡 valuable perspectives 💡 on market trends and patterns, but 🚫 please note that our analyses are not intended as buy or sell recommendations. 🚫
Instead, they reflect our own 💭 personal attitudes and thoughts. 💭
Follow along and 📚 learn 📚 from our analyses! 📊💡"
Notcoin (NOT) rally targets new ATHOver the past 24 hours, Notcoin (NOT) has increased by 4.85% and is currently trading at $0.0088.
With the recovery rally in action, Toncoin and its high-ranking performer, Notcoin, are likely to make a bullish comeback.
With a market cap of $905.97 million, the 24-hour trading volume of Notcoin stands at $938 million. This results in a volume-to-market cap ratio of 102.81%, reflecting massive liquidity in the market.
In the daily chart, the Notcoin price action shows a falling-wedge breakout rally, gaining momentum. The pattern breakout rally has surpassed the 23.60% Fibonacci level at $0.0077 with a post-test reversal.
The reversal rally peaked at the $0.010 psychological mark but failed to sustain the rally. Over the past 24 hours, the altcoin has increased by 30% to create two consecutive bullish candles.
However, the intraday pullback of 6% reveals the massive overhead supply, followed by overnight rejection at the psychological mark. The bulls struggle to surpass the 38.20% Fibonacci level and the $0.0010 supply zone.
Based upon price analysis, the $0.10 breakout rally must sustain dominance above the 50% Fibonacci level at $0.001. This will increase the credibility of a bullish run ahead.
NOT biggest change?Is this really the pattern we all have been waiting for? BTC hitting ath like water, will NOT go to 0.17 after a long time?
It has broke through the falling wedge, currently i am waiting for a retest on the 1hr gap. I think this will be one of my most beautiful trades i have seen.
NO FA
ALWAYS DYOR
NOTHING !!NOTCOIN is forming a falling wedge on Daily timeframe , Up we go if we do breakout. the price can be bullish and I expect the price to go up to the Fibonacci line of 0.618 = 0.0012 Stay tuned for more updates, thanks.
✨We spend hours finding potential opportunities and writing useful ideas, we would be happy if you support us.
Best regards CobraVanguard .💚
_ _ _ _ __ _ _ _ _ _ _ _ _ _ _ _ _ _ _ _ _ _ _ _ _ _ _ _ _ _ _ _
✅Thank you, and for more ideas, hit ❤️Like❤️ and 🌟Follow🌟!
⚠️Things can change...
The markets are always changing and even with all these signals, the market changes tend to be strong and fast!!


