SPY/QQQ Plan Your Trade For 6-24 : Post Market UpdateThis post-market update highlights the weakening volume while my primary proprietary modeling system continues to stay BULLISH.
The markets are really quite interesting right now. Weakening volume in this Gapping uptrend, today, suggests traders are not buying into the ceasefire between Iran and Israel.
Additionally, the move in metals suggests a PANIC phase has setup in the US markets.
This type of panic phase typically leads to selling of assets and moving capital into CASH.
I suggest traders continue to prepare for a moderate melt upward trend over the next few days - but be prepared for any potential breakdown (possibly trying to FILL THE GAP).
This market appears to be running on fumes.
While I believe Trump's policies will lead to a stronger bullish price trend over the next few years, these disruptions and the potential for consumers to pull away from spending/economic activity over the second half of 2025 is still very real.
Buckle up.
At this point, hedge your trades, move some capital into CASH and prepare for bigger price volatility as we move into July 2025.
Get some.
#trading #research #investing #tradingalgos #tradingsignals #cycles #fibonacci #elliotwave #modelingsystems #stocks #bitcoin #btcusd #cryptos #spy #gold #nq #investing #trading #spytrading #spymarket #tradingmarket #stockmarket #silver
Nq!

SPY/QQQ Plan Your Trade For 6-23 : Afternoon UpdateWhat happened to the CRUSH pattern?
Everyone wants to know why the CRUSH pattern didn't show up today. Well, I keep telling all of you these SPY Cycle Patterns are based on GANN, Tesla and Fibonacci price structures. They do not take into consideration news, global events, or anything outside of PRICE.
They are predictive - meaning they attempt to predict potential price shapes/patterns weeks, months, and years in advance.
The markets, obviously, are seeking some normalcy after the Iran conflict. I thought the CRUSH pattern would have been a perfect fit for today - but obviously the markets didn't agree.
If you have been following my videos, you know I keep saying the US stock market is acting as a global hedge for risks. Traders are pouring capital into the US stock market as a way to avoid global risk factors.
Traders are also pouring capital into Gold/Silver. Demand for physical metals is through the roof right now.
Time will tell if my Excess Phase Peak pattern plays out as I expect or if we rally to new ATHs.
Obviously, this sideways rollover topping pattern could present a breakaway in either direction.
Again, my patterns are not correlated based on news or other events. They are strictly price-based.
Get some...
#trading #research #investing #tradingalgos #tradingsignals #cycles #fibonacci #elliotwave #modelingsystems #stocks #bitcoin #btcusd #cryptos #spy #gold #nq #investing #trading #spytrading #spymarket #tradingmarket #stockmarket #silver

Futures Watchlist for week ending 6/27/2025Come join as i go through the future tickers that im watching this week and where i see them going. With war talks filling up on social media this will add to our volatility and we will look at key levels to capitalize off of it! Let me know your thoughts on these tickers. Also let me know if there is another symbol futures or stocks that you want me to breakdown for you!

SPY/QQQ Plan Your Trade For 6-23 : CRUSH PatternToday's CRUSH pattern suggests the markets will struggle to find any support for a rally. A CRUSH pattern is usually a large breakdown type of price bar that moves aggressively against the dominant trend.
Som, today I'm expecting some fairly large price action and I believe the markets may start a breakdown move this week as we continue to get more news related to the Israel/Iran/US conflict.
This week will be a "resettling" week in my opinion. Buyers will start to actively liquidate and reposition assets as we move deeper into this conflict. When buyers turn into sellers (to get out), the markets usually react very aggressively in trend.
Metals continue to hold up without making any big moves. I believe the increased FEAR level could play out as a moderate rally for metals over the next 15-30+ days.
BTCUSD broke down very hard (more than 6%) over the past 3-4+ days. This is a big move downward for Bitcoin and could suggest US technology stocks/sectors could also collapse on fear of a "rollover top" in the US stock market.
Smart traders will hedge and pull capital away from this potential top - just like I've been suggesting for the past 2-3+ weeks.
Oddly enough, if we do get a rollover/top this week because of the Iran conflict, it plays right into my Excess Phase Peak pattern and the predictions I've been making over the past 4+ months.
No, I don't foresee events like this Israel/US/Iran conflict. I can't see into the future.
What I can do, and continue to try to deliver, is the best analysis I can offer without becoming BIASED by indicators, comments, or other inputs.
I just read the chart and will tell you what I see as the most likely outcome.
Get some..
#trading #research #investing #tradingalgos #tradingsignals #cycles #fibonacci #elliotwave #modelingsystems #stocks #bitcoin #btcusd #cryptos #spy #gold #nq #investing #trading #spytrading #spymarket #tradingmarket #stockmarket #silver

A Trend on Borrowed Time, A Micro ED within a Larger ED?Since mid-last month, the broader equity market has been grinding higher — but not with confidence.
The advance has been marked by choppy, overlapping price action that feels more hesitant than bullish. Yes, prices continue carving out higher highs and higher lows, but MACD momentum tells a different story. With every push upward, the MACD weakens, flashing warning signs beneath the surface. Taken through the lens of Elliott Wave theory, this unfolding pattern carries all the classic fingerprints of an Ending Diagonal — a structure that often signals a trend on borrowed time.
Key Characteristics of an Ending Diagonal:
1. Position in the Wave Structure:
A. Occurs in Wave 5 of an impulse wave or Wave C of a corrective pattern (such as a zigzag or flat).
B. Rarely, but sometimes, seen in Wave 3 of an impulse, but this is generally associated with a leading diagonal, not an ending one.
2. Structure:
A. Composed of five sub-waves, labeled (i), (ii), (iii), (iv), (v).
B. Each of these sub-waves subdivides into 3 waves (i.e., they are all corrective or "3-wave" structures, often labeled as a-b-c).
C. This gives the whole pattern a distinct 3-3-3-3-3 internal structure.
3. Price Behavior:
A. Overlapping waves: Wave 4 often overlaps with the price territory of Wave 1, which is normally a rule violation for standard impulsive structures — but it's allowed in an ending diagonal.
B. Converging trendlines: The upper and lower boundaries of the diagonal typically form converging lines (like a wedge), though they can also be parallel in some cases.
C. Diminishing momentum: Often accompanied by momentum divergence, meaning price makes a new high or low, but momentum indicators (MACD, RSI) do not confirm.
4. Implication:
A. An ending diagonal suggests the current trend is running out of steam.
B. Once complete, a sharp reversal or significant correction is expected.
In my analytical view, the byproduct of an Ending Diagonal often lures market participants into a conflicted state — cautious, yet unable to ignore the persistent upward grind. You’ve probably heard the old market adage: “Don’t fight the tape.” In this case, that mentality sets in as traders, wary but worn down, finally throw in the towel and join the advance — only for the market to seemingly punish that decision with a sharp reversal.
Many experienced traders describe their Ending Diagonal experience the same way: “The moment I finally stopped fighting the trend and got long, it was as if the market was waiting for me — and reversed hard.”
That is how I would describe this micro ED we appear to be in the final stages of what I’m counting as the micro wave v of (v) of Minor A.
For now, no key structural support levels within the Micro Ending Diagonal have been breached, so the advance can certainly stretch a little higher. But make no mistake — in my opinion, this remains one of the most dangerous, deceptive patterns to engage with.
Last week, I closed my short out-of-the-money ES call positions during the micro wave iv pullback (not shown on the above chart). Ideally, I’m looking for an opportunity to reestablish a similar position this week. From there I will reassess the larger Ending Diagonal pattern you see outlined on the chart above.

NQ 23/06/2025 BIASHERE IS MY SIMPLE IDEA ABOUT NQ FOR THE NEXT WEEK
everything is clear as the snapshot says

SPY/QQQ Plan Your Trade For 6-20 : Pause Bar PatternToday's Pause Bar pattern suggests the SPY/QQQ will slide into a sideways type of PAUSE in price action today. I'm not expecting much to happen and if we do see any breakaway or breakdown trending it will likely be related to news.
While we have options expiration today and a host of other things that could drive the markets, I believe the markets are struggling to find direction right now. Thus, a pause in trading would be somewhat normal after a holiday-shortened trading week.
Gold and Silver are struggling after a brief rally last week. I believe this is fear related to the Israel/Iran conflict. Metals should continue to move higher.
BTCUSD is slightly higher (forgot to cover BTCUSD in the video), but not moving into a breakaway phase.
Overall, everything is very flat in early trading today. It may stay that way with my PAUSE BAR pattern.
Get some.
#trading #research #investing #tradingalgos #tradingsignals #cycles #fibonacci #elliotwave #modelingsystems #stocks #bitcoin #btcusd #cryptos #spy #gold #nq #investing #trading #spytrading #spymarket #tradingmarket #stockmarket #silver

SPY/QQQ Plan Your Trade For 6-19: GAP Reversal Counter TrendToday's pattern is a GAP Reversal in Counter Trend mode. I believe this could represent a breakdown in the ES/NQ as the US stock market is closed for the Juneteenth holiday.
Obviously, after the Fed comments yesterday (stating "uncertainty") and with the continued Israel/Iran conflict playing out, it makes sense to me that the US markets would move into a pre-weekend consolidation phase.
Even though the US stock market will be closed, the futures market will likely stay open and will carry some general market sentiment and reactions to news.
Watching Gold/Silver and Bitcoin should be very interesting today. I suspect the markets will continue to consolidate downward today - leading to a potential breakdown seeking support day on Friday.
Buckle up. We'll likely have 3-5+ days of news related to the Israel/Iran conflict and other issues over this weekend. It could be very interesting to see how the global markets move through this news.
Get some.
Happy Juneteenth
#trading #research #investing #tradingalgos #tradingsignals #cycles #fibonacci #elliotwave #modelingsystems #stocks #bitcoin #btcusd #cryptos #spy #gold #nq #investing #trading #spytrading #spymarket #tradingmarket #stockmarket #silver

NAS/NQ 4H Buy IdeaLooking for price to break and retest the current high to continue higher
OR
Looking for price to go back and fill the imbalance left below current price to then continue higher

SPY/QQQ Plan Your Trade For 6-18 : GAP Potential PatternToday's GAP Potential pattern suggests the SPY/QQQ may GAP a bit higher at the open, then move into a melt-up phase, trying to identify resistance, then roll into a topping pattern and move downward.
I believe the recent "rollover" of the markets (initiating last Friday with the Israel/Iran conflict) is still dominating the markets and news related to the ongoing conflict could drive a moderate pullback in US assets.
Headed into the Juneteenth holiday (Thursday, June 19), I suggest traders prepare for the US markets to move into somewhat of a SETTLEMENT mode today - where traders don't want to hold too many open positions into Friday's trading.
Additionally, Gold and Silver could move into a very strong upward price move over the next 4-5+ days. So be prepared for metals to hedge risks when the US stock market is closed.
BTCUSD seems to be struggling into the FLAG APEX. I'm waiting to see if my FLAG count is correct and if we get the breakdown in BTCUSD as I expect.
Get some.
#trading #research #investing #tradingalgos #tradingsignals #cycles #fibonacci #elliotwave #modelingsystems #stocks #bitcoin #btcusd #cryptos #spy #gold #nq #investing #trading #spytrading #spymarket #tradingmarket #stockmarket #silver

SPY/QQQ Plan Your Trade for 6-17: Top Resistance PatternToday's pattern suggests the SPY/QQQ will move into a type of topping pattern, attempting to identify resistance, then roll away from that resistance level and trend downward.
I suggest the news related to the conflict between Israel & Iran may continue to drive market trends with traders moving away from uncertainty near these recent highs.
Silver makes a big move higher. Gold will likely follow later this week or early next week.
BTCUSD moves into a sideways FLAGGING pattern - possibly attempting a BIG BREAKDOWN event over the next few weeks.
Overall, the markets look like they are poised for a very big move - just waiting for the GREEN LINK (GO).
Stay safe. Protect capital and HEDGE.
Get some.
#trading #research #investing #tradingalgos #tradingsignals #cycles #fibonacci #elliotwave #modelingsystems #stocks #bitcoin #btcusd #cryptos #spy #gold #nq #investing #trading #spytrading #spymarket #tradingmarket #stockmarket #silver

Nasdaq Seek and Destroy. Play Patience Game.Patience.
both bullish and bearish idea are valid.
We're ahead of FOMC of tomorrow and we might get false movements / remain under range.
better to no try to rationalize the market here but rather let it showcase his will first.

SPY/QQQ Plan Your Trade For 6-16 : Up-Down-Up PatternToday's Up-Down-Up Pattern suggests the markets will transition into a moderate upward trending price bar - which is quite interesting in the world we have today.
War and a big weekend of events, protests and other new items could drive market trends over the next few days.
Still, the SPY Cycle Pattern for today is an Up-Down-Up - which suggests last Thursday was an Up bar, last Friday was a Down bar, and today should be an Up bar.
The Gold/Silver pattern is a POP pattern in Counter-trend.
I believe the US markets are benefiting as a safe-haven for capital as the global turmoil drives global investors to seek safety and security for their capital.
That means as long as the world continues to spin out of control, the US markets and the US-Dollar will act as a moderate safe-haven for capital.
Gold and Silver should also benefit from this global chaos.
Bitcoin is benefiting from the strength of the US markets (and the technology sector) as well.
Let's see how this week start to play out. I'm waiting for some more news.
Could be very interesting this week.
Get some.
#trading #research #investing #tradingalgos #tradingsignals #cycles #fibonacci #elliotwave #modelingsystems #stocks #bitcoin #btcusd #cryptos #spy #gold #nq #investing #trading #spytrading #spymarket #tradingmarket #stockmarket #silver

SPY/QQQ Plan Your Trade For 6-13 : Harami-Inside PatternToday's pattern suggests the markets may stall into a sideways price range.
After the news of Israel targeting Iran in a preemptive strike late yesterday afternoon, the markets moved dramatically lower while Gold & Silver moved higher on the news.
I, personally, see this market trend as a shift in thinking ahead of a long Father's Day weekend.
I see traders trying to position their accounts/trades for uncertainty.
I believe we could see a bit of a shift today - particularly in Metals and the QQQ/NASDAQ/BTCUSD.
Overall, I strongly suggest traders prepare for extreme volatility this weekend as any further news of a counter-strike or further military action in the Middle East could roil the markets.
Happy Friday the 13th - everyone.
Going to be an interesting day to say the least.
Get some.
#trading #research #investing #tradingalgos #tradingsignals #cycles #fibonacci #elliotwave #modelingsystems #stocks #bitcoin #btcusd #cryptos #spy #gold #nq #investing #trading #spytrading #spymarket #tradingmarket #stockmarket #silver

SPY/QQQ Plan Your Trade For 6-12: BaseRally In Trend ModeToday's pattern suggests the markets may attempt to identify a base and move higher (rally) off that base level.
Given the overnight price activity, I suggest the process of identifying the base level could prompt a deeper early decline in price - possibly attempting to retest 595-597 lows before finding support and attempting to rally.
As I've been warning over the past few weeks/months, I'm still seeing the Excess Phase Peak pattern playing out as a Flag Termination - rolling into a downtrend and attempting to move back towards the $480 lows as a real possibility. I've been warning and watching for the breakdown in trend - but we've not seen it yet.
Thus, we are still BULLISH until we get a confirmation of a solid breakdown. That would be a move below the 580-585 level at this point. We need to see some type of solid breakdown in price, breaking away from the FLAG setup and moving downward, before I could confidently suggest the Flag Breakdown has happened.
Gold and Silver are making a big move higher. Gold is finally starting to move back above $3400 and I believe watching Silver, Gold, & Platinum rally suggests FEAR is elevating as we move into the end of June.
I still believe Gold has a chance to rally above $4k before the end of June. We'll see if it happens.
BTCUSD is moving into a DUAL-EPP pattern. This is very interesting. Watch the video as I highlight why this could prompt a dual-stage EPP breakdown in Bitcoin over the next 20 to 50+ days.
Get some.
#trading #research #investing #tradingalgos #tradingsignals #cycles #fibonacci #elliotwave #modelingsystems #stocks #bitcoin #btcusd #cryptos #spy #gold #nq #investing #trading #spytrading #spymarket #tradingmarket #stockmarket #silver

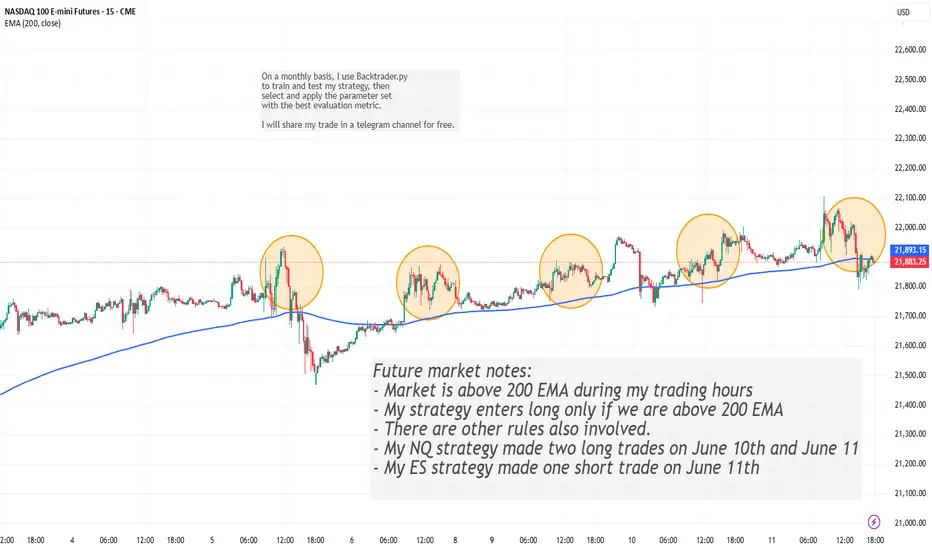
200 EMA Futures Strategy Recap: June 10–11Description:
Market Context:
During my trading window (11:00–17:00 ET), price remained decisively above the 200-period EMA.
Key Rule:
• As one of several entry conditions, the model only goes long when price is above the 200 EMA.
June 10–11 Trades:
NQ Strategy: Two long entries—one on June 10 and one on June 11.
ES Strategy: One short entry on June 11 (all other rules aligned).
Feel free to ask questions or share feedback!
NQ (Nasdaq) Futures Trading Levels [6/11/25]For Day Traders, here's some trading levels for NQ Futures Trading for today. It's CPI day, so we should get some nice swings today. Trade carefully and trade smart!

Nasdaq Potential Daily ReversalIPDA Speaking + Contract closure we can see speed take place to reach BSL outside IPDA range but why whould the just past 20 days HRLR instead of moving higher with speed
Because of Intermarket striction
maybe to build more stops there but it would be greater in terms of liquidity efficiency to place a fake D high in here and reverse, take the liquidity lower on D HRLR and then continue higher to reach 22,672.00.
The key here is: do we breach above the D SIBI or do we react from it.
one of two will unlock the next 20 to 40 trading days of delivery.

SPY/QQQ Plan Your Trade For 6-11: Bottom-Base Rally Counter TrndToday's counter-trend Bottom-Base Rally pattern suggests the markets may attempt to find a peak and roll over into a downtrend.
The normal Bottom-Base Rally pattern is similar to the start of a moderate price base/bottom, then moving into a moderate rally phase.
In counter-trend mode this pattern would be inverted - forming a Top and then moving into a downward price trend.
I've been warning of the potential of a rollover top type of pattern in the SPY over the past few weeks - but it never really setup/confirmed.
I'll be curious to see if this counter-trend pattern, today, sets up some type of big top formation in the SPY/QQQ. It might be related to news as well.
Gold and Silver have a Gap-Stall-Revert-FLUSH pattern. This is always an interesting pattern because is suggests price is going to attempt to either gap and trend or stall and revert. My guess is we are looking at more trending in metals today.
Platinum is RIPPING higher (PL1!). Because of this, I believe Silver and Gold will attempt to follow Platinum and move to the upside today.
BTCUSD is stalling a bit. We'll see if we get any big price move in Bitcoin today. After the big rally over the past few days, it will be interesting to see if BTCUSD reverts downward or continues higher.
Overall, today's patterns suggest the markets are seeking direction. Get ready for an exciting day in the markets.
Get some.
#trading #research #investing #tradingalgos #tradingsignals #cycles #fibonacci #elliotwave #modelingsystems #stocks #bitcoin #btcusd #cryptos #spy #gold #nq #investing #trading #spytrading #spymarket #tradingmarket #stockmarket #silver

Live trade 06/10/2025Here is what one of my strategy traded today. I have 5 trading strategies in NQ and ES.
Today's trade was made based on the NQ DVD strategy where I look at the cumulative daily volume, an indicator that I developed. The Cumulative daily volume is calculated based on the direction of each candle and it resets on daily basis. For more info, please see my channel.
For this specific trade, the both TP and SL are calculated based on a coefficient of ATR. If none of them are met, then I close the trade by 16PM EST.

SPY/QQQ Plan Your Trade For 6-10 : POP PatternToday's POP pattern suggests a potential big price move will take place. Given the overnight activity on the ES (rallying higher then rolling over), I suggest today's price move may attempt to retest these overnight highs, then repeat the breakdown phase into the close.
The markets continue to try to melt upward. This trend will continue until the markets decide to break downward.
After the deep low created by the tariff news, the markets continue to try to rally to new highs. It is very likely that Q2 earnings data may push the SPY to new ATH levels before we see any big rotation in price.
The markets have a tendency to move just above recent highs, then stall and revert downward as a pullback. This move may be no different.
The continued stalling of price trying to move higher recently suggests the markets are running into moderate resistance and I believe traders are actively pulling capital away from this rally.
The trend is still BULLISH. Stay cautious of this upward move as a breakdown could happen at any time.
Gold and Silver are moving into an impressive rally phase. Silver and Platinum have moved considerably higher over the past 10+ days. I believe Gold is lagging and will make a big move higher over the next 5 to 10+ days.
Silver is targeting $41-44+. Gold should target $3400 to $3500+ near the same time.
Bitcoin made a huge rally yesterday - reaching my 110,500 upper resistance level. Now, we see if Bitcoin has the momentum to carry higher or if it will fail and rollover into a downtrend.
It seems we are right as a MAKE or BREAK level in the markets. I'm still a believer of MELT UP until it fails.
I continue to watch for technical failure - but I've not seen it happen yet.
Get some.
#trading #research #investing #tradingalgos #tradingsignals #cycles #fibonacci #elliotwave #modelingsystems #stocks #bitcoin #btcusd #cryptos #spy #gold #nq #investing #trading #spytrading #spymarket #tradingmarket #stockmarket #silver

Nasdaq Bearish 4hNasdaq Bearish after the failure in continuation through Previous Weekly High and the rejection afterwards.
Setting the Target to 21,471.00 Swing Low and using 21,716.00 as Low Easy Hanging Fruit (LEHF) objective that We may even reach today despite the small range day expectation (pre-CPI)

A Potentially Dangerous Pattern Takes ShapeWhile the futures market has yet to break into new all-time high territory, the previously discussed bearish micro setup has now been invalidated. In its place, we’re witnessing a complex, overlapping advance—creeping steadily toward the prior highs in the S&P 500 (ES).
At the micro level, I currently see no compelling bearish setup. However, this grinding upward move—lacking strong conviction from either buyers or sellers—is not necessarily bullish. In fact, it’s a hallmark of a potentially dangerous pattern: a primary degree ending diagonal.
If my interpretation is correct, both the “orange” and “purple” wave counts point to the same ominous conclusion. They suggest that what we're seeing could culminate in a sharp, possibly violent reversal—one that would ultimately retrace back to where this entire primary wave began. For reference, that’s just above 4,000, marked by the conclusion of Primary Wave 4 in October 2022.
This is the moment for caution—not after the damage is done.
Yes, we may push into new all-time highs. But within this fragile and overlapping structure, that outcome is far from guaranteed. Even if we get there, the looming question remains:
At what cost?
