NQ! Short Idea (MXMM, Quarterly Theory)Dear Traders,
today I present you once again my current idea on the Nasdaq. We have swept a High Liquidity Area marked as my lower HTF PDA. Because of that we might see a stronger Pullback as shown on my Chart.
However, I will still keep my eyes open and wait for the 9:30 (UTC-4) Manipulation to look for a Market Maker Sell Model which I will only consider a after a Pullback into my Key Areas and Price Action showing interests of a bearish continuation.
(09:30 Manipulation, Liquidity Sweep + SMT Divergence, Break Of Structure, Any PD-Array)
Praise be to God
-T-
NASDAQ 100 E-MINI FUTURES
Double Bullish Divergence Flashing on $SPY and $QQQWe’re spotting a double bullish divergence across two major indices: the S&P 500 ( AMEX:SPY ) and the NASDAQ 100 ( NASDAQ:QQQ ).
On both daily charts:
Price is making lower lows, signaling continued downward pressure.
Meanwhile, the RSI is forming higher lows, revealing a potential loss of bearish momentum.
This kind of setup often precedes a trend reversal or strong relief bounce, especially when observed across multiple indices at once. The fact that both AMEX:SPY and NASDAQ:QQQ are flashing the same signal gives added confluence and strength to this potential move.
Divergence = a potential bullish signal
Watch for confirmation: break of previous highs or strong bullish candles.
Caution: divergences don’t always play out — wait for confirmation before going long.
Are we looking at the bottom forming? 👀
Stay alert. A shift in sentiment could be underway.
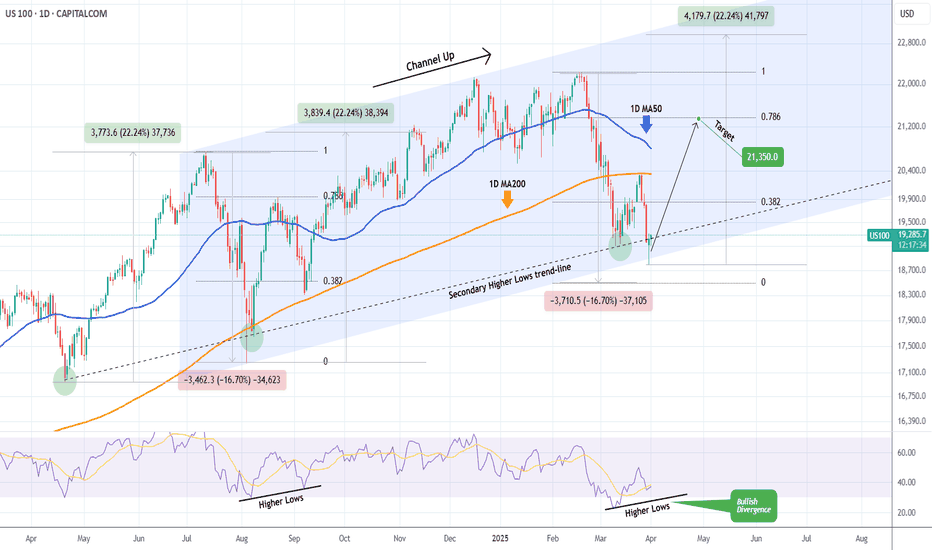
NASDAQ Huge Bullish Divergence points to 21350 inside April.Nasdaq (NDX) has been trading within a Channel Up pattern since the July 11 2024 High. The latest rally that started on March 11 2025 after a brutal 3-week downtrend/ Bearish Leg, got rejected on the 1D MA200 (orange trend-line) as the market digested the disappointing PCE.
Despite this aggressive rejection, the price hit and rebounded yesterday exactly at the bottom of the Channel Up with the previous such contact going back to the August 05 2024 Low. Not to mention that both the March 11 2025 and August 08 2024 Lows were formed exactly on the secondary Higher Lows trend-line.
What's perhaps more critical than any of these though, is that the 1D RSI didn't make a new Low last week and remains above the oversold barrier on a Higher Low trend-line that is a huge technical Bullish Divergence against the price's Lower Lows.
As with the August 22 2024 High, our first short-term Target is on the 0.786 Fibonacci retracement level at 21350.
-------------------------------------------------------------------------------
** Please LIKE 👍, FOLLOW ✅, SHARE 🙌 and COMMENT ✍ if you enjoy this idea! Also share your ideas and charts in the comments section below! This is best way to keep it relevant, support us, keep the content here free and allow the idea to reach as many people as possible. **
-------------------------------------------------------------------------------
💸💸💸💸💸💸
👇 👇 👇 👇 👇 👇
NASDAQ: Forming the bottom. Don't miss the 2025 rally to 28,000.Nasdaq is bearish on its 1D technical outlook (RSI = 35.342, MACD = -382.320, ADX = 38.919), headed towards oversold territory. 1W is also headed towards an oversold state (RSI = 36.953) as the price has crossed under the 1W MA50 and is approaching the 1W MA100. This is currently waiting at the bottom of the 2 year Channel Up. This 6 month correction is so far technically nothing but the bearish wave of this Channel Up and has been almost as strong (-15.89%) as the previous in July-Aug 2024.
Notice an key technical tendency here, no correction/bearish wave has ever crossed under the S1 level of two highs before. The current S1 is at 18,400. So taking those conditions into consideration as well as the fact that the 1W RSI is at the bottom of its Channel Down, we see this week as the bottom formation candle that will start a new bullish wave. The prior two such waves both made an incredibly symmetric rise of +52.60%, so expecting the same puts our target at TP = 28,000, most likely by December 2025-January 2026.
## If you like our free content follow our profile to get more daily ideas. ##
## Comments and likes are greatly appreciated. ##
Weekly Market Forecast: SELL THE INDICES!In this video, we will analyze the S&P 500, NASDAQ, AND DOW JONES Futures for the week of March 31st - April 4th.
The equity markets took a bearish turn last week. This is likely to continue for the upcoming week.
Monday is the end of March. Tuesday brings a new week and new opportunities. April 2nd brings... potentially market flipping volatility. The day the Trump tariffs are implemented.
Be careful. Let the market give you direction, and then get involved.
Enjoy!
May profits be upon you.
Leave any questions or comments in the comment section.
I appreciate any feedback from my viewers!
Like and/or subscribe if you want more accurate analysis.
Thank you so much!
Disclaimer:
I do not provide personal investment advice and I am not a qualified licensed investment advisor.
All information found here, including any ideas, opinions, views, predictions, forecasts, commentaries, suggestions, expressed or implied herein, are for informational, entertainment or educational purposes only and should not be construed as personal investment advice. While the information provided is believed to be accurate, it may include errors or inaccuracies.
I will not and cannot be held liable for any actions you take as a result of anything you read here.
Conduct your own due diligence, or consult a licensed financial advisor or broker before making any and all investment decisions. Any investments, trades, speculations, or decisions made on the basis of any information found on this channel, expressed or implied herein, are committed at your own risk, financial or otherwise.
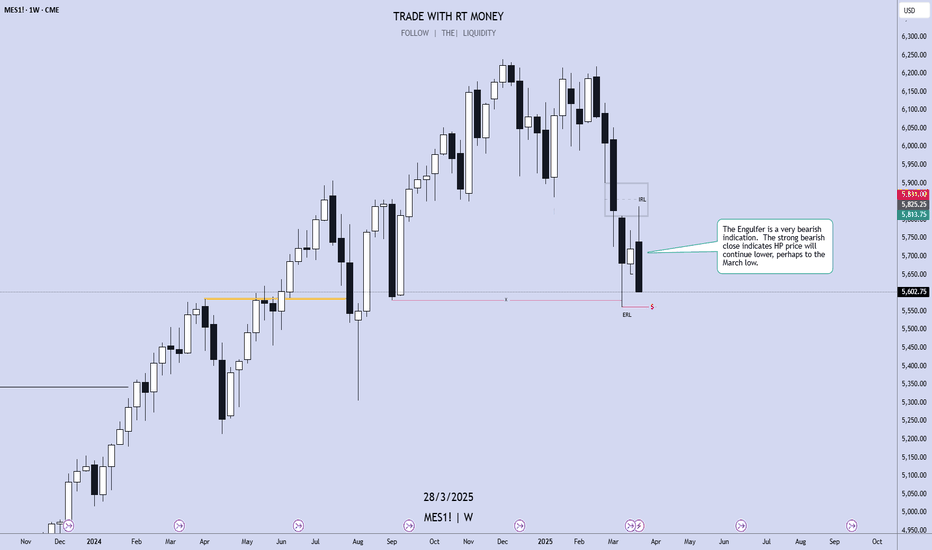
$NQ IdeaWhen analyzing the NQ weekly chart, we observe that the price has consumed internal liquidity in the premium region of the range and closed in a way that favors the continuation of the bearish movement. Given this, we believe the next **Draw on Liquidity** will be the weekly double bottom located just below.
However, since the market has experienced a sharp decline without corrections, there is a possibility of buying opportunities before the downtrend resumes. As we are in a discounted region on the weekly chart, the price may seek momentum toward the premium region, capturing **buyside liquidity** as fuel for the continuation of the bearish movement.
It is important to highlight that we must wait for the market to open and observe its initial movement to better define our trading strategy.
NASDAQ Will the disappointing PCE today form a Double Bottom?Nasdaq is on a strong 3 day correction that has almost erased the recovery attempt since the March 11th low.
That was a higher Low inside the 8 month Channel Up and the current correction may be a bottom formation attempt like September 6th 2024.
Trading Plan:
1. Buy before the closing market price.
Targets:
1. 23350 (the 1.382 Fibonacci extension).
Tips:
1. The RSI (1d) illustrates the similarities with July-September 2024 in a much better way. Strong indication that the Channel Up is attempting to price a bottom.
Please like, follow and comment!!
Strong bullish outlook for the E-mini Nasdaq-100 (NQM2025)Nasdaq-100 E-mini Futures (NQM2025) – Technical & Fundamental Analysis
Technical Overview:
My Daily chart analysis on TradingView highlights a strong bullish outlook for the E-mini Nasdaq-100 (NQM2025). Here are the key takeaways:
Liquidity Sweep & Support Retest:
The recent decline led to a liquidity sweep (LQ SWEEP) at a critical ascending trendline. This suggests a classic stop-hunt scenario where weaker long positions were liquidated before stronger buyers stepped in.
Historical price action indicates that buyers previously entered at similar levels (noted as "Buyers coming in hot here"), reinforcing this demand zone.
Bullish Trendline Respect:
The long-term ascending trendline has been respected, acting as a dynamic support level.
The recent bounce suggests that this level remains intact, further validating the bullish structure.
Order Block (OB) & Market Structure Shift (MSS):
A previous bearish market structure shift (MSS) led to a short-term decline, but price has since found support and rebounded.
The chart suggests a reversion to the upside, targeting prior imbalance zones and liquidity pockets.
Projected Path & Targets:
The green projection indicates an expectation of higher highs, likely targeting the 21,500 - 22,500 range in the coming weeks.
The sell-side liquidity has been cleared, increasing the probability of a bullish move towards the order block resistance near 21,000.
Fundamental Confirmation (#EdgeFinder & #COT Data):
From a fundamental perspective, the bullish bias is further confirmed by EdgeFinder data and recent Commitment of Traders (COT) reports:
Institutional Positioning:
The latest COT data shows that institutional traders have increased their net long positions in Nasdaq futures, signaling bullish sentiment.
Macroeconomic Factors:
Recent economic reports and Fed statements have favored a risk-on environment, benefiting tech-heavy indices like Nasdaq.
Earnings season is approaching, with expectations of strong tech sector performance potentially fueling further upside.
Conclusion & Market Sentiment:
The confluence of technical support, institutional buying, and positive macroeconomic factors strengthens the case for a bullish continuation in Nasdaq-100 futures.
The key level to watch is 20,000—if held, the probability of a move towards 21,500 - 22,500 increases significantly.
Risk factors include unexpected macroeconomic shifts or stronger-than-expected hawkish Fed rhetoric, which could slow momentum.
This is not financial advice, only data analysis. Please consult a qualified financial professional for personalized guidance.
Trump's Auto Tariffs Shake Things Up on Wall StreetTrump's tariffs are clearly not going away. In fact, he's upped the ante with a 25% tariff on all non-US cars, vowed to target pharmaceuticals and promised more are to come on April 2nd. Given the dire weakness in consumer sentiment data, I suspect Wall Street indices may have seen a swing high.
Matt Simpson, Market Analyst at City Index and Forex.com
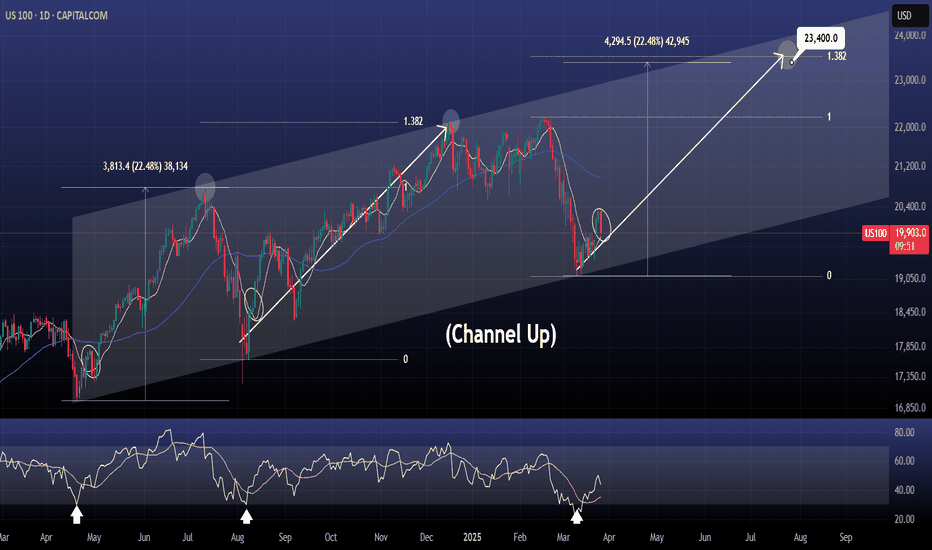
NASDAQ on the first minor pullback of the new bullish wave.Nasdaq / US100 has just started the new bullish wave of the long term Channel Up.
The bottom was made 2 weeks ago and every time the bullish wave crossed over its 4hour MA50, it is expected to make a pullback retest at some point.
This pullback is taking place today.
Whether it replicates the first bullish wave of the Channel Up or the second, the index aims for either a 22.48% total rise or the 1.382 Fibonacci extension.
Both happen to be around the same level.
Buy and target a little under them at 23400.
Previous chart:
Follow us, like the idea and leave a comment below!!
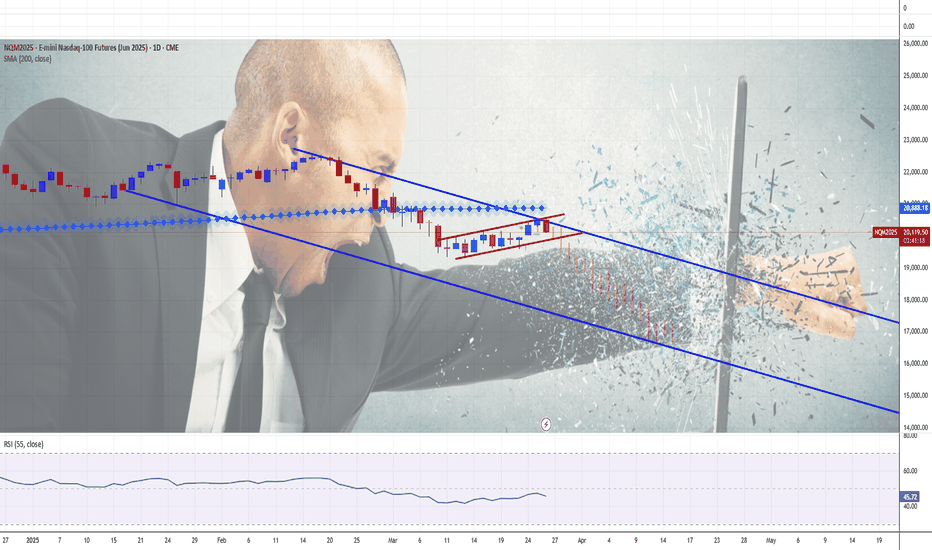
US Cash Market Goes 'Flippant'. Understanding Revenge in TradingFirst of all, revenge trading is a destructive pattern of behavior in trading where individuals make impulsive and emotionally-driven decisions in an attempt to recoup previous losses. This practice is not limited to novice traders; even experienced traders can fall prey to it. The primary emotions driving revenge trading include anger, frustration, greed, fear, and shame, which cloud judgment and lead to irrational decision-making.
Causes of Revenge Trading
Emotional Response: Traders often react emotionally to significant losses, feeling compelled to immediately recover their losses without adequate analysis or strategy.
Lack of Discipline: Deviating from established trading plans and risk management principles is common in revenge trading.
Psychological Triggers: Feelings of injustice, anger, or a desire for vengeance against the market can trigger revenge trading.
Consequences of Revenge Trading
Financial Losses: Revenge trading often results in larger losses due to riskier trades and poor timing.
Emotional Burnout: The stress and frustration from repeated losses can lead to emotional exhaustion and decreased trading performance.
Career Impact: Persistent revenge trading can erode confidence and lead to a trader questioning their abilities.
Real-Life Examples of Revenge Trading
Increasing Position Size: A trader experiences a significant loss and decides to double or triple their position size in the next trade, hoping to quickly recover their losses. This action disregards risk management principles and often leads to even greater losses.
Ignoring Stop-Loss Orders: After a loss, a trader might hold onto a losing position longer than planned, hoping it will turn around. This behavior ignores established stop-loss orders and can result in further financial damage.
Chasing Trades: A trader feels compelled to enter trades without proper analysis, driven by the urge to recoup losses quickly. This impulsive behavior can lead to a series of poor trading decisions.
Market Reversal Scenario: A trader suffers a loss due to a sudden market reversal. In an attempt to recover, they enter a trade in the opposite direction without thorough analysis, which can exacerbate their losses.
Wish more examples? Watch recent one below 👇👇
How to Avoid Revenge Trading
To avoid revenge trading, traders should focus on maintaining discipline and adhering to their trading strategies. This includes:
Taking Breaks: After a loss, taking time to reassess the market and calm emotions can help prevent impulsive decisions.
Sticking to Plans: Adhering to established trading plans and risk management principles is crucial.
Emotional Awareness: Recognizing emotional triggers and taking steps to manage them can help prevent revenge trading.
In conclusion, revenge trading is a HARMFUL AND DANGEROUS practice that can lead to significant financial and emotional consequences. Understanding its causes and recognizing its signs are essential steps in avoiding this behavior and maintaining a successful trading career.
--
Best wishes,
@PandorraResearch Team 😎
NASDAQ: Short term Channel Up on critical Resistance.Nasdaq is neutral on its 1D technical outlook (RSI = 49.418, MACD = -276.610, ADX = 37.535) as it has recovered from the oversold state of 2 weeks ago. By doing so, it has formed a Channel Up on the 1H timeframe but as the price hit its top and the 1H RSI has formed a bearish divergence like the previous HH, it is possible to see a quick pullback. As long as the price stays inside the Channel Up, target the 1H MA200 (TP = 19,900). If it crosses above the top of the Channel Up, buy and target the R1 level (TP = 20,650).
## If you like our free content follow our profile to get more daily ideas. ##
## Comments and likes are greatly appreciated. ##
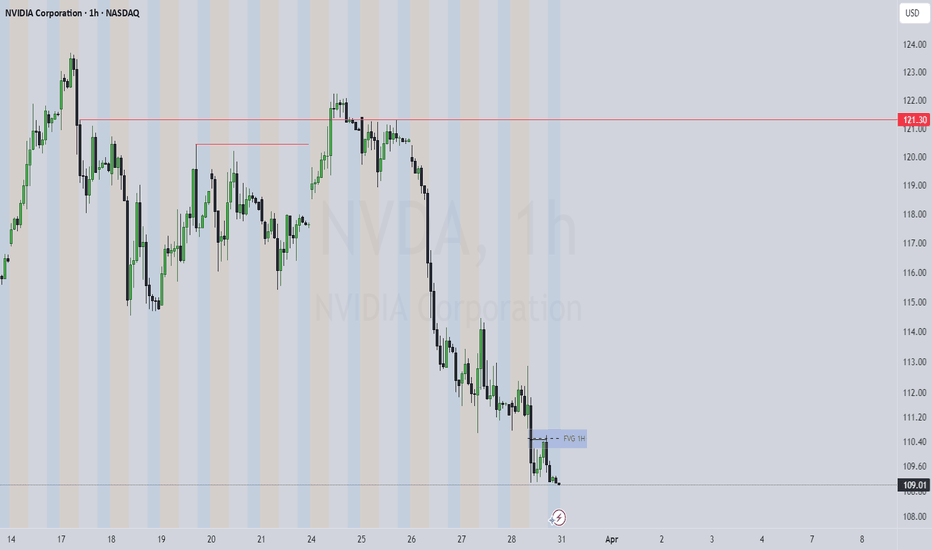
Tuesday's NQ Trade idea 3.25.25 first trade of the day. SL was hit at $160 profit. We disrespected the bearish FVG level.
Let's see what happens next.
Forex, Crypto and Futures Trading Risk Disclosure:
The National Futures Association (NFA) and Commodity Futures Trading Commission (CFTC), the regulatory agencies for the forex and futures markets in the United States, require that customers be informed about potential risks in trading these markets. If you do not fully understand the risks, please seek advice from an independent financial advisor before engaging in trading.
Trading forex and futures on margin carries a high level of risk and may not be suitable for all investors. The high degree of leverage can work against you as well as for you. Before deciding to trade, you should carefully consider your investment objectives, level of experience, and risk appetite.
There is a possibility of losing some or all of your initial investment, and therefore, you should not invest money that you cannot afford to lose. Be aware of the risks associated with leveraged trading and seek professional advice if necessary.
BDRipTrades Market Opinions (also applies to BDelCiel and Aligned & Wealthy LLC):
Any opinions, news, research, analysis, prices, or other information contained in my content (including live streams, videos, and posts) are provided as general market commentary only and do not constitute investment advice. BDRipTrades, BDelCiel, and Aligned & Wealthy LLC will not accept liability for any loss or damage, including but not limited to, any loss of profit, which may arise directly or indirectly from the use of or reliance on such information.
Accuracy of Information: The content I provide is subject to change at any time without notice and is intended solely for educational and informational purposes. While I strive for accuracy, I do not guarantee the completeness or reliability of any information. I am not responsible for any losses incurred due to reliance on any information shared through my platforms.
Government-Required Risk Disclaimer and Disclosure Statement:
CFTC RULE 4.41 - HYPOTHETICAL OR SIMULATED PERFORMANCE RESULTS HAVE CERTAIN LIMITATIONS. UNLIKE AN ACTUAL PERFORMANCE RECORD, SIMULATED RESULTS DO NOT REPRESENT ACTUAL TRADING. ALSO, SINCE THE TRADES HAVE NOT BEEN EXECUTED, THE RESULTS MAY HAVE UNDER-OR-OVER COMPENSATED FOR THE IMPACT, IF ANY, OF CERTAIN MARKET FACTORS, SUCH AS LACK OF LIQUIDITY. SIMULATED TRADING PROGRAMS IN GENERAL ARE ALSO SUBJECT TO THE FACT THAT THEY ARE DESIGNED WITH THE BENEFIT OF HINDSIGHT. NO REPRESENTATION IS BEING MADE THAT ANY ACCOUNT WILL OR IS LIKELY TO ACHIEVE PROFIT OR LOSSES SIMILAR TO THOSE SHOWN.
Performance results discussed in my content are hypothetical and subject to limitations. There are frequently sharp differences between hypothetical performance results and the actual results subsequently achieved by any particular trading strategy. One of the limitations of hypothetical trading results is that they do not account for real-world financial risk.
Furthermore, past performance of any trading system or strategy does not guarantee future results.
General Trading Disclaimer:
Trading in futures, forex, and other leveraged products involves substantial risk and is not appropriate for all investors.
Do not trade with money you cannot afford to lose.
I do not provide buy/sell signals, financial advice, or investment recommendations.
Any decisions you make based on my content are solely your responsibility.
By engaging with my content, including live streams, videos, educational materials, and any communication through my platforms, you acknowledge and accept that all trading decisions you make are at your own risk. BDRipTrades, BDelCiel, and Aligned & Wealthy LLC cannot and will not be held responsible for any trading losses you may incur.


