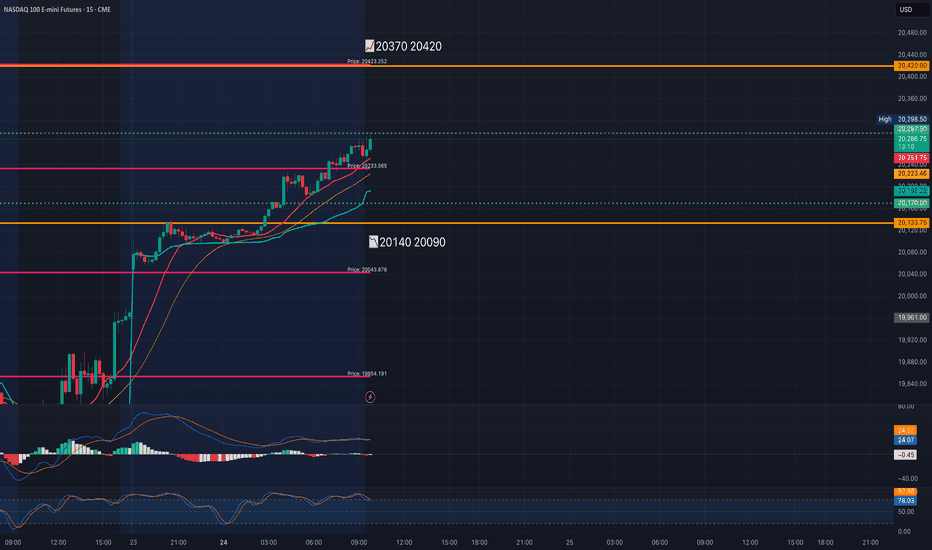
MNQ!/NQ1! Day Trade Plan for 03/24/2025MNQ!/NQ1! Day Trade Plan for 03/24/2025
*LAST UPDATE FOR THIS WEEK*
📈20370 20420
📉20140 20090
Like and share for more daily NQ levels 🤓📈📉🎯💰
*These levels are derived from comprehensive backtesting and research and a quantitative system demonstrating high accuracy. This statistical foundation suggests that price movements are likely to exceed initial estimates.*
NASDAQ 100 E-MINI FUTURES
NASDAQ The recovery has officially started.Nasdaq (NDX) has been trading within a 2-year Channel Up and with today's opening, it broke above the Lower Highs trend-line of February's Bearish Leg. Even though the confirmed bullish reversal signal technically comes above the 1D MA50 (blue trend-line), we already have the early bottom signals.
First and foremost, the 1D RSI rebounding from the same oversold (<30.00) level where all major Higher Lows of the Channel Up did (August 05 2024, April 19 2024, October 26 2023). Every time the price reached its -0.5 Fibonacci extensions following such bottoms. Also each Bullish Leg tends so far to be smaller than the previous.
As a result, targeting a +24% rise (-3% less than the previous Bullish Leg) at 23500 is a very realistic Target technically, as it is considerably below the -0.5 Fibonacci extension.
-------------------------------------------------------------------------------
** Please LIKE 👍, FOLLOW ✅, SHARE 🙌 and COMMENT ✍ if you enjoy this idea! Also share your ideas and charts in the comments section below! This is best way to keep it relevant, support us, keep the content here free and allow the idea to reach as many people as possible. **
-------------------------------------------------------------------------------
💸💸💸💸💸💸
👇 👇 👇 👇 👇 👇
Looking for a minimum of ES 5850In the days to come our initial pattern off the recent has the high probability to get into the 5850 area.
Here I will be looking for a pullback.
If this pullback can be viewed as corrective in it's structure then I expect the subdivisions and pathway on my ES4Hr chart should follow suit. However, if the pullback turns out to be impulsive, I will be looking for follow through for either Minor B having completed early, or the alternate wave (iv). If that sort of price action were to materialize, it's Friday's low of 5651.25 that must support any drop if we're to continue to subdivide higher and have this minor B take more time.
Weekly Market Forecast SP500 NASDAQ DOW: Short Term BUYS!In this video, we will analyze the S&P 500, NASDAQ, AND DOW JONES Futures for the week of March 24 - 28th. We'll determine the bias for the upcoming week, and look for the best potential setups.
The equity markets have been choppy lately, but this week may be different. The economic calendar shows a smooth week ahead, as there are no NFP, FOMC, or similarly volatile news ahead to potentially reverse a market out of the blue. The indices show potential to break consolidation and move upwards. So we wait until there are definitive market structure shifts to occur, acting as confirmations.
Only then do we pounce!
Enjoy!
May profits be upon you.
Leave any questions or comments in the comment section.
I appreciate any feedback from my viewers!
Like and/or subscribe if you want more accurate analysis.
Thank you so much!
Disclaimer:
I do not provide personal investment advice and I am not a qualified licensed investment advisor.
All information found here, including any ideas, opinions, views, predictions, forecasts, commentaries, suggestions, expressed or implied herein, are for informational, entertainment or educational purposes only and should not be construed as personal investment advice. While the information provided is believed to be accurate, it may include errors or inaccuracies.
I will not and cannot be held liable for any actions you take as a result of anything you read here.
Conduct your own due diligence, or consult a licensed financial advisor or broker before making any and all investment decisions. Any investments, trades, speculations, or decisions made on the basis of any information found on this channel, expressed or implied herein, are committed at your own risk, financial or otherwise.
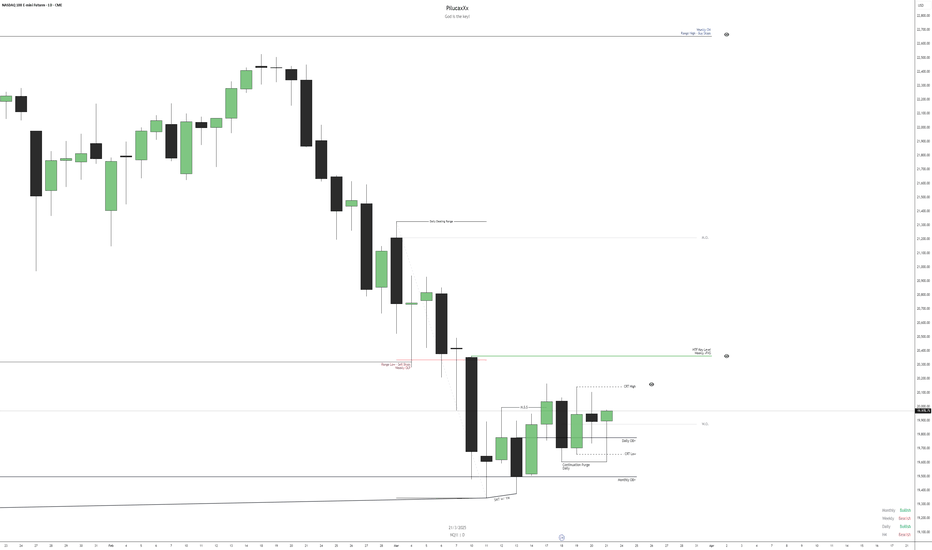
$NQ IdeaAnalyzing the NQ for the upcoming week, we observe that the price held at the monthly OB, where an SMT also formed, reinforcing the indication of a bullish continuation from that point.
On the daily chart, we identify a shift in market structure, evidenced by the presence of an SMT + MSS, followed by a continuation purge of the price. Given this, we understand that our weekly DOL will initially be the daily CRT High and the Weekly FVG, although the final target may be the monthly Range High.
Additionally, based on the economic calendar, we anticipate more significant movements on Monday, Thursday, and Friday due to news related to the dollar.
It is important to emphasize that this analysis is based solely on price action, and macroeconomic factors may impact the market throughout the week. Therefore, we must be prepared for potential changes in the scenario.
Nasdaq: Wave A Done – Now Lining Up for a Strong BounceThe Nasdaq is starting to look really interesting here. In my view, we've completed Wave ((a)) to the downside—a clean (abc) correction. Why do I think it's done? Because we've just tapped into a Fair Value Gap (FVG) and saw a strong reaction, just above last year’s VWAP, which I always consider a key reference point on the higher time frame.
Ideally, I would have liked to see that 19,090 level get tagged—unfortunately, we didn’t quite reach it. But honestly, this reaction is solid enough to still keep the bullish scenario intact.
Adding to that, the RSI is now in oversold territory, and the last two times we’ve seen that, it was followed by strong upward moves. Based on all of this, I’m expecting a solid bounce over the coming weeks, likely lasting into Q1 or even Q2 2025 .
Where could this move take us? I see two key zones: the first between 22,000 and 22,425 and the second between 23,320 and 23,675. Could it land somewhere in between? Sure. But one of those zones is where I expect this corrective structure to wrap up. That would likely complete the larger ((abc)) correction, after which we’ll finally begin forming the macro Wave A—which will open the next big leg of structure.
So the bigger picture is in play here. In the meantime, I’ll be hunting for entries on the lower time frames, because I do think we’re setting up for a pretty solid push on this index in the coming weeks.
MNQ!/NQ1! Day Trade Plan for 03/20/2025MNQ!/NQ1! Day Trade Plan for 03/20/2025
📈19850 19900
📉19760 19670
Like and share for more daily NQ levels 🤓📈📉🎯💰
*These levels are derived from comprehensive backtesting and research and a quantitative system demonstrating high accuracy. This statistical foundation suggests that price movements are likely to exceed initial estimates.*
This RUT/NDX ratio may convince you to buy NASDAQ aggressively.Nasdaq (NDX) has been under heavy selling pressure in the past 30 days. This short-term pull-back however is nothing but a buy opportunity on the long-term, and this study shows you why.
The answer lies on the RUT/NDX ratio which shows that this may be the time to get heavier on tech. The use of the Russell 2000 index (RUT) is due to the fact it represents a wider array of companies. Naturally over the years (this 1M chart shows data since 2006), the ratio declines within a Channel Down as historically the riskier tech sector attracts more capital and grows more.
However there are instances where Russell gains more against Nasdaq. We are currently though at a time where this isn't the case as the ratio seems to be ready for decline following the completion of a consolidation that on previous fractals (March 2015, September 2008) was bearish, thus positive for Nasdaq.
As you can see, this movements can be grasped by the Sine Waves, though not perfectly, but still good enough to understand the cyclical pattern we're in, also with the help of the 1M RSI Triangles.
Nasdaq (which is represented by the blue trend-line) has started massive expansion Channel Up patterns following this unique signal given by the RUT/NDX ratio. The first was right after the 2009 Housing Crisis bottom and the second during the 2015/ 2016 E.U., VW and Oil crisis.
The key here is on the 1M RSI. The Triangle is about to beak to the upside and every time this happened in the last 20 years, it coincided with a pull-back on Nasdaq (blue circle) similar to the current one. What followed was massive rallies each time.
As a result, this could be an indication that even though the tariffs have rattles investor confidence lately, this is an opportunity for a strong buy position for at least the rest of the year.
-------------------------------------------------------------------------------
** Please LIKE 👍, FOLLOW ✅, SHARE 🙌 and COMMENT ✍ if you enjoy this idea! Also share your ideas and charts in the comments section below! This is best way to keep it relevant, support us, keep the content here free and allow the idea to reach as many people as possible. **
-------------------------------------------------------------------------------
💸💸💸💸💸💸
👇 👇 👇 👇 👇 👇
MNQ!/NQ1! Day Trade Plan for 03/18/2025MNQ!/NQ1! Day Trade Plan for 03/18/2025
📈20040 20085
📉19670 19620
Like and share for more daily NQ levels 🤓📈📉🎯💰
*These levels are derived from comprehensive backtesting and research and a quantitative system demonstrating high accuracy. This statistical foundation suggests that price movements are likely to exceed initial estimates.*
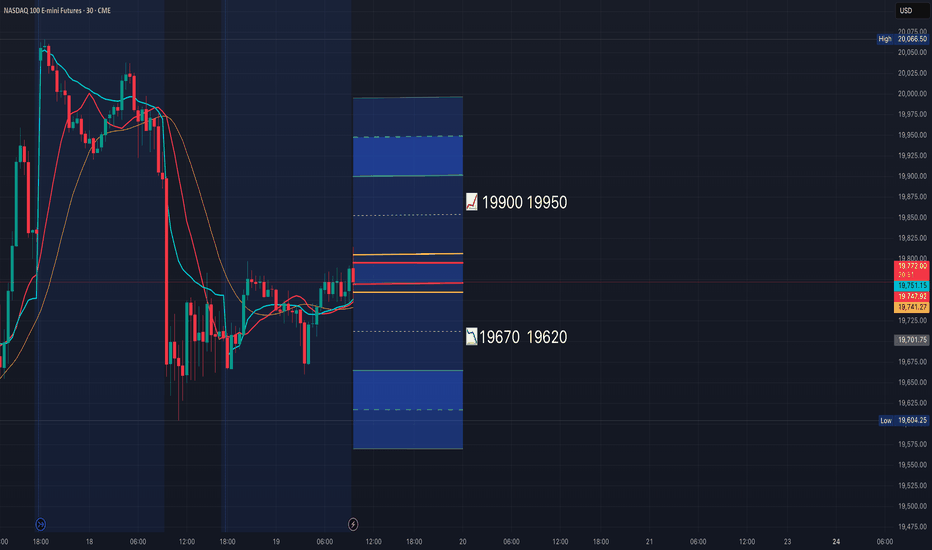
MNQ!/NQ1! Day Trade Plan for 03/19/2025MNQ!/NQ1! Day Trade Plan for 03/19/2025
📈19900 19950
📉19670 19620
Like and share for more daily NQ levels 🤓📈📉🎯💰
*These levels are derived from comprehensive backtesting and research and a quantitative system demonstrating high accuracy. This statistical foundation suggests that price movements are likely to exceed initial estimates.*
NASDAQ: 4H MA50 broke. Time for a full recovery.Nasdaq is still bearish on its 1D technical outlook (RSI = 39.669, MACD = -426.120, ADX = 56.837) but crossed above its 4H MA50. The last time a bearish wave of this Channel Down crossed above the 4H MA50 was on August 9th 2024. It was achieved again after an oversold 1D RSI bounce and initially hit the 0.786 Fibonacci level and then peaked on the 1.382 Fib extension. The trade is long, TP1 = 21,500 and TP2 = 23,400.
## If you like our free content follow our profile to get more daily ideas. ##
## Comments and likes are greatly appreciated. ##
MNQ!/NQ1! Day Trade Plan for 03/17/2025MNQ!/NQ1! Day Trade Plan for 03/17/2025
📈19850 19940
📉19670 19570
Like and share for more daily NQ levels 🤓📈📉🎯💰
*These levels are derived from comprehensive backtesting and research and a quantitative system demonstrating high accuracy. This statistical foundation suggests that price movements are likely to exceed initial estimates.*
NASDAQ Most critical 4H MA50 test in 7 months!Nasdaq (NDX) has been trading within a Channel Up since the July 11 2024 High. The price action since the February 18 2025 High was been the patterns Bearish Leg and like the August 05 2024 bottom on the Higher Lows trend-line, it was done on an oversold (<30.00) 1D RSI.
Now that the price has Double Bottomed and bounced, it came across today with a 4H MA50 (blue trend-line) test. 7 months ago it was that test and eventual break-out that initiated Nasdaq's 4-month non-stop rise. Initially once broken, the first target was just below the 0.786 Fibonacci retracement level.
As a result, you can get a confirmed buy signal once the index closes above the 4H MA50 and target 21450 (just below the 0.786 Fib).
-------------------------------------------------------------------------------
** Please LIKE 👍, FOLLOW ✅, SHARE 🙌 and COMMENT ✍ if you enjoy this idea! Also share your ideas and charts in the comments section below! This is best way to keep it relevant, support us, keep the content here free and allow the idea to reach as many people as possible. **
-------------------------------------------------------------------------------
💸💸💸💸💸💸
👇 👇 👇 👇 👇 👇
$NQ IdeaOn the monthly chart, NQ maintains its bullish structure, confirming an uptrend. However, in recent weeks, the price has undergone a correction, pulling back to an equilibrium zone before potentially resuming its predominant upward movement. We can see that the price is holding at the Mean Threshold of a monthly rejection block, while also forming an SMT on swing lows with ES and YM on the weekly chart.
Since we trade on an intraday basis, it is essential to analyze multiple timeframes to confirm our bias. On the weekly chart, last week's candle swept the previous week's low and closed below the range. However, given the presence of an SMT at the lows, it is unlikely that the price will target the PWL (Previous Week Low). Instead, a correction toward a discounted area on H4 could occur before the bullish movement begins.
This scenario makes sense because the H4 chart has engineered liquidity in a premium zone, and the price is still trading within that area. Furthermore, last week's shift in market structure confirmed a bullish bias on H4, but before resuming the uptrend, we might see a sell-off to clear liquidity, as the price remains in a premium zone on H4.
Based on the economic calendar, there is a possibility that the weekly low will be formed on Monday, creating an opportunity for a counter-trend trade early in the week. However, this setup carries high risk, requiring caution and confirmation before entry.
For this week, we are looking for bullish opportunities toward equilibrium or until the price encounters resistance to continue rising. However, this outlook will be adjusted as price action unfolds throughout the week.
It is also worth noting that this will be a challenging week, due to a lack of major economic news and an upcoming Federal Reserve speech on interest rates, which could significantly impact the market and increase volatility.
MNQ!/NQ1! Day Trade Plan for 03/14/2025MNQ!/NQ1! Day Trade Plan for 03/14/2025
📈19570 19660
📉19380 19285
Like and share for more daily NQ levels 🤓📈📉🎯💰
*These levels are derived from comprehensive backtesting and research and a quantitative system demonstrating high accuracy. This statistical foundation suggests that price movements are likely to exceed initial estimates.*
MNQ!/NQ1! Day Trade Plan for 03/13/2025MNQ!/NQ1! Day Trade Plan for 03/13/2025
📈19660 19760
📉19470 19380
Like and share for more daily NQ levels 🤓📈📉🎯💰
*These levels are derived from comprehensive backtesting and research and a quantitative system demonstrating high accuracy. This statistical foundation suggests that price movements are likely to exceed initial estimates.*
MNQ!/NQ1! Day Trade Plan for 03/12/2025MNQ!/NQ1! Day Trade Plan for 03/12/2025
📈19760 19850
📉19570 19475
Like and share for more daily NQ levels 🤓📈📉🎯💰
*These levels are derived from comprehensive backtesting and research and a quantitative system demonstrating high accuracy. This statistical foundation suggests that price movements are likely to exceed initial estimates.*


