BTC update!!Good day traders, here is another update on BTC and I have adjusted my narrative but my overall bias is still remaining bearish…
NASDAQ 100 E-MINI FUTURES

Buy OIL & GOLD, Sell Stocks Indices When Missiles Are Flying!In this Weekly Market Forecast, we will analyze the S&P 500, NASDAQ, DOW JONES, Gold and Silver futures, for the week of June 16-20th.
When missiles start flying in the Middle East, investors become reactively risk averse. Money goes from stocks to safe havens and oil. That's it. Expect oil prices to rise, Gold to reach new highs, and the equity markets to see more sellers than buyers.
This environment may last a few days or a few weeks. Keep an ear to the news.
Enjoy!
May profits be upon you.
Leave any questions or comments in the comment section.
I appreciate any feedback from my viewers!
Like and/or subscribe if you want more accurate analysis.
Thank you so much!
Disclaimer:
I do not provide personal investment advice and I am not a qualified licensed investment advisor.
All information found here, including any ideas, opinions, views, predictions, forecasts, commentaries, suggestions, expressed or implied herein, are for informational, entertainment or educational purposes only and should not be construed as personal investment advice. While the information provided is believed to be accurate, it may include errors or inaccuracies.
I will not and cannot be held liable for any actions you take as a result of anything you read here.
Conduct your own due diligence, or consult a licensed financial advisor or broker before making any and all investment decisions. Any investments, trades, speculations, or decisions made on the basis of any information found on this channel, expressed or implied herein, are committed at your own risk, financial or otherwise.

Nikkei 225. Tokyo Open Delivery cause of Geopolitical DriversSharing my Tokyo Open model for the daily expansion on Nikkei. Along with Intraday market profiles. And Quarterly Theory

Geopolitical Scenario. Market Outlook during London OpenCovering Gold Dax NQ and other assets with proper reasoning.

Emini Nasdaq 100. CPI. 11.06.2025, WednesdayExpecting major meltdown on the daily. The triad should melt from here on

Potential Head and Shoulders PatternHow to identify head and shoulders patterns?
We’ll use the current example from the Nasdaq or the US markets. We can quite clearly observe that a potential head and shoulders formation is developing. This means that if the price breaks below the neckline, we may see a deeper correction from the April low.
I will go through the rules on how to identify a head and shoulders formation.
We will also cover how to recognize when the pattern is invalid — meaning the market may continue pushing above its all-time high.
Finally, we’ll discuss how we can position ourselves early, before waiting for a break below the neckline for confirmation.
Let’s first go through the rules of identifying head and shoulders with rules stated.
Next, how to recognize when the pattern is invalid, the market continues pushing above its all-time high. The key is in the closing price above the all-time high.
Lastly, how we can position ourselves early, before waiting for a break below the neckline for confirmation.
Of course, we can wait for the break to come as a confirmation, but usually I would like to be a little more active than being passive. So this is just for your reference. It may not be for everyone.
This is where I always get into its micro view by first acknowledging where is the macro is, which we had just discussed. Please refer to the following video:
So what do you think that the market likely or unlikely to fulfill this head and shoulders set-up?
I’d like to hear your thoughts on this.
Micro Nikkei Futures
Ticker: MNQ
Minimum fluctuation:
0.25 index points = $0.50
Disclaimer:
• What presented here is not a recommendation, please consult your licensed broker.
• Our mission is to create lateral thinking skills for every investor and trader, knowing when to take a calculated risk with market uncertainty and a bolder risk when opportunity arises.
CME Real-time Market Data help identify trading set-ups in real-time and express my market views. If you have futures in your trading portfolio, you can check out on CME Group data plans available that suit your trading needs www.tradingview.com
Trading the Micro: www.cmegroup.com
www.cmegroup.com

Staircase seen in real chartsFor the most part OANDA:NAS100USD has exhibited a near perfect staircase up so far.
It does appear fairly extended right now, but with rotation out of safe havens into risk on assets again, what remains to be seen is how much fuel is in the tank, and how far can the tailwind take it.

NQ (Nasdaq) Futures Trading Levels [6/11/25]For Day Traders, here's some trading levels for NQ Futures Trading for today. It's CPI day, so we should get some nice swings today. Trade carefully and trade smart!

Mid-Week Outlook Update: US CPI- Trade TalksCPI day today. Scheduled to be released at 7:30 AM CT.
CME:6E1! CME_MINI:ES1! CME_MINI:NQ1! CME_MINI:MNQ1! CME_MINI:MES1! COMEX:GC1! CBOT:ZN1!
ES futures edged slightly higher after positive commentary from US-China trade talks. The delegations from both sides agreed on a framework to move forward with negotiations.
It is important to note that Trade War 1.0 took about two years to formalize and finalize. However, given the previous experience and the current agreement on the framework, our opinion (which is not the consensus) is that the trade deal between China and the US may be closer than what most analysts and investors might otherwise predict.
Like any negotiations, China and the US have previously discussed these difficult issues and have found a way to resolve them. Although the concerns have shifted towards niche sectors, we still view baseline tariffs with some sectors seeing increased tariffs as likely.
TACO (Trump Always Chickens Out) acronym traders will see a tougher stance from Trump to resolve the overarching trade deficit issue with China, particularly the dumping of Chinese goods.
AI, defense technology, chips, and rare earth minerals are at the center of these discussions. There will be targeted controls on exports of chips from the US and exports of rare earth minerals on the Chinese side, despite the current framework and deals agreed. In our view, these controls will be phased out until agreements are finalized, to maintain leverage and show TACO acronym backers that Trump is not “chickening out,” but rather maintaining a strong stance while negotiating trade deals with China and other countries.
In our analysis, despite positive headlines, the overhanging uncertainty has not dissipated. In fact, there is clarity that President Trump is willing to take the difficult road to negotiate from an apparent position of strength. Would this result in extension of trade deadlines or temporary increase in tariffs followed by an extension of deadlines? This remains to be seen!
If May CPI comes in lower than expectations, this will be a nudge in the direction that tariffs are not translating into higher inflation. We may see a rally in index futures.
On the contrary, any increase in CPI above the previous 2.3% YoY increase will be seen as tariff-induced inflation.
In our analysis, given lower energy prices, rent inflation stabilizing at levels last seen in late 2021, and services inflation in the US trending lower from the peak in January 2023, we are seeing embedded inflation in the prior two months and this may remain sticky in today’s release. However, any stability with lower energy prices seen in the prior month will point to a lower inflation print overall.
Comment with your favorite trade idea from our past trade ideas and what you would like to see more of.

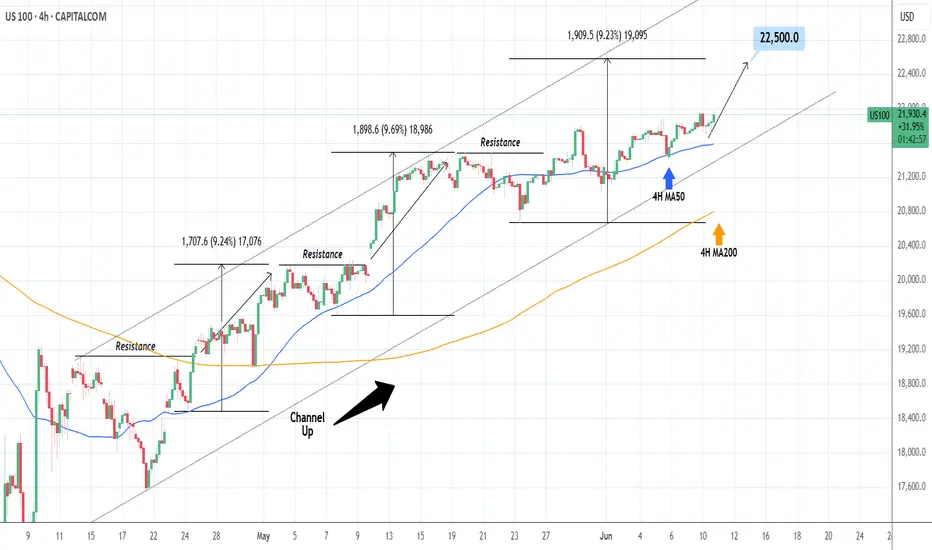
NASDAQ: Close to a strong bounce.Nasdaq is about to turn overbought on its 1D technical outlook (RSI = 68.736, MACD = 505.460, ADX = 18.046) as it is extending an uptrend since the 4H MA50 test/bounce. Such low paced price increase typically precedes strong breakouts. Since the long term pattern is a Channel Up, we are still on its 3rd bullish wave overall. The prior ones were +9.50% on avg, so we remain bullish on the short term, TP = 22,500.
## If you like our free content follow our profile to get more daily ideas. ##
## Comments and likes are greatly appreciated. ##
ES Futures-Weekly OutlookCME_MINI:ES1!
Fundamentals and Economic Calendar
Data Recap:
• Friday: 06/06/2025
o US Non-Farm Payrolls (May) 139k vs. Exp. 130k (Prev. 177k, Rev. 147k)
o US Unemployment Rate (May) 4.2% vs. Exp. 4.2% (Prev. 4.2%)
o US Average Earnings YY (May) 3.9% vs. Exp. 3.7% (Prev. 3.8%, Rev. 3.9%)
• Overnight Monday: 06/09/2025
o Chinese Trade Balance (USD)(May) 103.22B vs. Exp. 101.3B (Prev. 96.18B)
o Chinese Exports YY (USD)(May) 4.8% vs. Exp. 5.0% (Prev. 8.1%)
o Chinese Imports YY (USD)(May) -3.4% vs. Exp. -0.9% (Prev. -0.2%)
o Chinese CPI MM (May) -0.2% vs. Exp. -0.2% (Prev. 0.1%)
o Chinese PPI YY (May) -3.3% vs. Exp. -3.2% (Prev. -2.7%)
o Chinese CPI YY (May) -0.1% vs. Exp. -0.2% (Prev. -0.1%)
Looking ahead this week on the calendar, notable economic data releases are as follows:
• Wednesday: 06/11/2025
o US CPI YoY (May)
o US CPI MoM (May)
o US 10 year Note Auction
• Thursday: 06/12/2025
o US PPI MoM (May)
o US PPI YoY (May)
o US 30 year Bond Auction
• Friday: 06/13/2025
o Michigan Consumer Sentiment (Jun)P
o Michigan 1-year and 5-year Inflation Expectations (Jun)P
On the trade and tariff front, we have China-US trade talks continuing in the UK today. The Chinese Vice Premier is visiting the UK from June 8th-13th.
There has been progress made which is visible in terms of China relaxing export controls on rare earth minerals and President Trump stating that they are very far advanced on the China deal ahead of high level talks in London today.
The FED is in a blackout period until the FOMC meeting. Trade, tariffs, and geopolitical risks still need to be monitored.
Technical:
What has the market done?
With NQ leading, ES has also reclaimed yearly open. It held above yearly open in the overnight session.
What is it trying to do?
Climb higher, overlapping bars and yearly VPOC shifting higher denote acceptance at higher prices.
How good of a job is it doing?
Overlapping bars, headline risks and leveraged positions also point towards potential for prices moving lower before resuming higher or remaining range bound. TACO acronym traders may be in for max pain.
What is more likely to happen from here?
Given the data above, we would iterate given our previous explanation that recent data including CPI, PPI, Trade imports, exports is skewed due to trade tensions and this being reflected in business and consumer behavior. FED is likely to remain on hold while it waits and averages out the impact on growth, inflation and labor market.
Scenario 1: Push higher
Prices continue to push higher, if CPI comes in lower than expected, this may prompt a short-term continuation higher.
Scenario 2: Range bound
Markets remain in wait and see mode this week having climbed above yearly open. Markets build value higher and we expect VPOC to shift higher too.
Scenario 3: Sell-off
A mix of factors could e.g., trade talks stalling, weaker than expected US 10 year and 30 year auctions could foreshadow cracks appearing in the bonds market. This may fuel a wider sell-off if yields climb back higher.
Glossary:
ES - emini-S&P 500 Futures
NQ - emini-NASDAQ 100 Futures
VPOC - Volume Point of Control: The most traded price by volume in a given range. Represents acceptance or consensus

NASDAQ Initiated a standard short-term Bull Cycle.Nasdaq (NDX) has been trading within a Channel Up ever since the November 2008 bottom of the U.S. Housing Crisis. The recent Trade War correction that started early this year, bottomed just before the 1W MA200 (orange trend-line) and rebounded.
As this chart shows, every break below the 1W MA50 (blue trend-line) has technically started a new Cycle. During this 16-year pattern, we have seen two types of Cycles, a short (blue Rectangle) and long (green Rectangle).
Based on the sequence since the start of the Channel Up, the index should have now just initiated its new short Cycle. Both previous ones peaked on the 1.786 Fibonacci extension before a correction below the 1W MA50 again. As a result, we expect to see 28000 at least before the next meaningful technical correction.
-------------------------------------------------------------------------------
** Please LIKE 👍, FOLLOW ✅, SHARE 🙌 and COMMENT ✍ if you enjoy this idea! Also share your ideas and charts in the comments section below! This is best way to keep it relevant, support us, keep the content here free and allow the idea to reach as many people as possible. **
-------------------------------------------------------------------------------
💸💸💸💸💸💸
👇 👇 👇 👇 👇 👇

Weekly Market Forecast: BUY Stock Indices & Oil! Sell Gold! In this Weekly Market Forecast, we will analyze the S&P 500, NASDAQ, DOW JONES, Gold and Silver futures, for the week of June 9 - 13th.
Stock Indices are looking more bullish. Valid buys only!
Gold is weak. Sells only until there is a market structure shift upwards.
Oil prices have room to go higher. Buy it.
Silver is a wait and see. Should start to pull back this week, as it closed last week stronger than Gold.
CPI Wednesday. After the news is announced, the market should be very tradeable for the rest of the week.
Enjoy!
May profits be upon you.
Leave any questions or comments in the comment section.
I appreciate any feedback from my viewers!
Like and/or subscribe if you want more accurate analysis.
Thank you so much!
Disclaimer:
I do not provide personal investment advice and I am not a qualified licensed investment advisor.
All information found here, including any ideas, opinions, views, predictions, forecasts, commentaries, suggestions, expressed or implied herein, are for informational, entertainment or educational purposes only and should not be construed as personal investment advice. While the information provided is believed to be accurate, it may include errors or inaccuracies.
I will not and cannot be held liable for any actions you take as a result of anything you read here.
Conduct your own due diligence, or consult a licensed financial advisor or broker before making any and all investment decisions. Any investments, trades, speculations, or decisions made on the basis of any information found on this channel, expressed or implied herein, are committed at your own risk, financial or otherwise.

Emini Nasdaq 100 Weekly Outlook and Walkthrough. Outlined the orderflow and my thought process on Daily profiles and expansion days. Marked out my thought process. And how I would execute in that very specific moment. One of my best examples. Go ahead check it out.

TSLA Backtest: A robo-taxi launchpad? TBD ... 𝗧𝗲𝘀𝗹𝗮 𝗕𝗮𝗰𝗸𝘁𝗲𝘀𝘁: A robo-taxi launchpad? 🤖🚗
After a 20%+ breakout, NASDAQ:TSLA is retesting its 200dma with $295–300 now key support. Hold that — and bulls have room to run to $400+.
𝘉𝘶𝘭𝘭𝘪𝘴𝘩 𝘴𝘦𝘵𝘶𝘱 𝘸𝘪𝘵𝘩 𝘢 𝘥𝘢𝘵𝘦: June 12 robo-taxi reveal in Austin could mark Tesla’s first real step toward autonomous ride-hailing at scale.
𝘏𝘪𝘨𝘩 𝘱𝘳𝘪𝘤𝘦, 𝘩𝘪𝘨𝘩 𝘩𝘰𝘱𝘦𝘴: Tesla's valuation has always priced in the future. This time, the future might show up in a self-driving Model Y.
$NQ_F NASDAQ:NDX NASDAQ:QQQ NASDAQ:NVDA NASDAQ:AAPL AMEX:SPY NASDAQ:SOX CBOE:ARKK #Tesla #Robotaxi #FSD #ElonMusk #Stocks

ES Trade Idea and Upcoming NFP ReportCME_MINI:ES1!
• What has the market done?
ES futures are lagging compared to tech heavy index NQ futures. ES futures are still below yearly open. Yearly open has been a strong area of resistance since the rally of April 6th Lows in futures complex.
• What is it trying to do?
ES futures are in consolidation mode, building value higher. VPOC has shifted higher since the gap up from May 11th open. VPOC and 0.786 fib level provide a base for a continuation higher.
• How good of a job is it doing?
Markets seem to be slowing its rally. After such a strong rebound, participants are wary of any pull-backs. Although a strong trend higher, consolidation or a pullback is not illogical at these levels.
• What is more likely to happen from here?
o Scenario 1: Hold steady and NFP provides needed boost for markets to get across yearly open resistance and climb higher.
o Scenario 2: A mixed NFP report may point towards further consolidation. Key level 5873 as support on move lower before reverting higher.
o Scenario 3: A hawkish NFP report that signals higher for longer rates, may be interpreted by market participants as less monetary stimulus and dwindling rate cut bets for this year. We anticipate a sell-off towards 0.618 fib level in this scenario, moving to the lower edge of micro composite volume profile.
In all the above scenarios, there is a clear LIS at yearly open. Other key levels are defined cleanly on the higher time frame. Important thing for traders to note here is to trade what you see and not what you think. Having an alignment between fundamentals and technicals is sound but the markets do what they do, and price moves where it should. Painting narrative to any move may sound fancy but it gets less important at intraday time frames in our opinion. Hence why we view all this considering auction markets and volume profile.
Glossary:
ES - emini-S&P 500 Futures
NQ - emini-NASDAQ 100 Futures
VPOC - Volume Point of Control: The most traded price by volume in a given range. Represents acceptance or consensus
NFP - Non-Farm Payroll: Released by the US Department of Labor around the 1st Friday of every month. It reports on Unemployment, Productivity and other key metrics. Key economic release
LIS - Line In the Sand: A key zone that might tip buyers or sellers to act to cover risk and might change the overall bias of our analysis

Volume Speaks Louder: My Custom Volume Indicator for Futures
My Indicator Philosophy: Think Complex, Model Simple
In my first “Modeling 101” class as an undergrad, I learned a mantra that’s stuck with me ever since: “Think complex, but model simple.” In other words, you can imagine all the complexities of a system, but your actual model doesn’t have to be a giant non-convex, nonlinear neural network or LLM—sometimes a straightforward, rule-based approach is all you need.
With that principle in mind, and given my passion for trading, I set out to invent an indicator that was both unique and useful. I knew countless indicators already existed, each reflecting its creator’s priorities—but none captured my goal: seeing what traders themselves are thinking in real time . After all, news is one driver of the market, but you can’t control or predict news. What you can observe is how traders react—especially intraday—so I wanted a simple way to gauge that reaction.
Why intraday volume ? Most retail traders (myself included) focus on shorter timeframes. When they decide to jump into a trade, they’re thinking within the boundaries of a single trading day. They rarely carry yesterday’s logic into today—everything “resets” overnight. If I wanted to see what intraday traders were thinking, I needed something that also resets daily. Price alone didn’t do it, because price continuously moves and never truly “starts over” each morning. Volume, however, does reset at the close. And volume behaves like buying/selling pressure—except that raw volume numbers are always positive, so they don’t tell you who is winning: buyers or sellers?
To turn volume into a “signed” metric, I simply use the candle’s color as a sign function. In Pine Script, that looks like:
isGreenBar = close >= open
isRedBar = close < open
if (not na(priceAtStartHour))
summedVolume += isGreenBar ? volume : -volume
This way, green candles add volume and red candles subtract volume, giving me positive values when buying pressure dominates and negative values when selling pressure dominates. By summing those signed volumes throughout the day, I get a single metric—let’s call it SummedVolume—that truly reflects intraday sentiment.
Because I focus on futures markets (which have a session close at 18:00 ET), SummedVolume needs to reset exactly at session close. In Pine, that reset is as simple as:
if (isStartOfSession())
priceAtStartHour := close
summedVolume := 0.0
Once that bar (6 PM ET) appears, everything zeroes out and a fresh count begins.
SummedVolume isn’t just descriptive—it generates actionable signals. When SummedVolume rises above a user-defined Long Threshold, that suggests intraday buying pressure is strong enough to consider a long entry. Conversely, when SummedVolume falls below a Short Threshold, that points to below-the-surface selling pressure, flagging a potential short. You can fine-tune those thresholds however you like, but the core idea remains:
• Positive SummedVolume ⇒ net buying pressure (bullish)
• Negative SummedVolume ⇒ net selling pressure (bearish)
Why do I think it works: Retail/intraday traders think in discrete days. They reset their mindset at the close. Volume naturally resets at session close, so by signing volume with candle color, I capture whether intraday participants are predominantly buying or selling—right now.
Once again: “Think complex, model simple.” My Daily Volume Delta (DVD) indicator may look deceptively simple, but five years of backtesting have proven its edge. It’s a standalone gauge of intraday sentiment, and it can easily be combined with other signals—moving averages, volatility bands, whatever you like—to amplify your strategy. So if you want a fresh lens on intraday momentum, give SummedVolume a try.

NASDAQ: Initiated bullish wave to 22,150.Nasdaq remains heavily bullish on its 1D technical outlook (RSI = 67.266, MACD = 427.500, ADX = 25.384) and just formed a 4H MACD Bullish Cross. This validates the extension of the current Bullish Wave, second inside the short term Channel Up. We anticipate again a +5.40% rise, TP = 22,150.
## If you like our free content follow our profile to get more daily ideas. ##
## Comments and likes are greatly appreciated. ##

Macro Outlook: Trade War Jitters, Deficit, NFP FridayAlthough there is a headline fatigue and markets have been stabilizing with the worst of trade war story behind us, the fact is that uncertainty still looms. President Trump announced over the weekend that he will double down on US steel and aluminum tariffs from 25% to 50% effective June 4th.
Highlight this week is US Jobs data this Friday. A key point to determine the resilience of the US labor market. With FED Chair Powell speaking today and FED speakers scheduled throughout the week, it will be key to watch how they shape markets' probability of rate cuts?
As we previously explained, ongoing uncertainty and dragging trade concerns present more risks until resolved. Here are some key points to consider:
It remains to be seen whether the trade deficit will continue to worsen or begin to reverse. April trade data, along with any policy shifts such as a reversal on reciprocal tariffs, will be important to monitor. These indicators will provide insight into how businesses are interpreting ongoing trade uncertainty. The key question is whether they will continue front-loading inventory in anticipation of future disruptions, or if the focus will shift toward restructuring supply chains and reining in spending as part of a longer-term strategic adjustment.
At the same time, consumer spending remains resilient, supporting overall demand. However, pressure may be building on business balance sheets, particularly businesses with poor cash flow to manage front loading inventory spending as the trade environment remains volatile. If consumer spending begins to weaken, businesses may be forced to cut costs, scale back investment, or offer steep discounts to clear excess inventory. This could lead to a cycle of margin compression, especially if firms attempt to pass higher costs onto price-sensitive consumers, potentially suppressing demand further.
Conversely, if businesses choose to absorb rising costs to maintain competitive pricing, they face deteriorating margins but may be betting on continued strength in consumer credit, household savings buffers as evident. Consumer confidence, despite being low, is not an accurate indicator in times of uncertainty. Here, we should watch what consumers do and not the sentiment.
In this scenario, firms may delay cost-cutting in the hope that continued strength in consumer spending will support revenues through the rest of the year.
A central tension remains: businesses must navigate a delicate balance between protecting margins and preserving demand. Meanwhile, persistent trade uncertainty and tighter financial conditions may slow capital investment and hiring, further complicating the outlook. Whether firms shift from defensive postures like front-loading toward long-term structural changes in supply chains will hinge on how durable current consumer strength proves to be and how responsive trade policy becomes in the months ahead.
Ongoing front-loading has caused ripples as the trade deficit has further widened. Will this reverse as businesses focus on sales and revenue instead of front-loading inventory?
In our analysis, trade imports, trade balance, consumer spending and corporate profits will be key to monitor despite being lagging indicators.
On the other hand, equally important to watch and monitor goods exports, durable goods to assess and evaluate the other side of the equation.
However, our focus is on imports as manufacturing jobs are at their lowest in US history.
Once the dust has settled and trade deals are locked in, it will be important to note if Exports by Country experience any significant shifts.
What does all this mean for the stock market and futures? In simple terms, the yearly pivot and last month’s high is a major resistance area for index futures. Until this is cleared, we may see a range bound market and two way trade. There is a lot of weak structure to revisit lower. Markets may perhaps retest this before resuming higher. What we would want to see is, last month’s low holding support and this month’s price action trading inside previous month’s range or resuming higher.
If we revisit May Monthly Lows, we may see increased selling pressure come in.

Weekly Market Forecast: Monday UPDATES!How accurate were the forecasts for S&P 500, NASDAQ, DOW JONES, Gold and Silver futures given in the Weekly Market Forecast for this week?
BULLSEYE!
Enjoy!
May profits be upon you.
Leave any questions or comments in the comment section.
I appreciate any feedback from my viewers!
Like and/or subscribe if you want more accurate analysis.
Thank you so much!
Disclaimer:
I do not provide personal investment advice and I am not a qualified licensed investment advisor.
All information found here, including any ideas, opinions, views, predictions, forecasts, commentaries, suggestions, expressed or implied herein, are for informational, entertainment or educational purposes only and should not be construed as personal investment advice. While the information provided is believed to be accurate, it may include errors or inaccuracies.
I will not and cannot be held liable for any actions you take as a result of anything you read here.
Conduct your own due diligence, or consult a licensed financial advisor or broker before making any and all investment decisions. Any investments, trades, speculations, or decisions made on the basis of any information found on this channel, expressed or implied herein, are committed at your own risk, financial or otherwise.

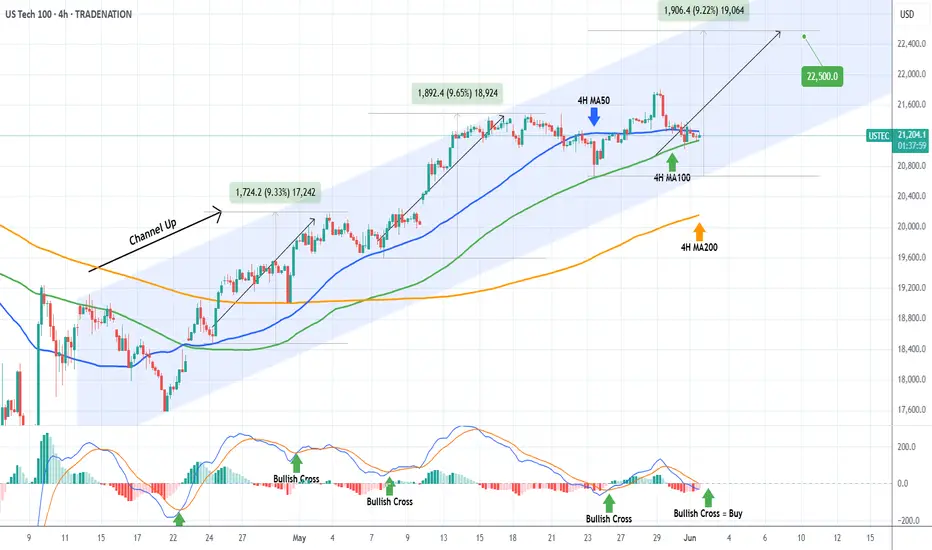
NASDAQ Will the 4H MA100 come to the rescue?Nasdaq (NDX) is trading within a 3-week Channel Up, which is currently supported by the 4H MA100 (green trend-line). In fact, the price is being squeezed in the last three 4H candles within the 4H MA100 and the 4H MA50 (blue trend-line).
This tight compression technically tends to cause violent break-outs either way. As long as the Channel Up holds, we expect that to be upwards and it should be confirmed by the formation of a 4H MACD Bullish Cross.
With the last two major rallies being around +9.50%, we expect to see 22500 on the next Leg Up.
-------------------------------------------------------------------------------
** Please LIKE 👍, FOLLOW ✅, SHARE 🙌 and COMMENT ✍ if you enjoy this idea! Also share your ideas and charts in the comments section below! This is best way to keep it relevant, support us, keep the content here free and allow the idea to reach as many people as possible. **
-------------------------------------------------------------------------------
Disclosure: I am part of Trade Nation's Influencer program and receive a monthly fee for using their TradingView charts in my analysis.
💸💸💸💸💸💸
👇 👇 👇 👇 👇 👇
25.06.02 nasdaq analysis📊
📌 Friday Price Action Summary
Failed to break above the black resistance box
Repeated rejection at the zone strengthened downward pressure
As long as this zone remains unbroken, bearish bias remains
📉
Price has entered the bullish candle from May 27
If that candle breaks to the downside, a drop toward the 20EMA on the daily chart (20,930p) is likely
Currently seeing low volume and range-bound movement, so trend direction needs confirmation
🔍
If the European session fails to sustain the rebound, it will likely be a temporary move
A break below 21,218p + trendline break would confirm a short setup
🎯 Targets (TP):
TP1: 21,071p (Friday’s low)
TP2: 20,930p (Daily 20EMA)
📌 Strategic Conclusion
Bias: Bearish
However, due to declining volume and range-bound action,
→ It’s better to wait for confirmation before entering
If bearish entry conditions are met, execute with confidence

Weekly Market Forecast: Stocks, Gold, Silver & Crude OilIn this Weekly Market Forecast, we will analyze the S&P 500, NASDAQ, DOW JONES, Gold and Silver futures, for the week of June 2 - 6th.
Stock Indices are looking more bullish than bearish. Valid buys only!
Gold is moving sideways. Wait for confirmation before a buy/sell signal.
Oil prices may tick lower. Trade carefully.
Enjoy!
May profits be upon you.
Leave any questions or comments in the comment section.
I appreciate any feedback from my viewers!
Like and/or subscribe if you want more accurate analysis.
Thank you so much!
Disclaimer:
I do not provide personal investment advice and I am not a qualified licensed investment advisor.
All information found here, including any ideas, opinions, views, predictions, forecasts, commentaries, suggestions, expressed or implied herein, are for informational, entertainment or educational purposes only and should not be construed as personal investment advice. While the information provided is believed to be accurate, it may include errors or inaccuracies.
I will not and cannot be held liable for any actions you take as a result of anything you read here.
Conduct your own due diligence, or consult a licensed financial advisor or broker before making any and all investment decisions. Any investments, trades, speculations, or decisions made on the basis of any information found on this channel, expressed or implied herein, are committed at your own risk, financial or otherwise.
