13 Oct Levels with POILevels I am watching for Friday- shown with daily FVG to be more clear about points of interest.
Dashed Black line is the 50% line of yesterdays move, denoting premium and discount.
Black heavy lines are yesterday's H/L
It is yet to be seen if the final October low is in.
It is possible to have slightly more expansion, with a deeper retracement beginning next week
or we could retrace tomorrow for a new lower low.
For intraday trading this does not matter as much. keep your eyes on strong points of interest such as weekly and daily FVG's, previous Days H/L
As always, we trade during specific times only.
happy trading!
have a great weekend!
NASDAQ 100 E-MINI FUTURES

𝗡𝗮𝘀𝗱𝗮𝗾 𝗨𝗽𝗱𝗮𝘁𝗲: $QQQ Daily. Keep it simple𝗡𝗮𝘀𝗱𝗮𝗾 𝗨𝗽𝗱𝗮𝘁𝗲: NASDAQ:QQQ Daily. Keep it simple. Above line-in-sand ("LIS") of 373 a bull flag 🐂 breakout. Below risk lower to consolidate 🐻
$NQ_F TVC:NDQ NASDAQ:AAPL NASDAQ:MSFT NASDAQ:AMZN NASDAQ:META NASDAQ:GOOG NASDAQ:TSLA NASDAQ:NVDA NASDAQ:SOX $ES_F AMEX:SPY SP:SPX TVC:DXY NASDAQ:TLT TVC:TNX CBOE:VIX #Stocks

Nsdaq Cycle www.tradingview.com
The Nasdaq has reached the end of the uptrend, it is starting his bearish cycle at the price of 15448.

Nasdaq: Taken off 🚀The Nasdaq has now rallied strongly and has left its green target zone between 15 292 and 14 431 points. The next target is now the resistance at 16 062 points and a further rise to around 17 500 points, where we expect the high of the orange wave i. It is important to note, however, that it is also possible that the high was already set in July. This alternative scenario, to which we assign a 40% probability, would come into play in the event of a drop below the zone. The low of the orange wave alt.ii would then have to be in the orange target zone between 13 934 and 12 717 points.

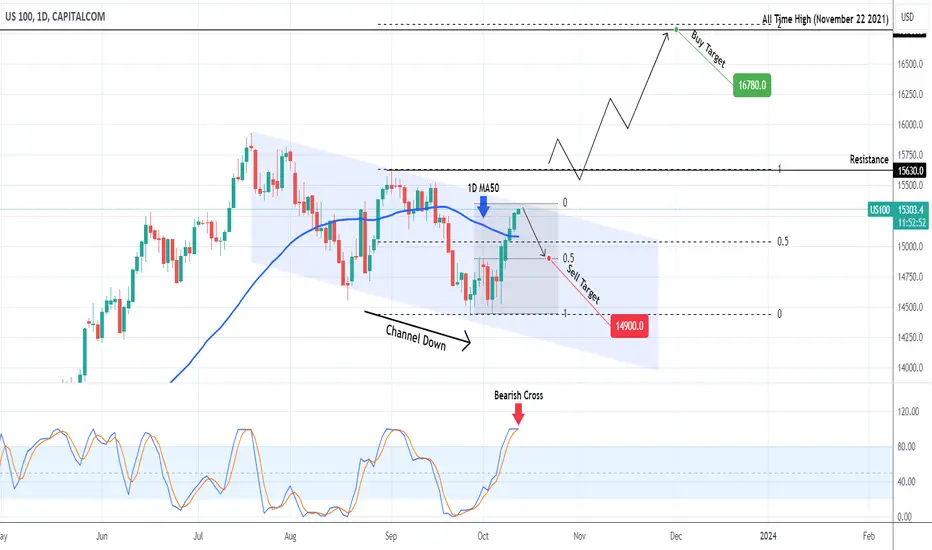
NASDAQ Channel Down or Bullish Flag?Nasdaq (NDX) broke above the 1D MA50 (blue trend-line) and has almost reached the top (Lower Highs trend-line) of the Channel Down pattern that started after the July 19 High. The 1D STOCH RSI Bearish Cross suggests that this is a sell opportunity on the short-term at least, towards 14900 (0.5 Fibonacci retracement level).
But what if this is not a Channel Down but a Bullish Flag pattern after a relentless 2023 price growth? In that case we will need to wait for confirmation in the form of a break-out above the last Lower High (and current Resistance level) at 15630. After that, we will buy the first pull-back below it and target the 16780 All Time High of November 2021, which interestingly enough is only a fraction below the 2.0 Fibonacci extension, a standard technical target in case of Bullish Flag break-outs.
-------------------------------------------------------------------------------
** Please LIKE 👍, FOLLOW ✅, SHARE 🙌 and COMMENT ✍ if you enjoy this idea! Also share your ideas and charts in the comments section below! This is best way to keep it relevant, support us, keep the content here free and allow the idea to reach as many people as possible. **
-------------------------------------------------------------------------------
💸💸💸💸💸💸
👇 👇 👇 👇 👇 👇
NQ1! Supply and Demand Levels 10/10-10/11Link to chart: www.tradingview.com
Last week, our EOW targets were easily and beautifully hit. Great work team!
Crazy bull run that I was expecting to fill later this week, but it has done just that. We pushed close to our 3HR supply, and with this insane volatile news week, looking for this push into this area for either rejection or continuation.
With war, and more specifically the recent events from Russia v. Ukraine, you can see we had a few days of red before we ripped to the upside. I was looking for the same possible idea to play again for Israel v. Pakistan. I wish and pray for peace amongst us all, and to stop the pain that we share to each other.
For EOW Targets:
BULLS: 15470-15525, this would mean a push to 4HR R2 above and taking those heavy orders that lie within the 45m/1hr/3hr zone.
BEARS: 14953-15010, break of this (blue) trendline and a retracement of this impulsive move.

NASDAQ Short term Resistance sell but buy if 15520 breaks.Nasdaq / US100 is about to hit our second target (chart at the end) as it is approaching the Falling Resistance.
Our strategy was purely based on the identical patterns of July-August and September-October.
The index is close to a 4hour MA50-100 Bullish Cross, signalling the end of this uptrend.
We estimate a peak no more than 15350. If accompanied by a 4hour MACD Bearish Cross, sell and target 15050 on the short term (course of 4hour MA50).
If though the price crosses above Resistance A (15520), wait for a MA50 pull back and buy targeting 15930 (Resistance B).
Previous chart:
Follow us, like the idea and leave a comment below!!

NASDAQ Short. lets take some of that gap backICT Price Action:
Entry at resistance gap
Stop loss at 100% gap filled
Take profit at confluence of 50% opening gap with bull gap

Trading game plan for 10th October 2023Hey Guys, i have posted and discussed the game plan for tomorrow and also some important levels and my reasoning behind these. Let me know if this makes sense and resonates with you all.

Day Trade Market Condition oct 09, 2023 Happy ThanksgivingDay Trade Market Condition oct 09, 2023
levels for NQ ES CL BTC
watch the table left side for trade, right side for trend
I hope this message finds you all well. I wanted to take a moment to express my heartfelt gratitude to each and every one of you who has supported and engaged with my trading ideas and posts here on TradingView.
Your views, comments, and feedback have been incredibly motivating and encouraging. It's truly inspiring to be part of such a dynamic and knowledgeable community of traders and investors.
However, I must also humbly acknowledge that I am aware of my current limitations when it comes to trading. While I am passionate about the world of trading and investing, I understand that I may not possess the qualifications and expertise that many of you do.
I want to be transparent about where I stand in my trading journey. I am constantly learning and growing, and I fully recognize that there is always room for improvement. My commitment to you, my fellow TradingView members, is that I am dedicated to honing my skills and expanding my knowledge in the field of trading.
I may not have all the answers right now, but I firmly believe that with time, dedication, and the support of this amazing community, I can improve and provide more valuable insights and ideas in the future.
In the meantime, I will continue to update my blog occasionally to share my experiences, insights, and progress in the world of trading. I hope you'll join me on this journey of growth and exploration.
Once again, thank you from the bottom of my heart for your support and encouragement. Your engagement means the world to me, and it drives me to become a better trader and contributor to this wonderful community.
Wishing you all success and prosperity in your trading endeavors.

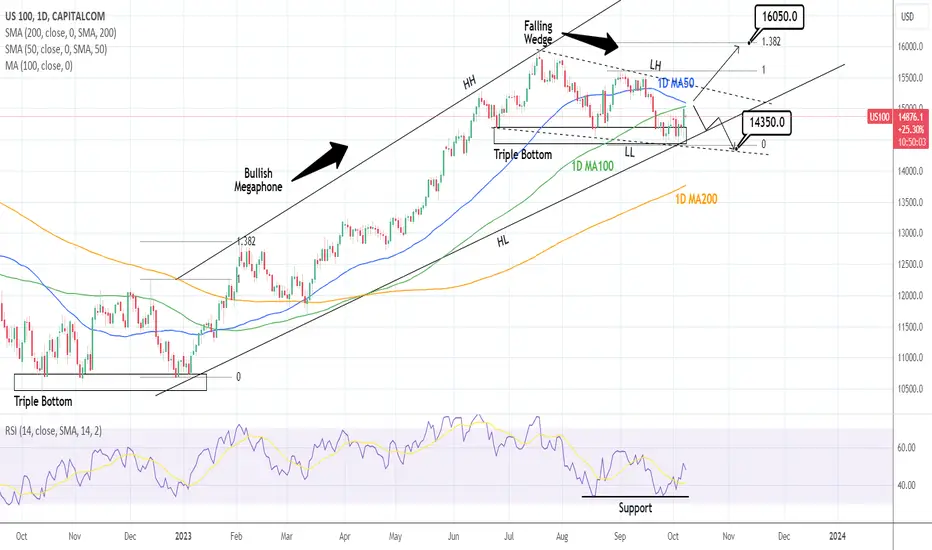
NASDAQ: Will it reverse to Bull or downtrend will make a new LowNasdaq is on two conflicting patterns on the short and long term. The Bullish Megaphone that drove it out of the Bear Cycle after the late 2022 Triple Bottom is still holding and closed last week with an emphatic rebound but at the same time so is the short term Falling Wedge that started the correction on the July 19th High. This conflict and medium term balance is why the 1D technical outlook is neutral (RSI = 48.115, MACD = -63.170, ADX = 38.959).
The 1D RSI may have held August's Support and we could have a Triple Bottom since June, not much different than the late 2022, but it is the 1D MA100 that will make all the difference. A two 1D candle close over it, will amplify the probabilities for a break of the Falling Wedge and long term bullish reversal, in which case we will target the 1.382 Fibonacci extension (TP = 16,050). If we don't see such 1D MA100 closing pattern, we will stay bearish, gradually aiming for the 1D MA200 (TP = 14,350).
## If you like our free content follow our profile to get more daily ideas. ##
## Comments and likes are greatly appreciated. ##
NQ1! Bearish ForecastAfter the very high non farm payroll data but slowing wage growth as well as the unemployment rate which is still in stable numbers, the increase at the end of last week showed that investors considered good economic conditions.
apart from fundamentals, from the technical perspectives a bullish candle was formed at the weekend, but by looking at these two aspects in addition to geopolitical conditions, oil, gold, Yield, Dxy and also after looking at the volume profile indicator I speculate that there will be a reversal and will break the channel

RUT/NDX ratio tells you to keep investing in tech!Something a little different today.
Was looking a some stock ratios and decided to regress the standard Russell 2000 against the risky technology index, the Nasdaq.
This RUT/NDX ratio has been inside a Channel Down since the Dotcom Bubble send it sky high, collapsing the tech sector.
The Channel Down has never been broken since and made a new Low this month.
What does this tell you? Keep investing in tech!
Follow us, like the idea and leave a comment below!!

NASDAQ Wait for the right sell entry at the top of the Wedge.Nasdaq is rising after the price found Support at the bottom of the Falling Wedge.
It is approaching the MA200 (4h) but the technical Resistance is inside the 0.618 Fibonacci level and the Falling Resistance.
Trading Plan:
1. Sell at 15170 (Fibonacci 0.618).
Targets:
1. 14900 (pull back to the MA50 4h).
Tips:
1. Only a crossing over Resistance (1) can restore the bullish trend. Until then the index may even turn sideways inside a Rectangle for a while.
Please like, follow and comment!!
Notes:
Past trading plan:

NQ | Neutral Intraday Bias on M15Remaining neutral for the night, NFP is in the morning. However, looking at a potential liquidity sweep during London Session. If the Sellside is taken into the Fair Value Gap, I will look to enter on the m1 if a Market Structure Shift occurs. Target will be the M15 Buyside liquidity.

NASDAQ Reality will soon hit those who bet against the market.Nasdaq (NDX) has been on a 3-month correction since its July High. No need to mention that this High almost touched its All Time High (ATH), almost recovering in less than 1 year the value lost in the Bear Cycle.
** 2010 Higher Lows and Megaphone **
The Higher Lows (dashed) trendline that has been in place since 2010 after the recovery from the 2008 - 2009 Housing Crisis started, held during the 2022 Inflation Bear Market and gave way to a Channel Up. We can claim that since mid-2018 the market entered into a Bullish Megaphone pattern and such Channel Up formations have been the common vessels to a Higher High.
** Uncertainty/ Doubt / Disbelief **
Similarly common have been minor (on a 1W scale) corrections such as the pull-back we are witnessing since July. During market uptrends, those are called 'Bull Flags'. Especially in the beginning of the recovery those are met with Uncertainty/ Doubt / Disbelief. For that reason the majority doesn't get in on the trend until it is well underway. Even the 1W RSI shows how consistent this Symmetrical Support Zone has been throughout all those Channels. Even the Higher Lows trend-line from May 2022 is still holding.
** First Bullish Cross since 2010 **
On top of all the above, Nasdaq is about to completed a 1W MA50 (blue trend-line)/ 1W MA100 (green trend-line) Bullish Cross, the first since February 2010 (which as mentioned is post Housing Crisis). The price will enter next week into green Ichimoku territory, which when formed indicates significant upside potential on a well establish bull trend.
We expect this to be the end of the 3-month correction and the resume of the uptrend. Based on the previous runs, NDX is aiming at 17800 towards the Christmas rally and 21500 in Q3 2024.
-------------------------------------------------------------------------------
** Please LIKE 👍, FOLLOW ✅, SHARE 🙌 and COMMENT ✍ if you enjoy this idea! Also share your ideas and charts in the comments section below! This is best way to keep it relevant, support us, keep the content here free and allow the idea to reach as many people as possible. **
-------------------------------------------------------------------------------
💸💸💸💸💸💸
👇 👇 👇 👇 👇 👇

NQ | Liquidity Sweep | ShortWaiting for the arrival of Buyside Liquidity to be taken, then on the m1, look for displacement in the opposing direction (Short). Ideally, this would setup a Fair Value Gap when it displaces, which I will use for entry.
Im overall short on NQ and anticipate that when the buyside is taken as liquidity (during London Session), it may also create the high of the day, continuing short in New York Session.
www.tradingview.com

Important Ranges for 6th October 2023Nasdaq Futures are range-bound. We have a Non-Farm payroll report coming in tomorrow. My bias is on the upside for tomorrow. Lets see what happens. Either ways we have to be ready for both sides which ever way the markets digest the data. Do not trade for the first hour for tomorrow since it will be volatile.

Forget Soft, Hard Or No Landing, Higher For Longer...Is the Stock Market Dead Money For The Next 10-20 Years?
So much of how our markets work is based on optimism. Can you imagine being a money manager and your entire sales pitch is some negative diatribe about how the market is going down and will continue to go down?
Would you fork over your hard-earned savings based on such a story? Not a successful plan of attack for a person trying to raise capital if you ask me.
However, therein lies the disconnect between what is really going on in today’s market, versus what the average person reads and hears in the financial news. The same optimistic money managers sponsor those articles or those TV shows. Would your business buy an ad on a show or in a magazine that constantly gave a negative outlook on your business?
I’ve always considered myself an optimist. However, nowadays, I find nothing to be optimistic about with respect to the US stock markets. The reason is, my prevailing analytical thesis is, the markets are now entering a long-term cycle in which many aspects of our economy will be reverting to their respective long-term mean. From interest rates, to income inequality. This time frame, I refer to, is meant to be a reset in expectations. If I am correct in my analysis, this will unfold over a long period of time. During this period, many of old correlations and metrics used to determine the value of the stock market, assets in general, (housing, for example) will break down and end up becoming less useful to those who fundamentally analyze assets, stocks and the markets for a living. The cycle I am referring to is one in which none of the current market participants have experienced. Now before you draw a hasty conclusion, and think this article is about me warning you, the reader, a 1987 stock market crash scenario is on the horizon, I’ll caution you. It is not.
However, my analysis shows that the market will essentially become dead money for at least the next decade or two. That means buying most market-based asset classes, and holding them, will not produce the desired results of the past.
Please indulge me while I provide some background and explain.
I practice a form of market analysis that is exclusively focused on price action. I guess you could sum up my work by styling me as a pattern analyst. That means stock market news, events, corporate earnings and all external data is of little concern to me as I carry out my day-to-day analysis on the SP500. I never take those external events into account while analyzing any of the markets I cover. I watch the patterns market participants create with their buys and sells. I study those patterns across the many markets I cover and over both the short and extremely long periods of time. One could say I took my mother’s advice to heart, and watch what they do, not what they say. It’s the law large crowds, and the larger the crowd, the more accurate the forecast. The SP500 contains one of the largest crowds assembled. Each day it involves millions of participants, exchanging large volumes of assets for vast sums of money. Suffice to say, my work can produce some scary accurate forecasts based on the participation of the crowds in those markets.
A final anecdote to explain my work lies in a simple experiment I observed some time ago on YouTube. To illustrate the power of large crowds, a YouTuber decides to conduct an experiment. The individual fills a large mason jar with marbles. The half gallon sized mason jar is now brimming with marbles, and the metal lid is twisted on, sealing the jar. The individual then attends a local carnival and sets up a booth to solicit guesses as to the total amount of marbles contained in the mason jar. Volunteers are asked to simply observe the jar, and write down their guesses on a post-it-note. After collecting a large number of post-it-notes, the guesses are entered into a spreadsheet. Next, the marbles are emptied on a carpet and counted. 1340 marbles. Comparing the spreadsheet data, the conclusion was, although some volunteers came close in guessing the correct number of marbles, no one guessed correctly. Guesses ranged from as low as 300 to as high as 3,000. A seemingly random data set. However, under further examination, the average of the total guesses were 1335 marbles. This simple experiment explains the legitimacy of some sort of “inexplicable collective consciences” when involving a large crowd.
My current bearish perspective manifests itself in this same notion of the large crowd of market participants but over an extremely long-time frame of the SP500 (INDEXSP: .INX).
Below is a chart of the price action of the index from inception.
To put a simple explanation on the chart above. Since the stock market crash of 1929, the price pattern of the SP500 has essentially advanced in a 45-degree angle higher. I will spare you my explanation of the labeling of the chart as to not bore you as those details do little to further my explanation of the analysis. However, I will state that all our society has achieved since in the last 150 years is notated on the above chart. The advancement of technology, medicine, communication, war and peace is all included. For me, this becomes a visual picture of some of the best and worst times humanity has experienced during this time. What is compelling, is some of those pivotal moments barely stands out on the chart.
Fast forward to today.
After almost a 100-year price advance from the 1929 crash, we are now entering a prolonged period of digesting all those gains. I cannot over emphasize that this area of consolidation I forecast is 100% natural and should be no cause for alarm from a pattern analysis standpoint. As stated, that is a simplified explanation of what a super cycle event wave (IV) accomplishes. Additionally, our last Supercycle event, labeled (II), is an area of digesting gains that was hastened once the events of the Spanish Flu of 1918 were behind us and that pent-up demand was unleased. In the US, those times are referred to as the roaring twenties. Cyclically there are many character similarities in our wave (II) and our current wave (IV). Chief among them was a global pandemic and the aftermath. However, in my form analysis, a wave (II) and a wave (IV) are supposed to alternate in terms of time duration and retracement depth. If one takes place over a short period of time, the other should be long. I can see this sort of alternation I refer to take place every day, as it pertains to the very short timeframes. These patterns, whether long or short term, tend to be fractal in nature. Meaning, if you removed the dates and timeframes from a 1-hour chart of the SP500 and a 150-year chart (like the one displayed above) they would look strikingly similar. To a pattern analyst, like myself, I would be unable to discern what timeframe I was looking at. Nonetheless, the patterns would be instantly recognizable. Because these fractals form and complete on the smaller timeframes, through observation we can forecast the same effects on the much longer time duration charts. These fractal patterns tend to be self-similar and repeating.
In conclusion, if what I see unfold each and every day is indeed similar and repeating when observing a price pattern that is 150 years in the making, the conclusion will be a decade or two of dead money due to a long-term cyclical digestion of gains. Call it a “massive reversion to the mean event”. From things like interest rates to income inequality, a total reset to longer term norms.
Additionally, if my analysis is correct, the January 2022 stock market highs will not be breached for a very long time to come. This will be a time where investors will be forced to become more creative and pickier, as it pertains to seeking a return on capital.

A deep dive into Wyckoff Accumulation Schematic #1.Greetings, I find my previous communication regarding the US dollar was perhaps insufficient in elaborating my viewpoint. Therefore, I have resolved to delve deeper in this correspondence, presenting a thorough analysis to substantiate my conviction that the US dollar is poised for a considerable mark-up phase, from a technical standpoint.
I must clarify that I am not an advocate of fundamental analysis; my interests lie predominantly within the realm of technical patterns. I envisage this upward movement initiating around August 10th, which coincidentally corresponds with a significant Consumer Price Index reading.
---
Foremost, let me clarify that my analysis is grounded in the original Wyckoff Accumulation Schematic #1, composed of approximately five distinct phases. It is my endeavor to convey an understandable summary of these phases to you, my esteemed reader.
↓
↓
◆::◇::◆::◇::◆◆::◇::◆::◇::◆
Phase A:
In the Wyckoff Method represents the end of a downward trend in a stock's price. It starts with a significant sell-off (Selling Climax), followed by a brief price recovery (Automatic Rally), and then a less intense sell-off (Secondary Test). These events establish a trading range for the stock price. If the Secondary Test drops below the Selling Climax, further price drops or extended low prices can be expected.
◆::◇::◆::◇::◆◆::◇::◆::◇::◆
Phase B:
In Wyckoff's Method is a period of "building a cause," essentially preparing for a new upward trend. Institutions and professional investors start buying more shares at relatively low prices, anticipating a future price rise (the effect). They balance this buying with some short sales to keep the price from rising too fast. During this phase, the price often fluctuates within the trading range established in Phase A, with many Secondary Tests and false price breaks called "upthrusts." This phase can take a long time as big players slowly accumulate shares. As more shares are bought up, the volume of shares traded during price downswings tends to decrease, signaling the end of Phase B and the start of Phase C.
◆::◇::◆::◇::◆◆::◇::◆::◇::◆
Phase C:
In Wyckoff's Method is where the stock price is tested to see if it's ready for an upward trend. This phase often includes a "spring", a sudden drop below the established trading range that quickly reverses. This can trick late sellers into thinking the downtrend is resuming when it's actually the start of an uptrend. A successful spring represents a good opportunity to buy as it signals the stock is likely to start going up. If a "Sign of Strength" (SOS), a noticeable upward price movement, appears after the spring, it confirms this analysis. Sometimes, supply testing can happen without a spring, making Phase C harder to identify.
◆::◇::◆::◇::◆◆::◇::◆::◇::◆
Phase D:
In Wyckoff's Method is when demand starts consistently exceeding supply, leading to a dominant upward trend. This phase is marked by "Signs of Strength" (SOSs), or notable upward price movements on high volume, and "Last Points of Support" (LPSs), smaller upward price movements on lower volume. The price will typically reach the top of the trading range during this phase. The LPSs are generally good opportunities to start or add to long positions as they suggest the price is likely to continue rising.
◆::◇::◆::◇::◆◆::◇::◆::◇::◆
Phase E:
In Wyckoff's Method is when the stock price leaves the trading range and begins a clear upward trend, with demand in full control. Any price drops during this phase are usually brief. New higher-level trading ranges can form during this phase as investors take profits and large operators buy more shares, serving as "stepping stones" towards higher prices. This phase makes the price rise visible to all market participants.
◆::◇::◆::◇::◆◆::◇::◆::◇::◆
Glossary of the Wyckoff terms used in the post:
PS (Preliminary Support):
A point where significant buying starts to happen after a prolonged price decrease. The increased volume and price spread suggest the downtrend might be ending.
SC (Selling Climax):
The peak of selling activity, often involving panic selling by the public. Large investors absorb this selling, which can stabilize or increase the price. The price often closes well above the low point, reflecting these large investors' buying activity.
AR (Automatic Rally):
A price increase that happens because selling pressure has significantly decreased. This rally, further driven by short covering, helps set the upper boundary of the accumulation trading range.
ST (Secondary Test):
The price revisits the area of the selling climax to test if demand outweighs supply. To confirm a bottom, the volume and price spread should decrease significantly as the price approaches the support level. It's common to have multiple secondary tests after a selling climax.
Test:
Large operators or professional investors test the market for supply throughout the trading range and at key points during a price advance. If a test reveals considerable supply, the market might not be ready for a markup. A spring is often followed by tests, and a successful test (indicating impending price increases) typically forms a higher low on lower volume.
SOS (Sign of Strength):
This is a price advance on an increasing spread and relatively higher volume. An SOS often follows a spring, which validates the analyst’s interpretation of that action.
LPS (Last Point of Support):
This is the low point of a reaction or pullback after an SOS. Reverting to an LPS implies a pullback to a support level, which was formerly resistance, on a decreased spread and volume. Despite the singular term, there may be multiple LPSs on some charts.
BU (Back-Up):
Coined by Robert Evans, a prominent Wyckoff method teacher, it's a metaphor for a pullback after an SOS, akin to "jumping across the creek" of price resistance and then "backing up to the creek." A back-up often precedes a significant price markup and can appear as a simple pullback or a new trading range at a higher level.
◆::◇::◆::◇::◆◆::◇::◆::◇::◆
I appreciate your time in perusing this analysis. In conclusion, I foresee the US dollar potentially reaching an upside target of approximately 110-111 into the end of this year.
Lastly, I invite you to revisit my prior substantial post on the US dollar, wherein I had the occasion to pinpoint "the top".
↓
💜

bulls defending wellthe volume on NQ today was great, in a demand area. already showing strength. I this does not break out to the long side I'm not eating sugar for a month..

NASDAQ Small glimmer of hope as 1D making a MACD Bullish Cross.Nasdaq (NDX) recently broke below the Higher Lows trend-line of 2023, the trend-line from the start of the year that has been supporting the strong recovery. This created the conditions for further decline, especially since the 4H MA50 keeps the price action below it, but so far Support 1 (14430) is holding.
The above levels are those we will use as break-outs. A candle close below Support 1 will be a sell signal, targeting the 1D MA200 (orange trend-line) at 13900. Since however the 1D MACD is close to forming a Bullish Cross, the bullish momentum attract probabilities and if a candle closes above the 1D MA50, we will instead buy, targeting 15650 (Resistance).
The pattern since mid August is quite similar to the Arc formation of November - December 2022. After the 1D MA50 broke, it targeted the previous Resistance and even hit the 1.382 Fibonacci extension before the next pull-back.
-------------------------------------------------------------------------------
** Please LIKE 👍, FOLLOW ✅, SHARE 🙌 and COMMENT ✍ if you enjoy this idea! Also share your ideas and charts in the comments section below! This is best way to keep it relevant, support us, keep the content here free and allow the idea to reach as many people as possible. **
-------------------------------------------------------------------------------
💸💸💸💸💸💸
👇 👇 👇 👇 👇 👇

Trend reversal to the UPSIDE if Nq! Holds 100 EMA on DailyLooking at today's Bounce with high Volume, the Nasdaq futures have again reclaimed 100 EMA on the daily timeframe. There is a very high probability that Nasdaq Futures will go higher in coming days and test 50 day EMA. If it closes above 14,809 tomorrow, then this is the trend reversal and we are again in the bullish trend. Keep an eye on the 100 EMA, if it looses then there will be a lot of selling to the short side. As of now we are very bullish in coming days till Friday. And then we can analyze the closing of the week.
