NQ: Downside target 14450 is a buyNQ should find support at 14450 which should provide a relief bounce to 15190.
NASDAQ 100 E-MINI FUTURES

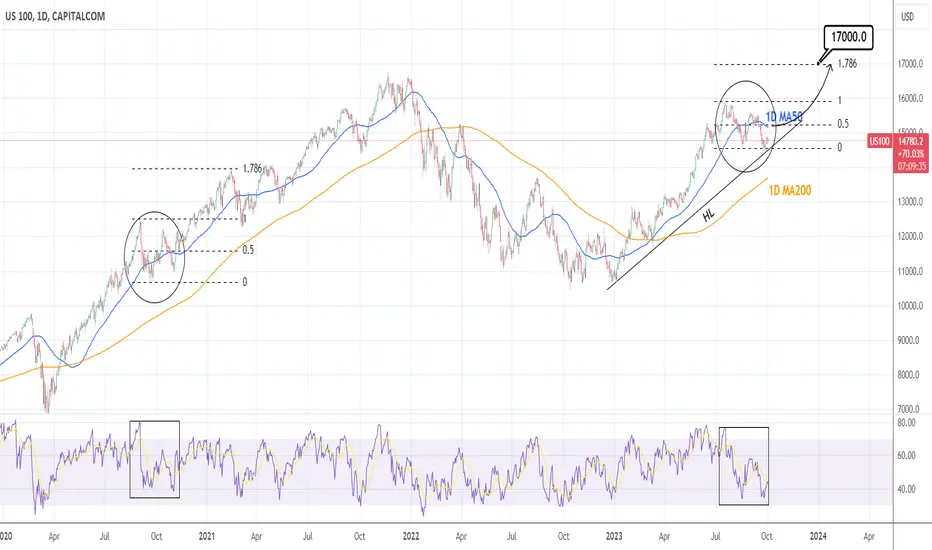
NASDAQ: Can hit 17,000 if the 1D MA50 breaks again.Nasdaq remains bearish on the 1D timeframe (RSI = 40.412, MACD = -138.180, ADX = 35.654) but it is on the HL trendline, the supporting trendline that emerged on the December 28th 2022 low. According to the 1D RSI, comparisons can be made with the September-October 2020 consolidation fractal around the 1D MA50, following the COVID recovery. After the 1D MA50 got crossed over for the second time, the index went on to reach the 1.786 Fibonacci extension level before the next consolidation.
If the HL holds and the index breaks over the 1D MA50 again, we will have a strong long term bullish case in our hands and target 17,000 (Fibonacci 1.786).
## If you like our free content follow our profile to get more daily ideas. ##
## Comments and likes are greatly appreciated. ##
Are the Bears about to get BOLD?In my latest installment of the repeating Sentiment chart, we get a front row seat on how trader sentiment ebbs and flows with price action. Once we hit the target of 4172-4180, that will be a function of the bearish thesis getting aggressive.
A complete unwinding of the utter junk spewed on CNBC a month ago. New highs possible? Soft landing? The magnificent seven? I stand by the comment I made in my trading room yesterday... CNBC is the most detrimental content I professional trader can ingest.
Why is Tom Lee not on CNBC today? LOL...
Stay safe out there.
Chris

NQ1! 1HR TIMEFRAME 10/2-10/3Link to chart: www.tradingview.com
Sideways action staying above the blue trendline created from a few weeks ago of hitting a recent support level.
There are major news events to end the week and with rumors of a GOVT shutdown, I am expecting a huge squeeze towards end of the week.
My area of watch is 14850s to 14820s.
BULLS: Maintain over 14850, a possible move to 15200s.
BEARS: Break and retest 14850, a possible move to 14650-14700s.

Nasdaq Futures to test 50EMA on dailyThere is a very high chance that Nasdaq futures can test 50-day EMA on the daily Level tomorrow since today was an inside day. It may get rejected on the 50 day EMA. If Futures can hold above 15050 level that is prior day's range high, then there is a very high probability of testing the 50EMA tomorrow.

NASDAQ Double bullish targetNasdaq / US100 is consolidating around the 4hour MA50. It is a similar Cup and Handle pattern with August 24th.
Buy and target 15050 (4hour MA200). Then wait for a 1day pull back. Re-buy and target 15330 (Fibonacci 0.382) under the Falling Resistance.
RSI patterns identical, both showing we are in the phase of the 4hour MA50 consolidation.
Previous chart:
Follow us, like the idea and leave a comment below!!

Day Trade Market Condition oct 02, 2023Day Trade Market Condition oct 02, 2023
levels for NQ ES CL BTC
watch the table left side for trade, right side for trend

Nasdaq is following in the footsteps of #MMMNYSE:MMM
CME_MINI:NQ1!
OANDA:NAS100USD
PEPPERSTONE:NAS100
I noticed the relationship between the #MMM movement in the past and the Nasdaq movement now. If based on the #MMM chart, then the goal for us is about 9000 points.

NQ1! NAS100USD NASDAQ Analysis dated 2023 Oct 02NQ1! NAS100USD NASDAQ 2023 Oct 02
Analysis from 02 Sep 2023 short scenario worked out well for the month.
- market broke down the upward channel (black dash)
- Supply is present on Friday's bar
- Wait for reaction to demand line of upward channel (blue highlight, set alarm)
Possible scenarios:
1) Market returns into upward channel and is supported = Long on test and accept
2) Short on rejection if bottom of channel becomes resistance.
Price Reaction Levels
Short on Test and reject | Long on Test and Accept
16255 15801 15283 14804 13960
*Longer term: 13350 support must hold for long trend to be intact.
Price/Volume/Trend Analysis:
Weekly: Ave vol up bar close level with previous bar = NTC, Minor support
Daily: S>D weak close up bar.
*NTC = Non-Trend Changing | PTC: Potential Trend Changing
Like and follow if you find this useful | *For education purpose only.
Have a profitable trading week.

all is shortive been messing wiht intraday trading, so havent been able to publish a lot on that.
Now may I say that even with some bullish moves, all is telling me to short.

Day Trade Market Condition sep 29, 2023Day Trade Market Condition sep 29, 2023
levels for NQ ES CL BTC
watch the table left side for trade, right side for trend
note last two day Dynamic Volume Profiles

Nasdaq Futures are at the crucial point. For NASDAQ Contracts to go higher, they need to clear out the 14,950 level. If they get rejected from 14,950, then look for downside. On the other hand 14,800 is acting as a good support. wait till the Michigan consumer sentiment data release tomorrow before taking any position. do not trade for the first half hour after the open since there is a lot of data release like PCE before market. we were already down by almost 9 percent, since few days from recent highs. Very good chance of a getting and inside day tomorrow. there are high chances of us getting a follow through tomorrow on the bullish side. It is also the end of the month for positioning stand point so be aware and trade after 1 hour of market open to avoid unnecessary risk.

Day Trade Market Condition sep 28, 2023Day Trade Market Condition sep 28, 2023
levels for NQ ES CL BTC
watch the table left side for trade, right side for trend
note NQ keeps floating 14718 yet and manage to close above

NASDAQ Triple buy signal on the short term.Nasdaq hit yesterday the Falling Support of the Falling Wedge pattern as well as the Rising Support and is posting today the 2nd straight green (1d) candle.
At the same time, the RSI (1d) formed a Double Bottom.
Trading Plan:
1. Buy on the current market price.
Targets:
1. 15300 (Falling Resistance and 0.786 Fib).
Tips:
1. The RSI (1d) is under a Falling Resistance. If crossed over we may start having a case for resuming the bullish trend.
Please like, follow and comment!!

All Targets Hit in the SP500 FuturesToday we hit my long standing targets and so far have bounced.
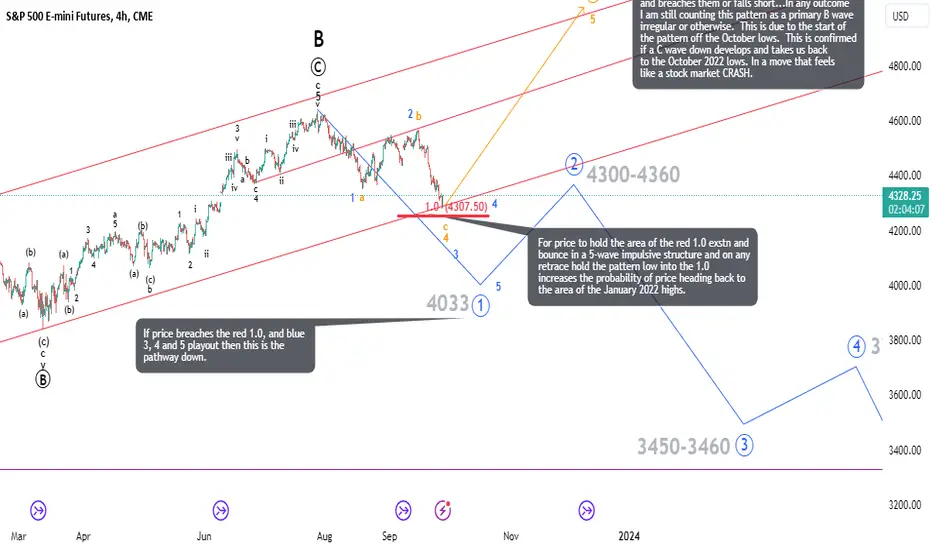
I have carried an orange bullish count and a bearish blue count on this chart for a while now. If we can develop an impulsive 5-wave structure up that breaches 4508. I'll remove the bearish blue count targeting 4030-4060.
Should we rally in a corrective 3-wave manner and fail to take out key resistance, then breach today's LOD at 4277.25. Then I will remove the orange bullish count.
Best to all,
Chris
/ES (SPY) Gap Fill Long with Confluence/Odds Enhancers!While wariness remains re: larger timeframe structure for US equities (+ continued weakness in US gov’t bonds, USD strength), we are stalking near/intermediate-term longs via downside futures gaps in both the ES and NQ. The YM and, to a lesser extent RTY, are also approaching possible buy zones, thus bolstering this trade’s attractiveness.
While the primary premise of the trade is filling the downside gap into “demand”, odds are enhanced via the trendline and anchored VWAP, which coincide with ~4300 (major psychological #). When placing equity index futures trades at LionHart, we closely watch potentially correlated markets (VIX, DXY, ZF/N/B…). Volatility has had a nice move alongside the downdraft in stocks, but may be a bit overaccelerated as it approaches “supply” (red lines). If equity indexes fill downside gaps and pierce buy zones, watch the VIX and other related markets for reversal signals.
Regarding trade concerns/targeting, we sometimes prefer subjective target/trade management via small timeframe charts; that methodology will be applied here. New overhead supply has formed ~4360 and traditional resistance traders may defend ~4340-50, so trade profit margin is not ideal. Given that equity markets have a bullish bias, though, we still believe capital is worth deploying. If you can purchase multiple contracts, consider scaling ahead of the abovementioned levels and hold runners if prices press higher. The red zones = supply, where unfilled sell orders remain.
Thank you for reading, thoughts/feedback welcome, and good luck/happy trading!
Jon
