NASDAQ Critical level for short-term.Nasdaq (NDX) is testing a strong short-term Support Cluster, the Lower Lows trend-line and the bottom of the 1H Channel Up. Being below the 1H MA50 (blue trend-line), the trend is right now neutral until one of the two levels breaks.
If the index breaks above the 1H MA50, we will turn bullish again, targeting 22200 (+5.70% from the current Low, the minimum % rise in the past month).
If it breaks below the Support Cluster, we will turn bearish, targeting the 1H MA200 (orange trend-line) at 20800.
-------------------------------------------------------------------------------
** Please LIKE 👍, FOLLOW ✅, SHARE 🙌 and COMMENT ✍ if you enjoy this idea! Also share your ideas and charts in the comments section below! This is best way to keep it relevant, support us, keep the content here free and allow the idea to reach as many people as possible. **
-------------------------------------------------------------------------------Disclosure: I am part of Trade Nation's Influencer program and receive a monthly fee for using their TradingView charts in my analysis.
💸💸💸💸💸💸
👇 👇 👇 👇 👇 👇
NASDAQ 100 E-MINI FUTURES


2025.05.19 nasdaq analysis🟧
At the close of Friday's session, the daily and weekly candle closed around 21500.
However, in the final hour after market close, Nasdaq broke below the orange trendline.
Then, at the start of Monday’s session, a sharp gap down occurred.
The gap was briefly filled before Nasdaq retested the broken trendline and continued to fall.
🔗
🕒
Nasdaq hasn't confirmed a downtrend yet.
The key is whether 21187, which has held since May 13th, will break.
If it fails, price may fall below the value area it’s held for a week.
Downside targets if 21187 breaks: 21000, 20765.
🔗
🟩
Bullish scenario isn’t dead—this may be a temporary pullback.
Key entry signal: Break above the 15-min 20 EMA.
Target zones vary by strength:
Conservative TP: 30-min 20 EMA
Aggressive TP: 21415, possibly even 21500 if today’s high is broken
🔗
📌 Conclusion
Monday started with a gap down, but support is still holding.
Break below 21187 = potential trend reversal + end of box-range movement.
Buy trades should be cautious & short-term until confirmation of strength.

Buyers Stand By And Be Ready! In this Weekly Market Forecast, we will analyze the S&P 500, NASDAQ, DOW JONES, Gold and Silver futures, for the week of May 18 - 24th.
The Stock Indices remain bullish. So buys are warranted for next week.
Gold and Silver pulled back last week on news of Trump's deals and sanction relief. But Gold is at support now. Watch for bullish setups for buys or a bearish market structure shift before seeking sells.
Crude Oil is near buy side liquidity. Look for short term buys before a longer term, high probability sell setup to form.
Enjoy!
May profits be upon you.
Leave any questions or comments in the comment section.
I appreciate any feedback from my viewers!
Like and/or subscribe if you want more accurate analysis.
Thank you so much!
Disclaimer:
I do not provide personal investment advice and I am not a qualified licensed investment advisor.
All information found here, including any ideas, opinions, views, predictions, forecasts, commentaries, suggestions, expressed or implied herein, are for informational, entertainment or educational purposes only and should not be construed as personal investment advice. While the information provided is believed to be accurate, it may include errors or inaccuracies.
I will not and cannot be held liable for any actions you take as a result of anything you read here.
Conduct your own due diligence, or consult a licensed financial advisor or broker before making any and all investment decisions. Any investments, trades, speculations, or decisions made on the basis of any information found on this channel, expressed or implied herein, are committed at your own risk, financial or otherwise.

E mini Nasdaq 100. Weekly walkthroughWeekly walkthrough on NQ. Huge gap up and continuation weekly profile towards the Major Buyside Internal Liquidity

2025.05.16 nasdaq analysis
This is the briefing result for Nasdaq as of yesterday.
The briefing began during the yellow box phase.
At that time, I clearly mentioned that the market had entered a short-term correction phase and emphasized the importance of the 21187 support level marked by the red box.
As seen in the chart, the 21187 level was not broken to the downside and instead held as support, followed by a rebound.
This reaffirms the significance of the 21187 level.
Afterward, the trend continued upward.
Looking at the 15-minute chart, there have been consistent lower wicks breaking below support,
which decreases the reliability of a short opportunity simply from a trendline break.
At this point, the trust in a sell-off purely based on trendline breakdown is weakening.
This chart outlines a short-term sell strategy.
As previously mentioned, while the short-term uptrend line has become less reliable,
if we see a break of the trendline and a drop below 21376,
we could expect a pullback toward the blue box area around 21320~21300.
Thus, a short-term short strategy may be valid in this scenario.
From a daily chart perspective, Nasdaq closed with a green candle again,
but the shape of the candle resembles a doji with similar upper and lower wicks.
What we need to focus on here is that Nasdaq has re-entered a high-volume price area (supply zone),
but since no clear direction has formed, many positions seem to be closed off whenever the price pushes higher.
On the downside, since the 21187 support level has held,
this remains the most critical level.
If 21187 is broken downward, it could mark the beginning of a daily-level correction phase.
Conclusion:
No clear direction yet.
While the direction was upward until yesterday, the doji close suggests caution.
For further bullish movement, a confirmed close above the current supply zone is essential.
If the market corrects downward, watch for a break below 21187.
The current price action is forming a channel pattern with higher lows and higher highs.
If traded correctly within this range, good opportunities may arise.

Divergence Since 2020 - What Happens When Bonds Continue?When Stocks & Bond Move Opposite Direction what does it mean?
We have observed a divergence between the stock and bond markets since 2020. While U.S. Treasury bonds entered a bear zone, the stock markets continued their upward climb. What are the implications of this decoupling?
Will the stock market resume its uptrend and hit new highs? Or is this merely a retracement before further downward pressure?
A healthy, three-way interdependent relationship occurs when the economy, bonds, and stocks move in the same direction. When investors have confidence in the U.S. economy, they tend to invest in long-term bonds, which it usually will benefits the stock market.
This alignment was evident between 2000 and 2020, during which bonds and stocks moved largely in tandem.
However, from 2020 onward, bonds began declining—signaling a loss of investor confidence in the economy. Technically, this should exert downward pressure on stocks as well.
Yet, we are witnessing a divergence: Where U.S. Treasury bonds have fallen while stocks have continued to rise.
When such a divergence surfaces, it signals the need for caution in our approach in the stock markets.
What could be the other reasons why US T-bond has peaked in 2020 and depreciated by 44% since then?
Micro E-mini Nasdaq Futures and Options
Ticker: MNQ
Minimum fluctuation:
0.25 index points = $0.50
Disclaimer:
• What presented here is not a recommendation, please consult your licensed broker.
• Our mission is to create lateral thinking skills for every investor and trader, knowing when to take a calculated risk with market uncertainty and a bolder risk when opportunity arises.
CME Real-time Market Data help identify trading set-ups in real-time and express my market views. If you have futures in your trading portfolio, you can check out on CME Group data plans available that suit your trading needs www.tradingview.com
Trading the Micro: www.cmegroup.com

US10 YR Yield Weekly Chart Analysis: NFAUpdate: May 15, 2025
-As per my last update(April 5, 2025) about the gap between March 24th candle and March 31st candle that any candle body close above that gap will invert that gap from resistance to support and Upside target will be Jan 13, 2025 candle High
- We had a candle body close above that gap and now its acting like support.
-Now i am expecting the bullish trend to continue and long term upside target is Jan 13, 2025 candle High and Short term upside target is April 7, 2025 candle high


NQ KEY ICT LEVELS - 14th MAY 2025Levels marked on the chart using my free indicator which marks out all of the ICT key levels which can be used for potential POIs where price might react

NQ KEY LEVELS - 14th MAY 2025Key levels marked by using low volume nodes for potential key levels where we may see price react.

ES NQ short tradewe will be testing NQ 21000
ES 5880
Targets are based on previous structure breakout line => upcoming resistance for our short = target

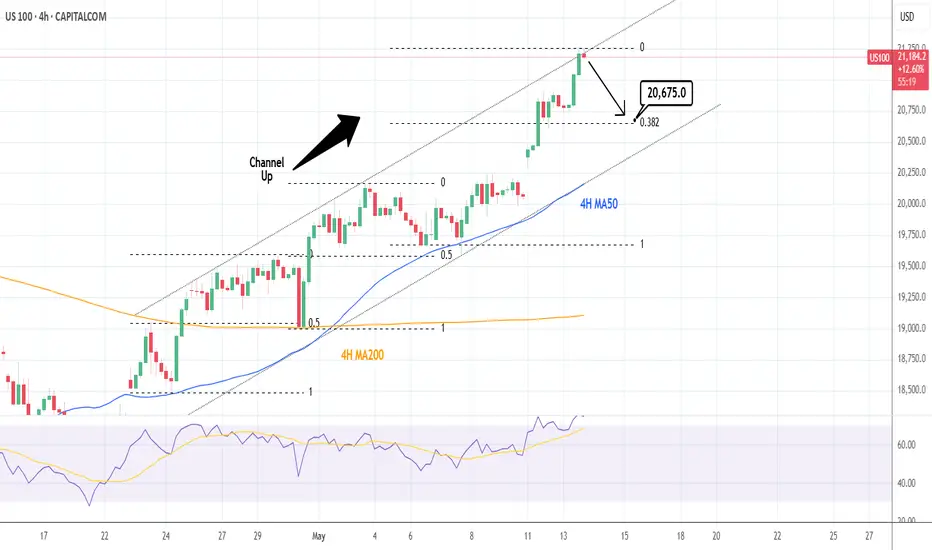
NASDAQ: Time for a 4H technical correction.Nasdaq is almost overbought on its 1D technical outlook (RSI = 69.775, MACD = 371.830, ADX = 37.524) and has reached the top of its 4H Channel Up. The two HH that the pattern has both pulled back to the 0.5 Fibonacci retracement level before the 4H MA50 provided the necessary support for the next bullish wave. Consequently we expect a small correction to at least the 0.382 Fib next (TP = 20,675).
See how our prior idea has worked out:
## If you like our free content follow our profile to get more daily ideas. ##
## Comments and likes are greatly appreciated. ##

NQ KEY ICT LEVELS - 13th MAY 2025Levels marked on the chart using my free indicator which marks out all of the ICT key levels which can be used for potential POIs where price might react

NQ KEY LEVELS - 13th MAY 2025Key levels marked by using low volume nodes for potential key levels where we may see price react.

NASDAQ broke above its 1D MA200 after 2 months! Target 22000.Nasdaq (NDX) broke today above its 1D MA200 (orange trend-line) for the first time in more than 2 months (since March 06), following the U.S. - Chine trade deal. This trend-line also had the March 26 rejection under its belt, which initiated the most aggressive part of the 'Trade War' correction.
The last time the index broke above its 1D MA200 on a similar pattern was when it was recovering after the bottom of the 2022 Inflation Crisis. The February 01 2023 break-out produced an instant rise to the 1.382 Fibonacci extension before a short-term correction to re-test the 1D MA200.
As a result, we expect 22000 (1.382 Fib ext) to come as early as this week before any discussions can be made for a new pull-back.
-------------------------------------------------------------------------------
** Please LIKE 👍, FOLLOW ✅, SHARE 🙌 and COMMENT ✍ if you enjoy this idea! Also share your ideas and charts in the comments section below! This is best way to keep it relevant, support us, keep the content here free and allow the idea to reach as many people as possible. **
-------------------------------------------------------------------------------
Disclosure: I am part of Trade Nation's Influencer program and receive a monthly fee for using their TradingView charts in my analysis.
💸💸💸💸💸💸
👇 👇 👇 👇 👇 👇


NQ KEY ICT LEVELS - 12th MAY 2025Levels marked on the chart using my free indicator which marks out all of the ICT key levels which can be used for potential POIs where price might react

NQ KEY LEVELS - 12th MAY 2025Key levels marked by using low volume nodes for potential key levels where we may see price react.

NAS100 - Stock Market Expects a Devastating Week!The index is trading above the EMA200 and EMA50 on the 4-hour timeframe and is trading in its ascending channel. I expect corrective moves from the specified range, but if the index corrects towards the demand range, we can look for the next Nasdaq buy positions with a good risk-reward ratio.
U.S. stock futures responded positively to signals from both Chinese and American officials. Looking ahead to the coming week, investor focus is squarely on the Consumer Price Index (CPI) report from the United States—marking the first chance to assess the impact of the new tariffs implemented on April 9.
Meanwhile, ongoing trade negotiations between the U.S. and China remain a crucial factor, with significant implications for inflation, Federal Reserve policy, and overall market expectations. In addition to inflation data, retail sales figures and the preliminary results of the University of Michigan sentiment survey could influence market outlook regarding interest rates—especially since price stability and full employment remain core mandates of the Federal Reserve. At present, Fed officials are working to maintain a cautious stance in order to anchor inflation expectations. However, if clear signs of economic weakness emerge, that stance could shift rapidly—something that several Fed officials have already openly acknowledged.
Retail sales, in particular, could provide a different narrative about the health of the economy. After a notable 1.5% jump in March, estimates suggest that growth in April slowed to just 0.1%. This deceleration may reflect consumer reluctance to spend, stemming either from inflationary pressures or broader economic uncertainty.
Thursday’s data release will include the Producer Price Index (PPI), industrial production, and the Philadelphia Fed manufacturing index—offering a clearer picture of supply-side dynamics and the performance of the industrial sector.
On Friday, attention will turn to a fresh batch of economic indicators: building permits, housing starts, the New York (Empire State) manufacturing index, and especially the University of Michigan’s preliminary consumer sentiment survey. This survey has gained importance in recent months due to notable increases in both one-year and five-year inflation expectations. As recent charts indicate, while consumer confidence has plummeted to multi-year lows, inflation expectations have trended upward—a worrisome combination that could limit the Fed’s ability to ease monetary policy.
Although concerns about a U.S. recession persist, recent data suggest more of a “gradual slowdown” rather than signs of an imminent crisis. In March, both the CPI and PCE indices declined, indicating a temporary easing of inflationary pressures. However, this trend may reverse in April, as the broad implementation of reciprocal tariffs likely raised import costs—particularly for Chinese goods, which now face duties as high as 145%.
New estimates indicate that these tariffs could add 2.25% to core inflation over the next year, effectively reversing the progress made in 2024 on taming price pressures.Prior to the Trump administration’s tariff announcements, economists had differing views on inflation, with some expecting it to approach the Fed’s 2% annual target by year-end. Contrary to trade experts, Trump claimed that sellers would not pass these price increases on to consumers.
Goldman Sachs’ analysis this week suggests that Trump’s tariffs could push inflation to levels not seen since the post-pandemic price surge. The broad import taxes announced between February and April may have a substantial impact on the economy, and consumers are likely to feel the effects first at the checkout counter. Goldman economists estimate that the tariffs could drive annual inflation—as measured by core Personal Consumption Expenditures (PCE)—to 3.8% by December, marking the highest rate since 2023. The Fed’s preferred inflation gauge rose 2.6% last year.
This metric remains above the Fed’s 2% target and has shown limited progress toward that goal since 2023. The last time inflation was below this benchmark was in January 2021.
A renewed wave of price increases could severely strain American household budgets—particularly if the labor market also weakens, as many economists anticipate. This would also represent a significant setback for the Federal Reserve, which has kept interest rates elevated since 2022 in an effort to combat post-pandemic inflation.
While inflation hovered around 3% at the beginning of 2024 with little change, it saw a notable drop in March. Many analysts forecast that inflation will continue to decline and approach the 2% target by the end of 2025.
Walker and Peng’s analysis factored in both the direct effects of tariffs—most of which will likely be passed on to consumers—and several indirect consequences. The trade war has unexpectedly weakened the U.S. dollar, reducing Americans’ purchasing power.
Moreover, some manufacturers may shift production away from China, where tariffs are particularly severe, to locations with higher production costs. As a result, American consumers may end up paying significantly more for imported goods, especially in categories like consumer electronics and apparel.

NQ Outlook for CPI week. CME_MINI:NQ1!
Expecting massive meltdown on Indexes. But need more data to confirm. Neutral at this point. Waiting for more prints.
Gun to my head, I want all out meltdown right from Monday after tagging Monthly FVG C.E

US100 - Correction Required Before Next Major Rally PhaseThe US Tech 100 index is showing signs of exhaustion after a strong recovery rally from April lows, with price action now facing resistance at the upper blue box around 20,200. The index appears to be forming a short-term top as momentum wanes, evidenced by recent candle patterns displaying indecision and inability to sustain new highs. The downward-pointing red arrow suggests a likely move toward the middle support zone around 19,000, which would represent a healthy correction of about 5-6% from current levels. This pullback would help reset overbought technical indicators and potentially shake out weak hands before establishing a stronger foundation for the next leg higher. Given the sharp rally we've witnessed from the April lows near 16,400, this correction would be technically justified and provide a more sustainable launching pad for continuation of the longer-term uptrend once complete.
Disclosure: I am part of Trade Nation's Influencer program and receive a monthly fee for using their TradingView charts in my analysis.
