Weekly Market Forecast: Monday UPDATES!How accurate were the forecasts for S&P 500, NASDAQ, DOW JONES, Gold and Silver futures given in the Weekly Market Forecast for this week?
BULLSEYE!
Enjoy!
May profits be upon you.
Leave any questions or comments in the comment section.
I appreciate any feedback from my viewers!
Like and/or subscribe if you want more accurate analysis.
Thank you so much!
Disclaimer:
I do not provide personal investment advice and I am not a qualified licensed investment advisor.
All information found here, including any ideas, opinions, views, predictions, forecasts, commentaries, suggestions, expressed or implied herein, are for informational, entertainment or educational purposes only and should not be construed as personal investment advice. While the information provided is believed to be accurate, it may include errors or inaccuracies.
I will not and cannot be held liable for any actions you take as a result of anything you read here.
Conduct your own due diligence, or consult a licensed financial advisor or broker before making any and all investment decisions. Any investments, trades, speculations, or decisions made on the basis of any information found on this channel, expressed or implied herein, are committed at your own risk, financial or otherwise.
NQ1

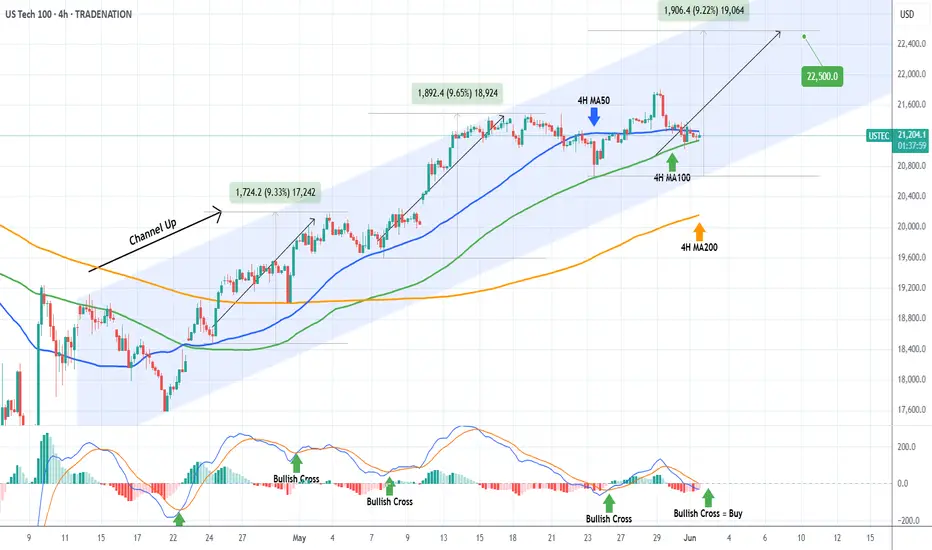
NASDAQ Will the 4H MA100 come to the rescue?Nasdaq (NDX) is trading within a 3-week Channel Up, which is currently supported by the 4H MA100 (green trend-line). In fact, the price is being squeezed in the last three 4H candles within the 4H MA100 and the 4H MA50 (blue trend-line).
This tight compression technically tends to cause violent break-outs either way. As long as the Channel Up holds, we expect that to be upwards and it should be confirmed by the formation of a 4H MACD Bullish Cross.
With the last two major rallies being around +9.50%, we expect to see 22500 on the next Leg Up.
-------------------------------------------------------------------------------
** Please LIKE 👍, FOLLOW ✅, SHARE 🙌 and COMMENT ✍ if you enjoy this idea! Also share your ideas and charts in the comments section below! This is best way to keep it relevant, support us, keep the content here free and allow the idea to reach as many people as possible. **
-------------------------------------------------------------------------------
Disclosure: I am part of Trade Nation's Influencer program and receive a monthly fee for using their TradingView charts in my analysis.
💸💸💸💸💸💸
👇 👇 👇 👇 👇 👇
25.06.02 nasdaq analysis📊
📌 Friday Price Action Summary
Failed to break above the black resistance box
Repeated rejection at the zone strengthened downward pressure
As long as this zone remains unbroken, bearish bias remains
📉
Price has entered the bullish candle from May 27
If that candle breaks to the downside, a drop toward the 20EMA on the daily chart (20,930p) is likely
Currently seeing low volume and range-bound movement, so trend direction needs confirmation
🔍
If the European session fails to sustain the rebound, it will likely be a temporary move
A break below 21,218p + trendline break would confirm a short setup
🎯 Targets (TP):
TP1: 21,071p (Friday’s low)
TP2: 20,930p (Daily 20EMA)
📌 Strategic Conclusion
Bias: Bearish
However, due to declining volume and range-bound action,
→ It’s better to wait for confirmation before entering
If bearish entry conditions are met, execute with confidence

Weekly Market Forecast: Stocks, Gold, Silver & Crude OilIn this Weekly Market Forecast, we will analyze the S&P 500, NASDAQ, DOW JONES, Gold and Silver futures, for the week of June 2 - 6th.
Stock Indices are looking more bullish than bearish. Valid buys only!
Gold is moving sideways. Wait for confirmation before a buy/sell signal.
Oil prices may tick lower. Trade carefully.
Enjoy!
May profits be upon you.
Leave any questions or comments in the comment section.
I appreciate any feedback from my viewers!
Like and/or subscribe if you want more accurate analysis.
Thank you so much!
Disclaimer:
I do not provide personal investment advice and I am not a qualified licensed investment advisor.
All information found here, including any ideas, opinions, views, predictions, forecasts, commentaries, suggestions, expressed or implied herein, are for informational, entertainment or educational purposes only and should not be construed as personal investment advice. While the information provided is believed to be accurate, it may include errors or inaccuracies.
I will not and cannot be held liable for any actions you take as a result of anything you read here.
Conduct your own due diligence, or consult a licensed financial advisor or broker before making any and all investment decisions. Any investments, trades, speculations, or decisions made on the basis of any information found on this channel, expressed or implied herein, are committed at your own risk, financial or otherwise.

Stock Market Forecast | TSLA NVDA AAPL AMZN META MSFTStock Market Forecast | CME_MINI:NQ1! CME_MINI:ES1! SPY QQQ
Mag 7 Forecast | NASDAQ:TSLA NASDAQ:NVDA AAPL AMZN META MSFT GOOGL

nasdaq : waiting for take the sell stopsThere’s an FVG on the 4H timeframe in Nasdaq,
which indicates strong momentum—likely aiming to hunt some lows.
If the price takes out the specific low I’ve marked,
I’ll watch how the candles react around that area.
If the reaction isn’t strong,
then I’ll start considering a bullish scenario
and look for a potential long setup.

NQ Daily Orderflow, MMXM swing points Market Efficiency ParadigmDaily orderflow on NQ. How it formed why it formed. Using Internal Liquidity and sub Internal Liquidity

25.05.30 nasdaq analysis📊
📌 Previous Trade Summary
Most traders anticipated an upward move due to the previous day's rally.
However, a bearish trendline breakdown led to a sell-off.
A short entry became valid, marked with a red circle on the chart.
Result: ~139 points gained per contract, approx. $2,800 profit.
🕓
Currently, the 4-hour chart shows support at the 60EMA,
but the overall structure remains bearish due to a trendline breakdown.
If the 60EMA fails to hold, a stronger downtrend could unfold.
The morning low at 21,268.50 could act as a potential rebound zone.
➡️ No clear short signal at the moment – waiting for more structure.
📈
The key to a long entry lies in breaking the short-term resistance trendline.
A full bullish trend reversal is expected only above 21,557.75.
Until then, take-profits at stepwise levels remain the strategy.
🟢 Long Entry Condition
Entry: Above 21,417.5
TP1: 21,447
TP2: 21,485
TP3: 21,522
TP4: 21,557 (trend reversal confirmation)
🔴 Stop Loss
If the 15-minute candle closes below the 20EMA after entry → cut losses.
📌 Summary
Short setup: Requires more confirmation, no entry for now.
Long setup: Valid above 21,417.5 with targets up to 21,557.
Trend reversal key level: 21,557 breakout.
Avoid anticipation—enter only when conditions are met.

Volume Power System Signal to Buy Nasdaq We have a good signal from ouer System VPS to buy the NASDAQ and hold the position until a new reversal signal appears.

Nvidia Earnings Boost, Trade Tariffs Legitimacy, NQ trade ideaCME_MINI:NQ1!
Big Picture Context: .
NQ futures rallied after NVIDIA posted an earnings beat and after the Manhattan-based Court of International Trade blocked President Trump's Liberation Day tariffs.
Goldman Sachs noted that the ruling on Liberation Day tariffs gives the administration 10 days to halt tariff collection, but does not affect sectoral tariffs. The administration can still impose across-the-board and country-specific tariffs under other legal authorities.
Jobless claims and continuing claims have come in higher.
What has the market done?
The rally faded in the overnight session. However, the catalysts provided energy for prices to move higher. Currently, price is trading above the prior week’s high, yesterday’s high, and it is also trading above the yearly open, and 2025 VPOC and mcVPOC for the last 3 weeks.
What is it trying to do?
The market is negating the recent bear market territory sell-off and negating a bear market rally. It is propelling higher.
How good of a job is it doing?
The market has created good structure and micro composites, despite some gaps left open, and it has created higher lows since last Friday.
What is more likely to happen from here?
Scenario 1: Long Continuation
In this scenario, we are looking for NQ to turn at the immediate 2025 LVN support area. If it edges higher, we will be looking for potential long opportunities above the 21710–21720 area, targeting overnight highs and potentially the next HVN.
Scenario 2: Gap Close and Reversal
In this scenario, we are looking for a pullback, testing pHi and pWk-Hi. We will look for a rounded base that consolidates here on a lower timeframe, such as the 5-minute timeframe, and look for a reversal back towards the 21710–21720 level.
pWk-Hi: prior Week's High
pHi: prior Day's High
HVN: High Volume Node
LNV: Low Volume Node
VPOC: Volume Point of Control
C: Composite (prefix before VAL, VAH, VPOC, VP, AVP)
mC: micro-Composite (prefix before VAL, VAH, VPOC, VP, AVP)

NQM2025 outlook for the week ahead 05/19/2025Hello World.
for the week ahead i have a bullish bias im looking to target the bearish fvg created on mon 24 feb 2025 ( daily TF) i expect the fvg formed on tue 13may2025 (Daily TF) reject the price higher, if the bullish fvg didnt hold maybe we will se a drop to the V.I bellow.
i will give updates

25.05.29 nasdaq analysis📊
The Nasdaq has broken through its short-term resistance trendline and turned upward.
NVIDIA’s strong earnings report acted as a positive catalyst, leading to a rebound,
and the Asian session helped extend the upward momentum.
📈
On the daily chart, the previous high of 21,813 (Feb 25, 2024) has been broken to the upside.
The current price is within the range of the prior candle (21,652–22,245),
with the next major resistance at 21,968, which coincides with a key supply zone.
This level may trigger some short-term profit-taking.
🕒
After the breakout, the Nasdaq is consolidating in a sideways pattern while making higher highs.
Currently, there is no clear entry point for long positions, and traders should manage risk carefully.
The upper target remains at 21,968, but the volatility during pullbacks might challenge entry holding power.
📉
If price breaks below 21,408, we may see downside continuation toward the lower red support zone.
Unless this level breaks, initiating short positions at current levels would be considered premature.
📌 Conclusion
After the breakout, the Nasdaq is nearing overbought territory; a cautious stance is advised.
Longs are more favorable on a pullback entry strategy.
Shorts only become valid if 21,408 is breached with strong downside momentum.
Any additional pivot zones or trade setups will be shared in future updates.

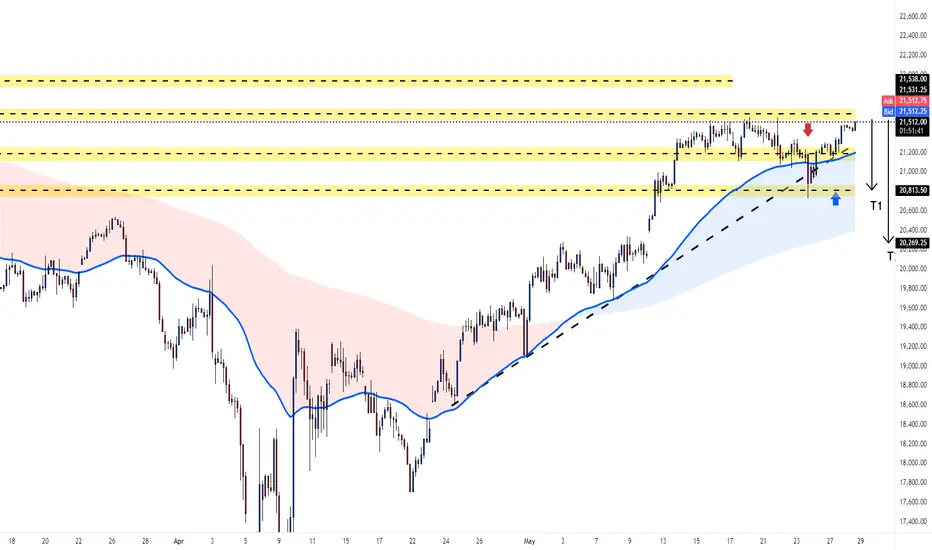
This is a 4-hour chart of the NASDAQ 100 index (NQ1!). Analysis:
Trend and Support: The chart shows an ascending trendline (black dashed line) acting as support, with the price recently bouncing off it around the 20,260 level. This suggests the uptrend remains intact for now.
Price Action: The price has pulled back from a high near 21,500 ish and is currently consolidating around 21,000. The recent bounce off the trendline indicates potential buying interest at lower levels.
Key Levels:
Resistance Zone: The yellow shaded area between 21,200 and 21,550 is a resistance zone where the price previously struggled.
Support Zone: The area around 20,800–20,900 (another yellow shaded area) may act as immediate support if the price dips again.
Targets: T1 (20,813.50) and T2 (20,626.25) are marked as potential downside targets if the price breaks below the trendline. On the upside, breaking above 21,550 could target 21,800 (top of the resistance zone).
Market Sentiment: The order book on the right shows the current ask at 21,531.25 and bid at 21,506.25, with a tight spread indicating decent liquidity. The price is slightly below the ask, suggesting some selling pressure or hesitation to break higher immediately.
Potential Scenarios:
Bullish: If the price holds above the trendline and breaks 21,400, it could rally toward 21,800 or higher.
Bearish: A break below the trendline and 20,800 support could lead to a deeper pullback toward T1 (20,813.50) or T2 (20,626.25).
Insight: The NASDAQ 100 is in an uptrend but facing resistance near 21,400. Watch for a breakout above this level for bullish confirmation or a break below the trendline for a bearish move. The 20,800–20,900 zone is a key support to monitor.
25.05.28 nasdaq analysis🕒 NASDAQ - 30-Minute Chart Analysis
Looking at the 30-minute chart, we can see an ascending triangle pattern forming on NASDAQ.
If resistance is broken to the upside, it would normally make sense to approach with a bullish bias. However, the presence of this pattern in this context feels somewhat off, so even if a breakout occurs, I plan to let it go without entering.
Currently, my plan is to enter a short position if the price breaks below the red box area, which represents the ascending trendline.
The target for this trade is the blue box zone.
If the bottom of the blue box is broken as well, I will approach today’s market with a bearish strategy only.

Nasdaq 100. Mistakes and Daily Orderflow 27.05.25Covered the mistakes that I have made while reading the price. Wanted the shorts although the daily and the 4H suggested bullish price action. The good think was didn't forced. Just left the market after booking partials and breakeven
Post that took one long towards the Volume Imbalance

NASDAQ got the 4H MA50 confirmation it neededNasdaq (NDX) has been trading within a Channel Up since the April 21 bottom and last week it unfolded its latest technical Bearish Leg.
As the 4H RSI bottomed on the 30.00 oversold barrier and the 4H MACD formed a Bullish Cross, that Leg bottomed and today the index gave the confirmation of the new Bullish Leg by breaking above its 4H MA50 (blue trend-line).
This is similar to the April 21 bottom, so we expect at least a minimum of +9.18% rise on the current Bullish Leg, which gives a 22500 short-term Target.
-------------------------------------------------------------------------------
** Please LIKE 👍, FOLLOW ✅, SHARE 🙌 and COMMENT ✍ if you enjoy this idea! Also share your ideas and charts in the comments section below! This is best way to keep it relevant, support us, keep the content here free and allow the idea to reach as many people as possible. **
-------------------------------------------------------------------------------
Disclosure: I am part of Trade Nation's Influencer program and receive a monthly fee for using their TradingView charts in my analysis.
💸💸💸💸💸💸
👇 👇 👇 👇 👇 👇

NASDAQ: Needs to reclaim the 4H MA50.Nasdaq is bullish on its 1D technical outlook (RSI = 62.436, MACD = 467.180, ADX = 28.529) as it maintains its long term bullish trend through the Channel Up pattern, which recently is transitioning into a Rising Wedge. We are willing to turn bullish again upon a 4H candle closing over the 4H MA50 and aim for a +11.17% rise (TP = 23,000) on the HH trendline, like the April 21st rebound did.
## If you like our free content follow our profile to get more daily ideas. ##
## Comments and likes are greatly appreciated. ##

Weekly Outlook on Nasdaq 100, S&P 500, Dow Jones 30Expecting range bound consolidations on Index triad. High Resistance. Not expecting any further monthly highs. Want Internal Liquidity which means shorts. But the daily and the weekly are opposing each other.

2025.05.25 nasdaq weekend analysis📊 Friday Market Recap & Analysis
As previously mentioned, the trend had shifted downward, and I advised against taking long positions—short bias only.
Although the uptrend line was broken twice, one break was a fakeout and the price pulled back up.
Eventually, the red box support zone was broken, and the target was hit with a max drop of $363, resulting in a profit of around $7,260 per contract.
A rebound occurred as the US market opened, but a short-term trendline break at the close suggests Monday's market may lean downward—unless strong positive news emerges over the weekend.
🕰 Weekly Chart View (NASDAQ)
The weekly candle closed just slightly above the previous high, but not significantly—likely meaningless.
The 20-week MA is currently at 20,272.
If the NASDAQ breaks the recent low, there’s a high chance it could drop down to the 20-week MA + top of the Ichimoku Cloud.
📅 Daily Chart View (NASDAQ)
Buying pressure hasn’t fully disappeared yet—NASDAQ is still sitting above the 20-day MA, meaning the trend could revive.
However, if the 20-day MA (around 20,647) is broken, the price may fall into the orange box supply zone.
Historically, we’ve seen a box range movement between 20,400–19,300, so a break of the 20-day MA could lead to a repeat.
For long re-entry, the purple box zone (19,300–18,980) is a strong support area to watch.
✅ Conclusion
・Unless major news comes out over the weekend, Monday’s market will likely retest the 20-day MA.
・If that level breaks, the next drop could be around $1,000, which is significant.
・As always—wait patiently and take the trade when the market gives it to you.

Stock Markets, Gold, Silver: Run With The Bulls!In this Weekly Market Forecast, we will analyze the S&P 500, NASDAQ, DOW JONES, Gold and Silver futures, for the week of May 25 - 31st.
The Stock Markets are bullish, so run with valid buy setups when they form.
Gold and Silver are relatively strong. With tensions in Gaza and Iran, this is expected. Valid buys should be taken.
Crude Oil is a tad bearish due to US inventories, so valid sells are warranted in the short term.
Enjoy!
May profits be upon you.
Leave any questions or comments in the comment section.
I appreciate any feedback from my viewers!
Like and/or subscribe if you want more accurate analysis.
Thank you so much!
Disclaimer:
I do not provide personal investment advice and I am not a qualified licensed investment advisor.
All information found here, including any ideas, opinions, views, predictions, forecasts, commentaries, suggestions, expressed or implied herein, are for informational, entertainment or educational purposes only and should not be construed as personal investment advice. While the information provided is believed to be accurate, it may include errors or inaccuracies.
I will not and cannot be held liable for any actions you take as a result of anything you read here.
Conduct your own due diligence, or consult a licensed financial advisor or broker before making any and all investment decisions. Any investments, trades, speculations, or decisions made on the basis of any information found on this channel, expressed or implied herein, are committed at your own risk, financial or otherwise.

#NQ1! "E-Mini Nasdaq 100" Index Market Bullish Robbery Plan 🌟Hi! Hola! Ola! Bonjour! Hallo! Marhaba!🌟
Dear Money Makers & Robbers, 🤑 💰💸✈️
Based on 🔥Thief Trading style technical and fundamental analysis🔥, here is our master plan to heist the NQ1! "E-Mini Nasdaq 100" Index Market Heist. Please adhere to the strategy I've outlined in the chart, which emphasizes long entry. Our aim is to escape near the high-risk YELLOW MA Zone. It's a Risky level, overbought market, consolidation, trend reversal, trap at the level where traders and bearish robbers are stronger. 🏆💸"Take profit and treat yourself, traders. You deserve it!💪🏆🎉
Entry 📈 : "The heist is on! Wait for the Crossing previous high (19800) then make your move - Bullish profits await!"
however I advise to Place Buy stop orders above the Moving average (or) Place buy limit orders within a 15 or 30 minute timeframe most recent or swing, low or high level for Pullback entries.
📌I strongly advise you to set an "alert (Alarm)" on your chart so you can see when the breakout entry occurs.
Stop Loss 🛑: "🔊 Yo, listen up! 🗣️ If you're lookin' to get in on a buy stop order, don't even think about settin' that stop loss till after the breakout 🚀. You feel me? Now, if you're smart, you'll place that stop loss where I told you to 📍, but if you're a rebel, you can put it wherever you like 🤪 - just don't say I didn't warn you ⚠️. You're playin' with fire 🔥, and it's your risk, not mine 👊."
📍 Thief SL placed at the nearest/swing low level Using the 2H timeframe (19200) Day trade basis.
📍 SL is based on your risk of the trade, lot size and how many multiple orders you have to take.
🏴☠️Target 🎯: 20500
🧲Scalpers, take note 👀 : only scalp on the Long side. If you have a lot of money, you can go straight away; if not, you can join swing traders and carry out the robbery plan. Use trailing SL to safeguard your money 💰.
💰💵💸NQ1! "E-Mini Nasdaq 100" Index Money Heist Plan is currently experiencing a bullishness,., driven by several key factors. .☝☝☝
📰🗞️Get & Read the Fundamental, Macro Economics, COT Report, Geopolitical and News Analysis, Sentimental Outlook, Intermarket Analysis, Index-Specific Analysis, Future trend targets with Overall outlook score... go ahead to check 👉👉👉🔗🔗🌎🌏🗺
⚠️Trading Alert : News Releases and Position Management 📰🗞️🚫🚏
As a reminder, news releases can have a significant impact on market prices and volatility. To minimize potential losses and protect your running positions,
we recommend the following:
Avoid taking new trades during news releases
Use trailing stop-loss orders to protect your running positions and lock in profits
💖Supporting our robbery plan 💥Hit the Boost Button💥 will enable us to effortlessly make and steal money 💰💵. Boost the strength of our robbery team. Every day in this market make money with ease by using the Thief Trading Style.🏆💪🤝❤️🎉🚀
I'll see you soon with another heist plan, so stay tuned 🤑🐱👤🤗🤩

Dollar Bottoming Out Pretty solid bottom for USD. I am assuming more money flowing into USD when a correction is about to happen. We see that this morning when we had that quick drop from 7:00 - 8:00 EST. US10Y rate dropping, USD rising, and equity declining. Back to the old game. So I am suggesting long USD, and short equities, given the recent comeback is way too ridiculous and needs a correction now.

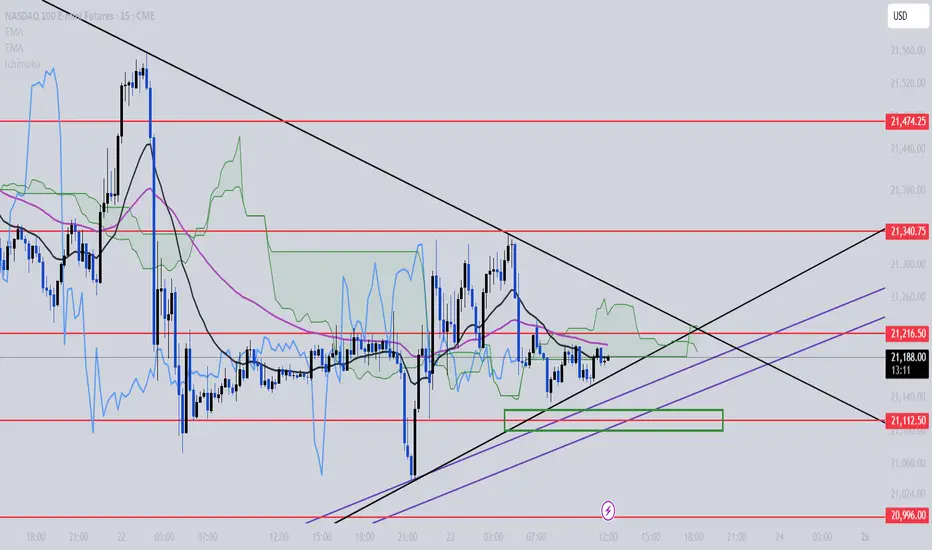
205.05.23 nasdaq analysis
📊 Result of Yesterday’s Trading Strategy
The break of the upward support trendline triggered a sharp drop, delivering solid profits even before the U.S. session opened.
With 1 contract, this setup yielded approximately $2,000 profit, making for an early finish to the day.
📉 Current NASDAQ Situation
The Nasdaq is on the verge of breaking below the ascending trendline.
Even though it pretends to rise, it consistently gets pushed down — suggesting the bullish momentum is close to being exhausted.
Thus, I will not consider long positions today and will continue to approach the market conservatively.
Today's trading strategy:
If 21112 is broken downward, it will likely enter a corrective phase.
If that happens, I plan to continue shorting with targets down to 20827~20667.
🎯 The target range is wide because if a sharp drop does occur, the strength behind it may lead to a deeper correction, making it worth holding for the extended target.
✅ Conclusion
• It's better to focus on short strategies rather than long positions for now.
• To enjoy the weekend, taking the day off from trading might also be a smart move today.