A deep dive into Wyckoff Accumulation Schematic #1.Greetings, I find my previous communication regarding the US dollar was perhaps insufficient in elaborating my viewpoint. Therefore, I have resolved to delve deeper in this correspondence, presenting a thorough analysis to substantiate my conviction that the US dollar is poised for a considerable mark-up phase, from a technical standpoint.
I must clarify that I am not an advocate of fundamental analysis; my interests lie predominantly within the realm of technical patterns. I envisage this upward movement initiating around August 10th, which coincidentally corresponds with a significant Consumer Price Index reading.
---
Foremost, let me clarify that my analysis is grounded in the original Wyckoff Accumulation Schematic #1, composed of approximately five distinct phases. It is my endeavor to convey an understandable summary of these phases to you, my esteemed reader.
↓
↓
◆::◇::◆::◇::◆◆::◇::◆::◇::◆
Phase A:
In the Wyckoff Method represents the end of a downward trend in a stock's price. It starts with a significant sell-off (Selling Climax), followed by a brief price recovery (Automatic Rally), and then a less intense sell-off (Secondary Test). These events establish a trading range for the stock price. If the Secondary Test drops below the Selling Climax, further price drops or extended low prices can be expected.
◆::◇::◆::◇::◆◆::◇::◆::◇::◆
Phase B:
In Wyckoff's Method is a period of "building a cause," essentially preparing for a new upward trend. Institutions and professional investors start buying more shares at relatively low prices, anticipating a future price rise (the effect). They balance this buying with some short sales to keep the price from rising too fast. During this phase, the price often fluctuates within the trading range established in Phase A, with many Secondary Tests and false price breaks called "upthrusts." This phase can take a long time as big players slowly accumulate shares. As more shares are bought up, the volume of shares traded during price downswings tends to decrease, signaling the end of Phase B and the start of Phase C.
◆::◇::◆::◇::◆◆::◇::◆::◇::◆
Phase C:
In Wyckoff's Method is where the stock price is tested to see if it's ready for an upward trend. This phase often includes a "spring", a sudden drop below the established trading range that quickly reverses. This can trick late sellers into thinking the downtrend is resuming when it's actually the start of an uptrend. A successful spring represents a good opportunity to buy as it signals the stock is likely to start going up. If a "Sign of Strength" (SOS), a noticeable upward price movement, appears after the spring, it confirms this analysis. Sometimes, supply testing can happen without a spring, making Phase C harder to identify.
◆::◇::◆::◇::◆◆::◇::◆::◇::◆
Phase D:
In Wyckoff's Method is when demand starts consistently exceeding supply, leading to a dominant upward trend. This phase is marked by "Signs of Strength" (SOSs), or notable upward price movements on high volume, and "Last Points of Support" (LPSs), smaller upward price movements on lower volume. The price will typically reach the top of the trading range during this phase. The LPSs are generally good opportunities to start or add to long positions as they suggest the price is likely to continue rising.
◆::◇::◆::◇::◆◆::◇::◆::◇::◆
Phase E:
In Wyckoff's Method is when the stock price leaves the trading range and begins a clear upward trend, with demand in full control. Any price drops during this phase are usually brief. New higher-level trading ranges can form during this phase as investors take profits and large operators buy more shares, serving as "stepping stones" towards higher prices. This phase makes the price rise visible to all market participants.
◆::◇::◆::◇::◆◆::◇::◆::◇::◆
Glossary of the Wyckoff terms used in the post:
PS (Preliminary Support):
A point where significant buying starts to happen after a prolonged price decrease. The increased volume and price spread suggest the downtrend might be ending.
SC (Selling Climax):
The peak of selling activity, often involving panic selling by the public. Large investors absorb this selling, which can stabilize or increase the price. The price often closes well above the low point, reflecting these large investors' buying activity.
AR (Automatic Rally):
A price increase that happens because selling pressure has significantly decreased. This rally, further driven by short covering, helps set the upper boundary of the accumulation trading range.
ST (Secondary Test):
The price revisits the area of the selling climax to test if demand outweighs supply. To confirm a bottom, the volume and price spread should decrease significantly as the price approaches the support level. It's common to have multiple secondary tests after a selling climax.
Test:
Large operators or professional investors test the market for supply throughout the trading range and at key points during a price advance. If a test reveals considerable supply, the market might not be ready for a markup. A spring is often followed by tests, and a successful test (indicating impending price increases) typically forms a higher low on lower volume.
SOS (Sign of Strength):
This is a price advance on an increasing spread and relatively higher volume. An SOS often follows a spring, which validates the analyst’s interpretation of that action.
LPS (Last Point of Support):
This is the low point of a reaction or pullback after an SOS. Reverting to an LPS implies a pullback to a support level, which was formerly resistance, on a decreased spread and volume. Despite the singular term, there may be multiple LPSs on some charts.
BU (Back-Up):
Coined by Robert Evans, a prominent Wyckoff method teacher, it's a metaphor for a pullback after an SOS, akin to "jumping across the creek" of price resistance and then "backing up to the creek." A back-up often precedes a significant price markup and can appear as a simple pullback or a new trading range at a higher level.
◆::◇::◆::◇::◆◆::◇::◆::◇::◆
I appreciate your time in perusing this analysis. In conclusion, I foresee the US dollar potentially reaching an upside target of approximately 110-111 into the end of this year.
Lastly, I invite you to revisit my prior substantial post on the US dollar, wherein I had the occasion to pinpoint "the top".
↓
💜
NQ1

bulls defending wellthe volume on NQ today was great, in a demand area. already showing strength. I this does not break out to the long side I'm not eating sugar for a month..

NASDAQ Small glimmer of hope as 1D making a MACD Bullish Cross.Nasdaq (NDX) recently broke below the Higher Lows trend-line of 2023, the trend-line from the start of the year that has been supporting the strong recovery. This created the conditions for further decline, especially since the 4H MA50 keeps the price action below it, but so far Support 1 (14430) is holding.
The above levels are those we will use as break-outs. A candle close below Support 1 will be a sell signal, targeting the 1D MA200 (orange trend-line) at 13900. Since however the 1D MACD is close to forming a Bullish Cross, the bullish momentum attract probabilities and if a candle closes above the 1D MA50, we will instead buy, targeting 15650 (Resistance).
The pattern since mid August is quite similar to the Arc formation of November - December 2022. After the 1D MA50 broke, it targeted the previous Resistance and even hit the 1.382 Fibonacci extension before the next pull-back.
-------------------------------------------------------------------------------
** Please LIKE 👍, FOLLOW ✅, SHARE 🙌 and COMMENT ✍ if you enjoy this idea! Also share your ideas and charts in the comments section below! This is best way to keep it relevant, support us, keep the content here free and allow the idea to reach as many people as possible. **
-------------------------------------------------------------------------------
💸💸💸💸💸💸
👇 👇 👇 👇 👇 👇

Trend reversal to the UPSIDE if Nq! Holds 100 EMA on DailyLooking at today's Bounce with high Volume, the Nasdaq futures have again reclaimed 100 EMA on the daily timeframe. There is a very high probability that Nasdaq Futures will go higher in coming days and test 50 day EMA. If it closes above 14,809 tomorrow, then this is the trend reversal and we are again in the bullish trend. Keep an eye on the 100 EMA, if it looses then there will be a lot of selling to the short side. As of now we are very bullish in coming days till Friday. And then we can analyze the closing of the week.

US is running a clinic on how to self-inflict financial woundsEarlier today I was on a conference call with traders examining the index price patterns and discussing the initial price action of The SP500 (INDEXSP: .INX) and the Nasdaq (INDEXNASDAQ: .IXIC) off their July highs. Currently my company is forecasting we revisit, and ultimately breach the October 2022 lows sometime in the first half of 2024. However, what the catalysts are to get us there is speculation. A black swan event of such some stature would need to unfold.
Mid conference call one of the attendees’ types into the zoom chat box, "McCarthy was just removed as speaker!" On the call was a collective...whoa!
I could understand some of you reading this article would say, so what! The US congress has been dysfunctional for some time now. Unfortunately, I would agree and could not find fault with such apathy. However, consider the unintended consequences of such a historic action. Never has a US speaker of the house been removed in such fashion.
What could develop into unintended consequences?
Which such acrimony and division in the lower chamber how can the house agree on anything? The hill conservatives in the house want to die on is the growing national debt. Whether that is disingenuous or not is not the point of this article. I'll let the political pundits argue that. I want to keep this article focused on what is directly related to the US markets.
Government Funding
Through some rare bipartisanship we averted a government shut down just this past weekend. Leading up to this weekend, the news media had all but written the obituary for a funded government through regular order. However, the legislation only funded the government for 47 days. That means it's possible we're back to worrying about a funded US government next month.
Rating Agencies
I have to admit when Fitch downgraded the credit rating of US government debt in August, I was skeptical of that decision. In retrospect, I now understand with all the self-inflicted uncertainty. However, do we need to now worry about Moodys and Standard & Poors. What is the consequence to interest rates if the US credit rating becomes under assault.
Interest Rates
The US markets have yet to acknowledge high interest rates are a structural headwind for company earnings and by extension, the market as a whole. Case in point, the below chart shows the yield on the 10y treasury.
10-year US Treasury Chart
Today, yields are higher than when at the October 2022 lows. The uncertainty created today by historically removing a US speaker of the house does not scream the US should be getting a lower rate on it’s debt. No, it most certainly means the opposite.
Mortgage Rates
12% of US GDP is housing. Aside from Fed action, if rates now go up because of the added uncertainty, we could easily go from positive to negative GDP. No US sector is more rate sensitive than housing.
Consumer Spending
If you thought housing at 12% of GDP was large, the consumer represents 70%. From mortgages, to credit card debt, the consumer was already starting to slow. Higher rates due to uncertainty will cause the consumer recoil, and that's the ballgame.
I could go on about current labor strikes in America and how that could change the employment outlook and the economy on a dime. I could discuss in depth the quantitative tightening action of the federal reserve. All concerns we're currently trying to weigh its impact on the economy.
Now we have to deal with this new added uncertainty. It appears in the US we know how to run a clinic on self-inflicted wounds.
NQ: Downside target 14450 is a buyNQ should find support at 14450 which should provide a relief bounce to 15190.

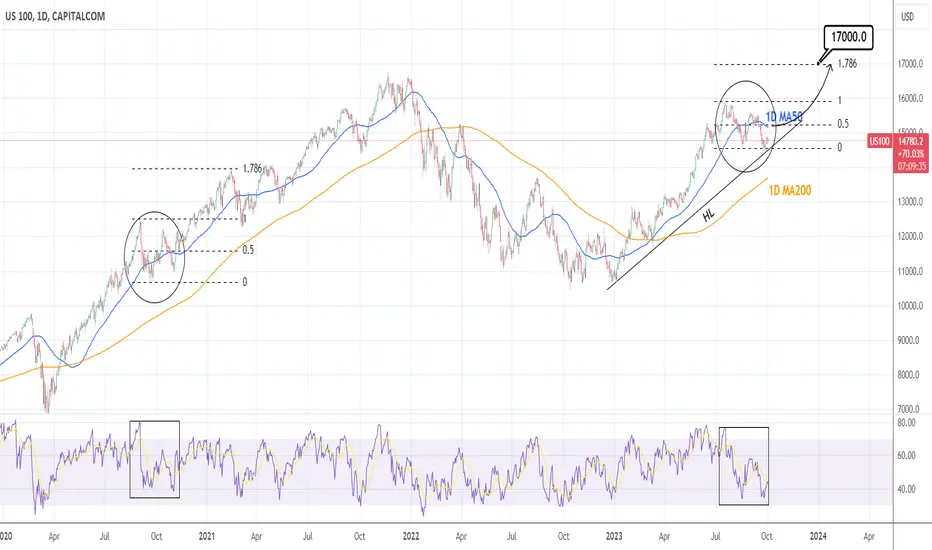
NASDAQ: Can hit 17,000 if the 1D MA50 breaks again.Nasdaq remains bearish on the 1D timeframe (RSI = 40.412, MACD = -138.180, ADX = 35.654) but it is on the HL trendline, the supporting trendline that emerged on the December 28th 2022 low. According to the 1D RSI, comparisons can be made with the September-October 2020 consolidation fractal around the 1D MA50, following the COVID recovery. After the 1D MA50 got crossed over for the second time, the index went on to reach the 1.786 Fibonacci extension level before the next consolidation.
If the HL holds and the index breaks over the 1D MA50 again, we will have a strong long term bullish case in our hands and target 17,000 (Fibonacci 1.786).
## If you like our free content follow our profile to get more daily ideas. ##
## Comments and likes are greatly appreciated. ##
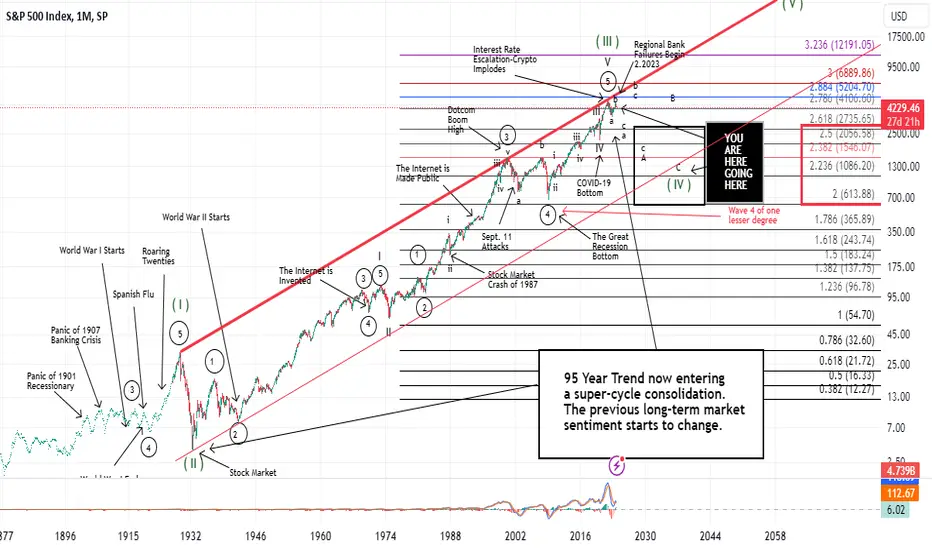
Are the Bears about to get BOLD?In my latest installment of the repeating Sentiment chart, we get a front row seat on how trader sentiment ebbs and flows with price action. Once we hit the target of 4172-4180, that will be a function of the bearish thesis getting aggressive.
A complete unwinding of the utter junk spewed on CNBC a month ago. New highs possible? Soft landing? The magnificent seven? I stand by the comment I made in my trading room yesterday... CNBC is the most detrimental content I professional trader can ingest.
Why is Tom Lee not on CNBC today? LOL...
Stay safe out there.
Chris

NQ1! 1HR TIMEFRAME 10/2-10/3Link to chart: www.tradingview.com
Sideways action staying above the blue trendline created from a few weeks ago of hitting a recent support level.
There are major news events to end the week and with rumors of a GOVT shutdown, I am expecting a huge squeeze towards end of the week.
My area of watch is 14850s to 14820s.
BULLS: Maintain over 14850, a possible move to 15200s.
BEARS: Break and retest 14850, a possible move to 14650-14700s.

Nasdaq Futures to test 50EMA on dailyThere is a very high chance that Nasdaq futures can test 50-day EMA on the daily Level tomorrow since today was an inside day. It may get rejected on the 50 day EMA. If Futures can hold above 15050 level that is prior day's range high, then there is a very high probability of testing the 50EMA tomorrow.

NASDAQ Double bullish targetNasdaq / US100 is consolidating around the 4hour MA50. It is a similar Cup and Handle pattern with August 24th.
Buy and target 15050 (4hour MA200). Then wait for a 1day pull back. Re-buy and target 15330 (Fibonacci 0.382) under the Falling Resistance.
RSI patterns identical, both showing we are in the phase of the 4hour MA50 consolidation.
Previous chart:
Follow us, like the idea and leave a comment below!!

Day Trade Market Condition oct 02, 2023Day Trade Market Condition oct 02, 2023
levels for NQ ES CL BTC
watch the table left side for trade, right side for trend

Nasdaq is following in the footsteps of #MMMNYSE:MMM
CME_MINI:NQ1!
OANDA:NAS100USD
PEPPERSTONE:NAS100
I noticed the relationship between the #MMM movement in the past and the Nasdaq movement now. If based on the #MMM chart, then the goal for us is about 9000 points.

NQ1! NAS100USD NASDAQ Analysis dated 2023 Oct 02NQ1! NAS100USD NASDAQ 2023 Oct 02
Analysis from 02 Sep 2023 short scenario worked out well for the month.
- market broke down the upward channel (black dash)
- Supply is present on Friday's bar
- Wait for reaction to demand line of upward channel (blue highlight, set alarm)
Possible scenarios:
1) Market returns into upward channel and is supported = Long on test and accept
2) Short on rejection if bottom of channel becomes resistance.
Price Reaction Levels
Short on Test and reject | Long on Test and Accept
16255 15801 15283 14804 13960
*Longer term: 13350 support must hold for long trend to be intact.
Price/Volume/Trend Analysis:
Weekly: Ave vol up bar close level with previous bar = NTC, Minor support
Daily: S>D weak close up bar.
*NTC = Non-Trend Changing | PTC: Potential Trend Changing
Like and follow if you find this useful | *For education purpose only.
Have a profitable trading week.

all is shortive been messing wiht intraday trading, so havent been able to publish a lot on that.
Now may I say that even with some bullish moves, all is telling me to short.

Day Trade Market Condition sep 29, 2023Day Trade Market Condition sep 29, 2023
levels for NQ ES CL BTC
watch the table left side for trade, right side for trend
note last two day Dynamic Volume Profiles
