NQ1

Nasdaq’s Next Move Revealed This Week – Don’t Miss the Breakout Following a strong surge at the start of the trading week, the Nasdaq reached a new high since March 26th. At this juncture, I anticipate a potential pullback before any sustained upward movement. My analysis suggests monitoring for a retracement to the New Week Opening Gap (NWOG), where price action will likely provide critical insights. I see two probable scenarios:
1. A move to the NWOG, followed by a strong bounce, potentially targeting a new all-time high, as some market commentators have suggested.
2. A weak reaction at the NWOG, leading to a breakdown below this level, with 16,000 as the next key support target.
This week's price action will be pivotal in determining the Nasdaq's near-term direction. I recommend close observation of these levels and disciplined risk management when positioning for either outcome.


2025.05.20 nasdaq analysisDuring the European session, NASDAQ maintained a downward trend and broke below the 21187 level, as shown here:
This movement suggested a potential shift toward a bearish direction.
However, after that, NASDAQ started forming an upward trend and moved sideways. Eventually, the resistance trendline was broken in the blue box area, which you can see here:
This breakout indicated a short-term trend reversal.
The moment this trend reversal occurred coincided with the U.S. market open, accompanied by a significant surge in trading volume that led to a strong upward move.
At this point, the U.S. session closed with a new high compared to the previous pattern, suggesting that the trend has turned bullish.
However, based on the corrective action seen during the Asian session, it seems that the Asian market is not fully accepting the upward momentum.
Here is the current NASDAQ pattern:
It shows an expanding pennant pattern, with both the highs and lows widening over time.
As of now, it is highly likely that the market will continue to move with volatility in both directions until a decisive breakout occurs.
You can view the current situation in more detail here:
In terms of the upside, even though the price could theoretically reach 22000, it doesn’t hold much significance without confirmation from historical data.
Therefore, I recommend taking buy positions only if the market shows a strong inflection point similar to yesterday’s move.
Even if the recent low of 21112 is broken, the price is still within the expanding pennant pattern, and a rebound remains possible.
A conservative bearish view would only be valid if the price breaks below the previous consolidation area that formed just before the strong rally—specifically the black box range, which is around 20723–20680.
Summary:
There’s a high probability of stop-hunting in the current range.
Whether buying or selling, it's recommended to enter only when a clear setup is provided.
Don’t rely on hope that the price will return to your average entry. If the market chooses a direction during this phase, it could lead to unrecoverable losses.
This could be a highly profitable zone if handled correctly, but trading without conviction is like a drug.
Today is not the only opportunity.

NASDAQ Critical level for short-term.Nasdaq (NDX) is testing a strong short-term Support Cluster, the Lower Lows trend-line and the bottom of the 1H Channel Up. Being below the 1H MA50 (blue trend-line), the trend is right now neutral until one of the two levels breaks.
If the index breaks above the 1H MA50, we will turn bullish again, targeting 22200 (+5.70% from the current Low, the minimum % rise in the past month).
If it breaks below the Support Cluster, we will turn bearish, targeting the 1H MA200 (orange trend-line) at 20800.
-------------------------------------------------------------------------------
** Please LIKE 👍, FOLLOW ✅, SHARE 🙌 and COMMENT ✍ if you enjoy this idea! Also share your ideas and charts in the comments section below! This is best way to keep it relevant, support us, keep the content here free and allow the idea to reach as many people as possible. **
-------------------------------------------------------------------------------Disclosure: I am part of Trade Nation's Influencer program and receive a monthly fee for using their TradingView charts in my analysis.
💸💸💸💸💸💸
👇 👇 👇 👇 👇 👇


2025.05.19 nasdaq analysis🟧
At the close of Friday's session, the daily and weekly candle closed around 21500.
However, in the final hour after market close, Nasdaq broke below the orange trendline.
Then, at the start of Monday’s session, a sharp gap down occurred.
The gap was briefly filled before Nasdaq retested the broken trendline and continued to fall.
🔗
🕒
Nasdaq hasn't confirmed a downtrend yet.
The key is whether 21187, which has held since May 13th, will break.
If it fails, price may fall below the value area it’s held for a week.
Downside targets if 21187 breaks: 21000, 20765.
🔗
🟩
Bullish scenario isn’t dead—this may be a temporary pullback.
Key entry signal: Break above the 15-min 20 EMA.
Target zones vary by strength:
Conservative TP: 30-min 20 EMA
Aggressive TP: 21415, possibly even 21500 if today’s high is broken
🔗
📌 Conclusion
Monday started with a gap down, but support is still holding.
Break below 21187 = potential trend reversal + end of box-range movement.
Buy trades should be cautious & short-term until confirmation of strength.

Buyers Stand By And Be Ready! In this Weekly Market Forecast, we will analyze the S&P 500, NASDAQ, DOW JONES, Gold and Silver futures, for the week of May 18 - 24th.
The Stock Indices remain bullish. So buys are warranted for next week.
Gold and Silver pulled back last week on news of Trump's deals and sanction relief. But Gold is at support now. Watch for bullish setups for buys or a bearish market structure shift before seeking sells.
Crude Oil is near buy side liquidity. Look for short term buys before a longer term, high probability sell setup to form.
Enjoy!
May profits be upon you.
Leave any questions or comments in the comment section.
I appreciate any feedback from my viewers!
Like and/or subscribe if you want more accurate analysis.
Thank you so much!
Disclaimer:
I do not provide personal investment advice and I am not a qualified licensed investment advisor.
All information found here, including any ideas, opinions, views, predictions, forecasts, commentaries, suggestions, expressed or implied herein, are for informational, entertainment or educational purposes only and should not be construed as personal investment advice. While the information provided is believed to be accurate, it may include errors or inaccuracies.
I will not and cannot be held liable for any actions you take as a result of anything you read here.
Conduct your own due diligence, or consult a licensed financial advisor or broker before making any and all investment decisions. Any investments, trades, speculations, or decisions made on the basis of any information found on this channel, expressed or implied herein, are committed at your own risk, financial or otherwise.

E mini Nasdaq 100. Weekly walkthroughWeekly walkthrough on NQ. Huge gap up and continuation weekly profile towards the Major Buyside Internal Liquidity

2025.05.16 nasdaq analysis
This is the briefing result for Nasdaq as of yesterday.
The briefing began during the yellow box phase.
At that time, I clearly mentioned that the market had entered a short-term correction phase and emphasized the importance of the 21187 support level marked by the red box.
As seen in the chart, the 21187 level was not broken to the downside and instead held as support, followed by a rebound.
This reaffirms the significance of the 21187 level.
Afterward, the trend continued upward.
Looking at the 15-minute chart, there have been consistent lower wicks breaking below support,
which decreases the reliability of a short opportunity simply from a trendline break.
At this point, the trust in a sell-off purely based on trendline breakdown is weakening.
This chart outlines a short-term sell strategy.
As previously mentioned, while the short-term uptrend line has become less reliable,
if we see a break of the trendline and a drop below 21376,
we could expect a pullback toward the blue box area around 21320~21300.
Thus, a short-term short strategy may be valid in this scenario.
From a daily chart perspective, Nasdaq closed with a green candle again,
but the shape of the candle resembles a doji with similar upper and lower wicks.
What we need to focus on here is that Nasdaq has re-entered a high-volume price area (supply zone),
but since no clear direction has formed, many positions seem to be closed off whenever the price pushes higher.
On the downside, since the 21187 support level has held,
this remains the most critical level.
If 21187 is broken downward, it could mark the beginning of a daily-level correction phase.
Conclusion:
No clear direction yet.
While the direction was upward until yesterday, the doji close suggests caution.
For further bullish movement, a confirmed close above the current supply zone is essential.
If the market corrects downward, watch for a break below 21187.
The current price action is forming a channel pattern with higher lows and higher highs.
If traded correctly within this range, good opportunities may arise.

Divergence Since 2020 - What Happens When Bonds Continue?When Stocks & Bond Move Opposite Direction what does it mean?
We have observed a divergence between the stock and bond markets since 2020. While U.S. Treasury bonds entered a bear zone, the stock markets continued their upward climb. What are the implications of this decoupling?
Will the stock market resume its uptrend and hit new highs? Or is this merely a retracement before further downward pressure?
A healthy, three-way interdependent relationship occurs when the economy, bonds, and stocks move in the same direction. When investors have confidence in the U.S. economy, they tend to invest in long-term bonds, which it usually will benefits the stock market.
This alignment was evident between 2000 and 2020, during which bonds and stocks moved largely in tandem.
However, from 2020 onward, bonds began declining—signaling a loss of investor confidence in the economy. Technically, this should exert downward pressure on stocks as well.
Yet, we are witnessing a divergence: Where U.S. Treasury bonds have fallen while stocks have continued to rise.
When such a divergence surfaces, it signals the need for caution in our approach in the stock markets.
What could be the other reasons why US T-bond has peaked in 2020 and depreciated by 44% since then?
Micro E-mini Nasdaq Futures and Options
Ticker: MNQ
Minimum fluctuation:
0.25 index points = $0.50
Disclaimer:
• What presented here is not a recommendation, please consult your licensed broker.
• Our mission is to create lateral thinking skills for every investor and trader, knowing when to take a calculated risk with market uncertainty and a bolder risk when opportunity arises.
CME Real-time Market Data help identify trading set-ups in real-time and express my market views. If you have futures in your trading portfolio, you can check out on CME Group data plans available that suit your trading needs www.tradingview.com
Trading the Micro: www.cmegroup.com

US10 YR Yield Weekly Chart Analysis: NFAUpdate: May 15, 2025
-As per my last update(April 5, 2025) about the gap between March 24th candle and March 31st candle that any candle body close above that gap will invert that gap from resistance to support and Upside target will be Jan 13, 2025 candle High
- We had a candle body close above that gap and now its acting like support.
-Now i am expecting the bullish trend to continue and long term upside target is Jan 13, 2025 candle High and Short term upside target is April 7, 2025 candle high


NQ KEY ICT LEVELS - 14th MAY 2025Levels marked on the chart using my free indicator which marks out all of the ICT key levels which can be used for potential POIs where price might react

NQ KEY LEVELS - 14th MAY 2025Key levels marked by using low volume nodes for potential key levels where we may see price react.

ES NQ short tradewe will be testing NQ 21000
ES 5880
Targets are based on previous structure breakout line => upcoming resistance for our short = target

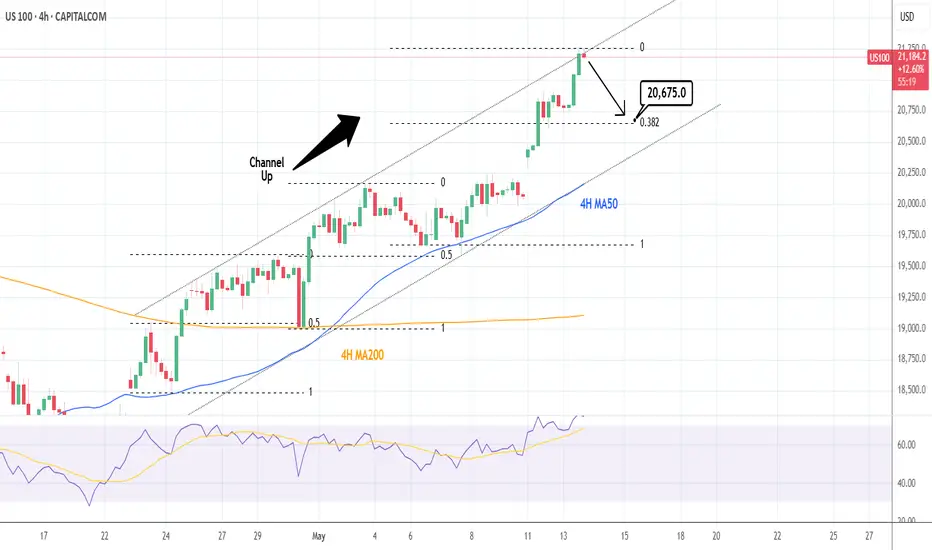
NASDAQ: Time for a 4H technical correction.Nasdaq is almost overbought on its 1D technical outlook (RSI = 69.775, MACD = 371.830, ADX = 37.524) and has reached the top of its 4H Channel Up. The two HH that the pattern has both pulled back to the 0.5 Fibonacci retracement level before the 4H MA50 provided the necessary support for the next bullish wave. Consequently we expect a small correction to at least the 0.382 Fib next (TP = 20,675).
See how our prior idea has worked out:
## If you like our free content follow our profile to get more daily ideas. ##
## Comments and likes are greatly appreciated. ##

NQ KEY ICT LEVELS - 13th MAY 2025Levels marked on the chart using my free indicator which marks out all of the ICT key levels which can be used for potential POIs where price might react

NQ KEY LEVELS - 13th MAY 2025Key levels marked by using low volume nodes for potential key levels where we may see price react.

NASDAQ broke above its 1D MA200 after 2 months! Target 22000.Nasdaq (NDX) broke today above its 1D MA200 (orange trend-line) for the first time in more than 2 months (since March 06), following the U.S. - Chine trade deal. This trend-line also had the March 26 rejection under its belt, which initiated the most aggressive part of the 'Trade War' correction.
The last time the index broke above its 1D MA200 on a similar pattern was when it was recovering after the bottom of the 2022 Inflation Crisis. The February 01 2023 break-out produced an instant rise to the 1.382 Fibonacci extension before a short-term correction to re-test the 1D MA200.
As a result, we expect 22000 (1.382 Fib ext) to come as early as this week before any discussions can be made for a new pull-back.
-------------------------------------------------------------------------------
** Please LIKE 👍, FOLLOW ✅, SHARE 🙌 and COMMENT ✍ if you enjoy this idea! Also share your ideas and charts in the comments section below! This is best way to keep it relevant, support us, keep the content here free and allow the idea to reach as many people as possible. **
-------------------------------------------------------------------------------
Disclosure: I am part of Trade Nation's Influencer program and receive a monthly fee for using their TradingView charts in my analysis.
💸💸💸💸💸💸
👇 👇 👇 👇 👇 👇

