NQ is in clear bear flagI didnt have much time on research today, busy day.
But I did spend some time on the NQ, as I didnt do NQ update for a while.
I will also add comments to this post after I do my other research and go through few others updates I follow.
So stay tuned, high chance this chart will get updated with extra comments several times.
So as you can see on the chart, we are in a small (compare to the rest of the year) bear flag and we are already in most overbought conditions for this year including TRIN number and volume.
My best extension (if it was not topped yet and they will push it higher before the elections) is at 12110-50NQ, with the top of the channel at 12250-300.
But first it has to close above recent highs - 11750NQ
I do expect a yo-yo style (outlined on the SPX yesterday) going into EOM and then Midterms.
But the ideal target for this year is actually at 8-8.2k zone!
I know it sounds crazy, but hey wasnt today's numbers crazy early this year?
Some are still in denial.
I do not call for a crash any longer, as we are out of that window astrologically and cyclically but I want to see another 25-35% cut from today's levels before this is over and we bounce hard into a bigger B wave
No new highs next several years at min, maybe after 2026 if not 2032. I do expect 1999 and 2009 pattern, check it out.
Again I might be wrong as anyone else out there, but this is my long term view, gotta stick to it till I see clear changes in trend.
My plan for the short term is the same, its short tomorrow (Im already swing short) into EOM or 1-2nd FOMC rate decision) which should spark a rally and ideally mark the temp bottom going into the Midterms.
They might make a big hike and stop for this year. Canada already increased .50 points instead of .75 points today, so FED can surprise.
After the Midterms is where it gets tricky, I think we will have a last move down into week of 21st of Nov low, that should mark the low for the year.
Can we extend into next year, yes we can, I will be updating you with my view going forward into mid of Nov.
If something not clear, just shoot a question below this post.
Here is zoomed in chart
Also please dont forget to press that 🚀 sign under this post to push it up in algos for others to discover.
Nq100

Watching the NASDAQ100 e-mini Weekly 200ema 11.5/11.7 resistanceWatching the NASDAQ100 Weekly 200ema 11.5/11.7 resistance
A move up & hold of that 11.5/11.7 looking for upside continuation to 12.1/12.5/12.8
Failure to retake that Weekly 200ema I look for more downside pressure & a possible retest of the lows at 10.5

NQ perfect am setup for those who followed!Well check those trend-lines held in am, was a perfect hit if you have followed this chart from yesterday.
Im swing short and not doing much till I see first extreme lows hit, then I will take profits and restrike higher
November is a panic month!

NQ clear bear flagBonds got destroyed today, I dont think the markets will hold for much longer.
Im waiting for EOD to add to short or wait for AHs

Nasdaq 100 3day 50ema/200ema Bear CrossoverWhat's up everybody? We are breaking down the Nasdaq100, 3day 50EMA/200EMA bear crossover that we just witnessed and we are going to break down when it took place throughout the history of the NQ100.
You can see the crossover here. Very important levels, very choppy day.
The last time we got this crossover on the 3day of the 50EMA/200 EMA was September 2008 . We got a 29% drop. Again, this is a conservative drop. This is well after the cross. We see -29%.
Prior to September 2008 we see the 3day 50EMA/200EMA bear crossover in February 2001(the tech bubble) and we see a huge -55% decline.
The 3rd time is the one out of the three times that we did not see a collapse. This was the bottom signal back in November 1990. That's why it's very important to watch these levels here.
So what we're looking at, we're trying to see if we can push up and hold the 20EMA on the Daily here. And again, if we zoom in, you can see this is the area where we got the bear crossover on the 3Day. Bulls want to see it push up and hold the Daily 20EMA at 11,252 and test the Daily 50EMA around 11,732.
Again, NQ100 testing the Daily 20EMA and is getting overbought on the stoch rsi. The last time we saw that, we saw the push down. Very interesting levels here.
_________________________________________________________
This content is for informational, educational and entertainment purposes only. This is not in any way, shape or form financial or trading advice.
Good luck, happy trading and stay chill,
2degreez

NASDAQ 100 E-MINI FUTURESNASDAQ 100 E-MINI FUTURES
At present it trades within a strong assembly area and if it comes out of it, we will get a certain direction that we can take and get into the strength that God willing.
NQ had only 50% retracement off todays lows!NQ is so much weaker then the ES, it got up to 50% retracement when ES had a perfect 61.8%
Also on this move down it made a lower low, def leading to my eyes.
ES has bullish setup, NQ has more room to go before its going to test the uptrend channel.
Todays close will be interesting. If weak, then tomorrow we can gap down

Just buy the NASDAQ, and thank me after!!! we have here a very good volume, which mean surely a good reversement
Just buy the NASDAQ, and thank me after.
It will be a good correction, and will give us a some easy profit.
Good Luck guys
#We-are-making-money-NQ

NAS100 USD NQ1! NASDAQ 2022 Oct 17 WeekNAS100 USD NQ1! NASDAQ 2022 Oct 17 Week
Very good channel support long and short from 11035.
Price still adheres to the downward channel.
Short preference remains.
Possible scenarios:
1) Long on temporary retracement / channel support
2) Short on channel resistance
3) Short on test of break on breakdown of channel support /
10305
Weekly = Ave vol down bar close off low = some demand present
Daily = High vol up bar followed by down bar = effort no result
H4 = Ave vold down bar close at low = minor supply
Price reaction levels:
Short on Test and Reject | Long on Test and Accept
13587 13200 12735
12140 11647 11117
10600 10359 10000
9748
Remember to Like and Follow if you find this useful.
Have a profitable trading week ahead.
(Updates will be on a fortnightly basis)

NQ is flaggingWatch for the failure or a breakout, it will be clear soon
Im not adding to my short till tomorrow's EOD.
MOC is on the buy side
Ideally we hold 3630ES and push to 3730 and fail, will check EOD to determine being long into tomorrow or not

NASDAQ 100 E-MINI FUTURESNASDAQ 100 E-MINI FUTURES :
A very strong and wonderful analysis as we said earlier that he broke the strong grandfather support area will come down and all these conditions have been achieved.

S&P500 2week 20ema/50ema Bear Crossover - Historic2degreez here. I am now eyeing the S&P500 2week 20ema/50ema Bear Crossover
It has historic significance as does the prior Weekly 20ema/100ema Bear Crossover that I have published previously.
This video shows a quick look back at the prior historic 2week 20ema/50ema bear crossovers and the subsequent moves down.
I also take a quick look at the NQ100 and how it is leading the way on these bear crossovers.
_________________________________________________________
This content is for informational, educational and entertainment purposes only. This is not in any way, shape or form financial or trading advice.
Good luck, happy trading and stay chill,
2degreez

NQ target zone for tomorrowI want to see at least 3% rally into Wednesday am max, ideally all tomorrow

Nasdaq 100 Analyze(10/05/2022)!!!Nasdaq moved as I expected ✅👇
Nasdaq was able to make an Expanding Triangle.
I expect the Nasdaq to go down at least to the🎯target🎯 I specified on the chart.
Nasdaq 100 Analyze, (NQ1!USD), Timeframe 2H⏰.
Do not forget to put Stop loss for your positions (For every position that you want to open).
Please follow your strategy, this is just my Idea, and I will be glad to see your ideas in this post.
Please do not forget the ✅' like '✅ button 🙏😊 & Share it with your friends; thanks, and Trade safe.

NASDAQ 100 E-MINI FUTURESNASDAQ 100 E-MINI FUTURES
He made a very strong landing and broke us the strongest strong demand zones that we have identified and this analysis is very strong and it is likely to continue landing to the lowest points

The price reaching a retracement areaThe price reaching a retracement area and a group of weak candles, which indicates a rise in the price

After breaking the last bottom with a higher top than it,After breaking the last bottom with a higher top than it, it gives us confirmation of the end of the downtrend
We expect the price to return to the second test and push higher after this candle is formed

SPY REVERSAL ANALYSIS go LONGAMEX:SPY
On this SPY 30-minute Chart I point out candlestick patterns, trendline breakout and volume spike leading me to conclude
that SPY is due to reverse to the upside. This appears to be a quality long trade setup. See the link for my other similar idea
at the far bottom. Trade well and often !

NQ has support at 11210-40I have my MNQ set to cover at 11240, will start buying in that circle on the chart


NQ is about to break from its triangleWatch this triangle to break one way or the other.
Im still looking for lower into tomorrow

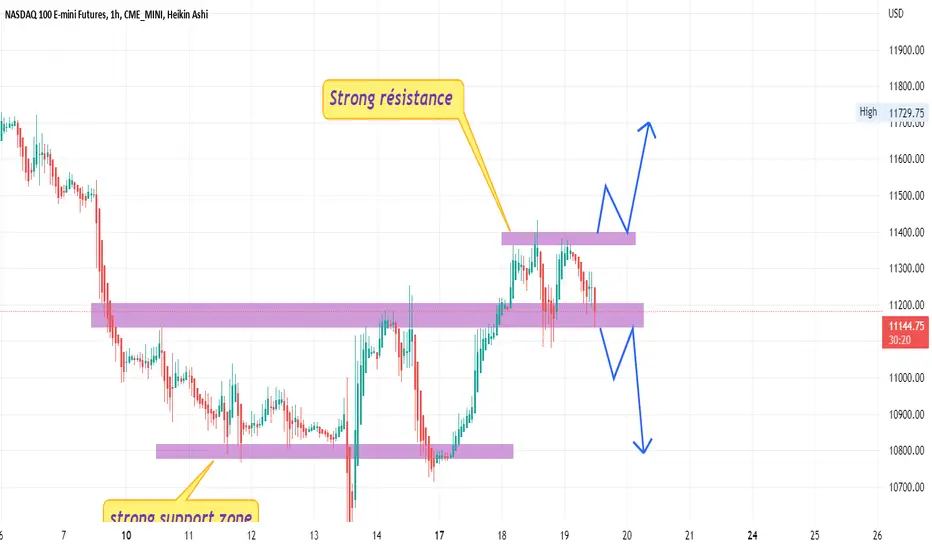
NASDAQ 100 E-MINI FUTURESWe have a very strong resistance that the market is incredibly respected and we also have a showcase area that the market is likely to reach today.

Nasdaq 100 Analyze!!!Nasdaq has moved down from the resistance zone by the Head and Shoulders pattern.
In the past week, Nasdaq was able to break the support line and is currently trying to complete its pullback.
I expect the Nasdaq to go down to the🎯targets🎯 I specified on the chart.
Nasdaq 100 Analyze, (NQ1!USD), Timeframe 4H⏰.
Do not forget to put Stop loss for your positions (For every position that you want to open).
Please follow your strategy, this is just my Idea, and I will be glad to see your ideas in this post.
Please do not forget the ✅' like '✅ button 🙏😊 & Share it with your friends; thanks, and Trade safe.
