NASDAQ 100 E-mini Futures NASDAQ 100 E-mini FuturesCME_MINI:NQ1!
NASDAQ 100 E-mini Futures
When the Nasdaq market is described as being in a downward direction, it means that the overall trend of the market is experiencing a decline. This downward movement is typically reflected in the broad-based Nasdaq Composite Index, which tracks the performance of thousands of stocks listed on the exchange
Nq100

NASDAQ 100 E-mini FuturesCME_MINI:NQ1!
Very strong ascent in the direction of the top peaks with the strongest penetration of the display area and resistance


Nasdaq 100 to 12400Fibo Weekly pivot point is around 12442
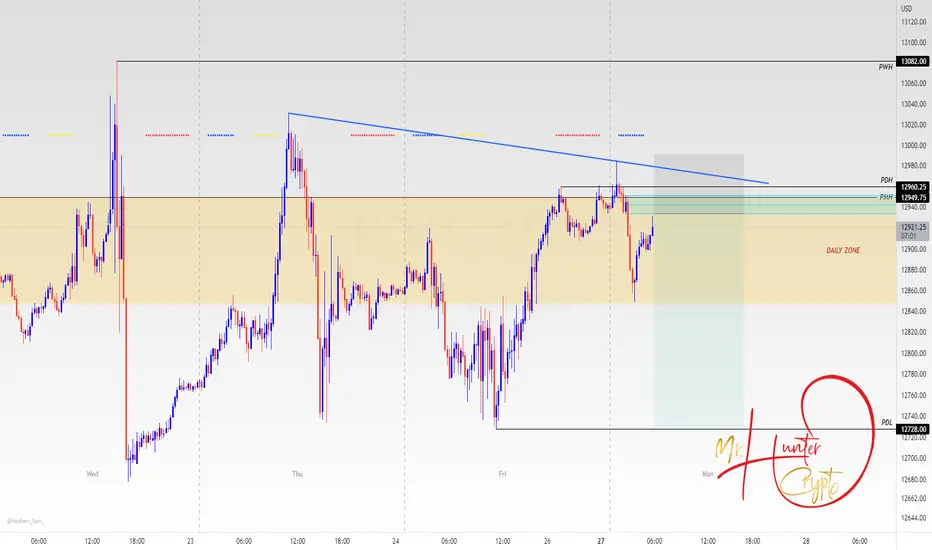
We can see that bearish trend is close to a support area si we could see a pull back

$QQQ $SPY Weekly Analysis Future Outlook | Support & Resistance - NASDAQ:QQQ & AMEX:SPY both are still in healthy daily uptrend no sign of red flags.
- QQQ Daily EMA 12 is a good support guide
- Still holding my SOXX short (in SOXS) due to relative weakness compare to QQQ
- Earnings coming up for NASDAQ:TSLA and NASDAQ:NFLX BCBA:TSMC


US100 BUYHey, the NASDAQ market is in a positive state. With a very good candle in the daily frame. Also, this correction came to the impulse wave. At 0.50%, which is a very strong Fibonacci ratio. Backed at 1820. Good luck, speculator . Note: If you like this analysis, please give your opinion on it. in the comments. I will be happy to share ideas. Like and click to get free content. Thank you

NASDAQ is Correcting - Don't Buy in Short Term
Technical Analysis:
- As you can see in the daily chart, in the very short term we've two possible paths - Path 1 and Path 2
- Today with actual data - the odds for Path 1 is 60% and the odds for Path 2 is 40%
- We expect to buy wave II in red completely around $8,000
Technical Analysis:
- H1 & H4 Right Side is Turning Down

US100 SELLHello NASDAQ Market. Strong resistance arrived. There is a high probability of going down. for correction. Although the index remains in a positive state with the gains it achieved before .Note: If you like this analysis, please give your opinion on it. in the comments. I will be happy to share ideas. Like and click to get free content. Thank you

NASDAQIn this trading position, we have a hunted level, and after being rejected, the price has formed a structural change, and when we return to it, we can expect a fall from this level, according to the daily resistance area.
BREAKDOWN ANALYSIS NASDAQ 17/03/2023dear traders nasdaq was up trend and the daily candle closed bullish so i expect nasdaq will correct this move
follow my instruction and respect the levels of price wait for the good opportunity
trade safe

US100 SELLHello . There is a high probability of falling. NASDAQ market. With the formation of a very negative candle in the four-hour timeframe. And it is a downward flag. With a very strong correction on the golden ratio of Fibonacc : Note: If you like this analysis, please give your opinion on it. in the comments. I will be happy to share ideas. Like and click to get free content. Thank you

Nq $nq #NQIts alot of news coming out today and the market been making alot of sideways action after it put in the over night low

NASDAG SELLPeace be upon you, merchants. The Nasdaq market is in a negative state. with a fracture. Model double BOTTOM. As well as breaking the bullish trend. There is a possibility of re-testing. The price is 122800. and re-descend. to the level of 11800

NAS100 potential retracement before short?We see a clear bearish continuation of the trend (Break of Structure) at 11960. We can see that the price went to a zone established recently at the previous trade at 11895, making it a good support level.
Our analysis speculate that we might see a continuation of the bearish trend after this retracement at the resistance level 12005, at then if it rejects, you might open a trade after 11978.5 and targeting 2 RRR with stop-loss at 12032 and take-profit at the closest swing order block that we see at price 11860. Making a potential 2% gain with 1% risk of loss.

NASDAQ SELLWelcome . Quick deal. An opportunity to sell NASDAQ. with an ascending channel. There is a strong trend. Note: If you like this analysis, please give your opinion on it. in the comments. I will be happy to share ideas, thank you

NASDAQ 100 E-MINI FUTURESNASDAQ 100 E-MINI FUTURES
Sharp and strong landing, which means it's going to the bottom peaks as targets with all the strength.

NQ1! Nasdaq Ustec 100 ndx Sell Now !According to my chart analysis , NQ1! Nasdaq Ustec 100 ndx Sell Now ! Show strong signal to Sell , sell max as you can .

NQ1! Nasdaq Ustec 100 ndx buy Limit !According to my chart analysis , NQ1! Nasdaq Ustec 100 ndx buy limit ! Show strong signal to buy , buy max as you can .

NASDAQ - GO LONG🚀The NASDAQ has broken a key structural level while trading in an uptrend. This development has made me bullish, especially since the retest of the level is now complete. This indicates that a bullish continuation is likely to follow, and therefore, I would recommend going LONG🚀 on the asset.
CME_MINI:NQ1!

NQ1! Nasdaq Ustec 100 ndx buy Now !According to my chart analysis , NQ1! Nasdaq Ustec 100 ndx buyNow ! Show strong signal to buy , buy max as you can .

NASDAQ 100 Futures for the week 2/21 to 2/14
The clear up trend and the symmetry of the prior swing pattern have been broken.
The resistance turned support so well. It’s possible to see another 100% extension as bulls’ target price.
However, considering what is shown in the previous point and the descending triangle that the market is forming now, I stay neutral at this moment.
Conclusion:
1. Long only if the market up breaks the descending triangle.
2. Short only if the market drops below the prior low.
3. What to do when the price is going between center line and prior low?
- The price would be under the center line, meaning the market is more bearish like.
- But the prior low has not been broken so the down trend has not been confirmed.
→ The direction is not clear, and the market is likely to go sideways. Or only enter short position.
**Not Financial Advice**
The information contained in this article is not intended as, and should not be understood as financial advice. You should take independent financial advice from a professional who is aware of the facts and circumstances of your individual situation.

NQ1! Nasdaq Ustec 100 ndx buy Limit !According to my chart analysis , NQ1! Nasdaq Ustec 100 ndx buy limit ! Show strong signal to buy , buy max as you can .
