Psychology of Price Action Analysis | NASDAQ and ES Futures- NASDAQ and ES futures confirmed a hourly downtrend i want to see it confirm on market cash open on QQQ and SPY to be more convincing
- the size of this pull back will determine if we can short a daily lower high if its a shallow pull back then bulls are still in completely control
Nq_f


Elliott Wave Forecasts Nasdaq (NQ) to Continue HigherShort term Elliott Wave View in Nasdaq (NQ) suggests the rally from 4.26.2023 low is in progress as a 5 waves impulse with extension (nest). Up from 4.26.2023 low, wave ((i)) ended at 13370.25 and pullback in wave ((ii)) ended at 13001.75. Wave ((iii)) is currently in progress with internal subdivision as another 5 waves in lesser degree. The 1-hour chart below shows the rally within wave ((iii)). Up from wave ((ii)), wave i ended at 13494.25 and dips in wave ii ended at 13310.50. Wave iii ended at 13960.25, wave iv ended at 13794.25, and final wave v ended at 13979.25 which completed wave (i). Index then pullback in wave (ii) which ended at 13563.60.
The Index extended higher again in wave (iii) towards 14570 and pullback in wave (iv) ended at 14336.75. Expect Index to extend higher in wave (v) to complete wave ((iii)). Afterwards, it should pullback in wave ((iv)) to correct cycle from 5.4.2023 low before the Index resumes higher again. Wave ((iv)) typically ends at 23.6 – 38.2% Fibonacci retracement of wave ((iii)). The target can be measured after wave ((iii)) is confirmed complete. Near term, as far as pivot at 13563.6 low stays intact, expect pullback to find support in 3, 7, or 11 swing for further upside.

NQ | SHORT | QQQCME_MINI:NQ1!
Nasdaq will decline by 1 to 2 percent tomorrow as $NQ_F was rejected at the 50EMA. The next support level is projected to be between 1 and 2 percent below the current price.


US 100Stoch RSI getting very overbought. But the diagonal is missing the 5th. I think we have a push above 14,000-14,300 in some mini parabolic pump move then roll over into either Wave b or wave 2

NASDAQ 100 E-mini Futures NASDAQ 100 E-mini FuturesCME_MINI:NQ1!
NASDAQ 100 E-mini Futures
When the Nasdaq market is described as being in a downward direction, it means that the overall trend of the market is experiencing a decline. This downward movement is typically reflected in the broad-based Nasdaq Composite Index, which tracks the performance of thousands of stocks listed on the exchange

NASDAQ 100 E-mini FuturesCME_MINI:NQ1!
Very strong ascent in the direction of the top peaks with the strongest penetration of the display area and resistance

$NQ #NQ Area of interestCurrent areas of interest for $NQ. Price may revisit these areas in future sessions.

$NQ #NQ Area of interestBased on private indicator price may revisit these zones in future. No position. no Advice!


Nasdaq (NQ) Buyers Can Appear Soon According to Elliott WaveShort Term Elliott Wave in Nasdaq (NQ) suggests the Index is cycle from 3.13.2023 low ended in wave ((1)) at 13349.37 as the 1 hour chart below shows. Wave ((ii)) pullback is currently in progress to correct cycle from 3.13.2023 low. Internal subdivision of wave ((ii)) is unfolding as a double three Elliott Wave structure.
Down from wave ((i)), wave a ended at 12953.25 and wave b ended at 13241.75. Wave c lower ended at 12925.50 which completed wave (a) in higher degree. Wave (b) rally ended at 13298.75 with internal subdivision as a zigzag. Up from wave (a), wave a ended at 13255 and dips in wave b ended at 13160.25. Wave c ended at 13297.75 which completed wave (b). Wave (c) lower is in progress as 5 waves. Down from wave (b), wave i ended at 13065 and rally in wave ii ended at 13226.75. Wave iii ended at 12800. Expect wave iv to end soon and Index to turn lower in wave v to complete wave (c) of ((ii)). Potential target for wave (c) of ((ii)) is 100% – 161.8% Fibonacci extension of wave (a) which comes at 12614.1 – 12876.5.


QQQ ETF: Price Action, Support and Resistance ZonesNOTE: Traders get trends and pivots wrong all the time. It's more important to know when you're wrong than it is to focus on being right all the time. Nobody is right all the time. It's about how you manage the trade when you're wrong.
As a trader with an eye for market movements, I have been monitoring the NASDAQ, particularly the QQQ ETF, to better understand its price action and significant support and resistance zones. In this idea, I will share my observations and insights while educating readers about the concept of price action moving from zone to zone upon breaching a particular level.
Before diving into the analysis, let's first discuss the educational aspect of price action. Price action refers to the movement of an asset's price over time and is often used by traders to make informed decisions based on historical price data. By analyzing price action, traders can identify patterns, trends, and potential areas of support and resistance that can influence future price movements.
Going back to January 2021, QQQ has displayed substantial support and resistance zones in the area we are in right now, between $316.50 and $323. The price swings leaving this zone began small and increased in volatility, especially leading up to the November 2021 top.
There's another zone between $348 and $353 , which could be an upside target if tech performs strongly and propels QQQ out of the current zone. Historically speaking, a backtest of this zone has resulted in a rejection in most cases (though not all - see the initial NOTE at the beginning of the idea).
Downside zones include the $260-$268 range, which would entail a retest of the October/November 2022 lows. If that level is breached, we could witness prices between $229 and $237. These zones are approximate, based on prior price action. It's crucial not to underestimate the possibility of revisiting these price levels, as markup frequently occurs, making traders complacent with the new norm even when companies are deemed significantly overvalued.
A prime example of an overvalued stock is NVIDIA (NVDA). Ideally, NVDA should be valued below $100, but investor sentiment remains exceedingly bullish for various reasons. The lesson here is that it's essential to stay vigilant and consider historical price action when evaluating potential support and resistance zones.
Understanding price action and its movement from zone to zone upon breaching specific levels is vital in making informed decisions in the market. By keeping an eye on support and resistance zones, traders can better gauge market trends and potential areas of interest for the QQQ ETF and other assets, leading to more successful trading outcomes.

US100 BUYHey, the NASDAQ market is in a positive state. With a very good candle in the daily frame. Also, this correction came to the impulse wave. At 0.50%, which is a very strong Fibonacci ratio. Backed at 1820. Good luck, speculator . Note: If you like this analysis, please give your opinion on it. in the comments. I will be happy to share ideas. Like and click to get free content. Thank you

US100 SELLHello NASDAQ Market. Strong resistance arrived. There is a high probability of going down. for correction. Although the index remains in a positive state with the gains it achieved before .Note: If you like this analysis, please give your opinion on it. in the comments. I will be happy to share ideas. Like and click to get free content. Thank you

Intraday zones for NQ futures, march 28 2023Support/resistance zones for NQ futures, intraday trading. Looking for short term reations in price as it reaches the zones. Colored zone=stronger zone

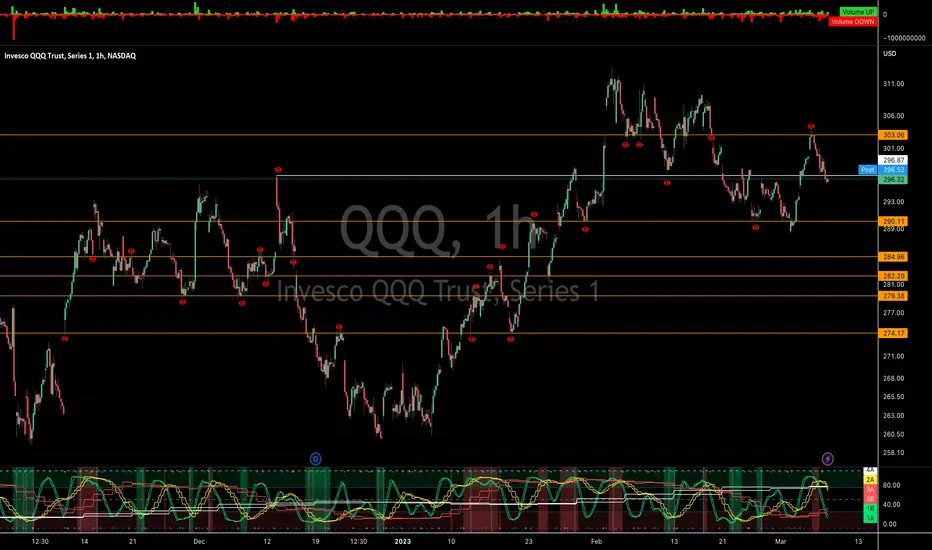
QQQ Support and Resistance is KEYI have a short story for you all but first it's important to mention that we're right at an important level that was created on December 13. If we stay trading below this level, the next important level is near 290. That's a decent drop from where we are today. Keep a watchful eye on your indicators as there's more downside as a possibility.
Once upon a time, there was a young trader named Jack. He had just learned about support and resistance levels in trading and was eager to apply his newfound knowledge to the markets.
Jack studied the charts and noticed that the price of QQQ was approaching an important resistance level. He knew that if the price broke through this level, it would signal a bullish trend and the bulls would be in control of the market. However, if the price failed to break through the resistance level, it would indicate a bearish trend, and the bears would be in control.
Jack placed an options trade on QQQ, betting that the price would break through the resistance level. However, the market had other plans. The price failed to break through the resistance level, and instead, it started to drop rapidly.
Jack watched in horror as his trade plummeted. He quickly realized that the bears were now in control of the market. He tried to cut his losses and sell the stock, but it was too late. The market had already moved against him, and he had lost a significant amount of money.
Jack learned to always pay attention to support and resistance levels in trading. He knew that if the price was below an important resistance level, it was a sign that the bears were in control, and he should avoid placing bullish options trades. Instead, he would wait for the price to break through the resistance level before placing any trades, ensuring that he was always trading with the trend and not against it.
NASDAQ 100 E-MINI FUTURESNASDAQ 100 E-MINI FUTURES
Sharp and strong landing, which means it's going to the bottom peaks as targets with all the strength.

NASDAQ 100 E-MINI FUTURESNASDAQ 100 E-MINI FUTURES
We expect very strong landing traffic to bottom points or bottoms that we consider to be great targets

NQ respects both boxesThis chart was updated and posted last night, a perfect range trade for the NQ
We did an amazing long trade this morning! A huge swing trade setup is coming up today/tomorrow

NASDAQ 100 E-MINI FUTURES
NASDAQ 100 E-MINI FUTURES
Change in direction strongly with the formation of a strong and effective Double toop pattern and is proof of strong bear motion
