NSDQ100 The Week Ahead Key Support and Resistance Levels
Resistance Level 1: 23050
Resistance Level 2: 43190
Resistance Level 3: 43430
Support Level 1: 22500
Support Level 2: 22333
Support Level 3: 22080
This communication is for informational purposes only and should not be viewed as any form of recommendation as to a particular course of action or as investment advice. It is not intended as an offer or solicitation for the purchase or sale of any financial instrument or as an official confirmation of any transaction. Opinions, estimates and assumptions expressed herein are made as of the date of this communication and are subject to change without notice. This communication has been prepared based upon information, including market prices, data and other information, believed to be reliable; however, Trade Nation does not warrant its completeness or accuracy. All market prices and market data contained in or attached to this communication are indicative and subject to change without notice.
Nsdq100

NSDQ100 ahead of US Employment data After the US close, Apple and Amazon posted mixed results:
Apple rose ~2% after-hours on a strong revenue beat ($94bn vs $89.3bn est.) and broad-based growth, especially in China — its first sales increase there in two years.
Amazon fell after projecting weaker Q3 operating profits ($15.5–$20.5bn vs $19.4bn est.) and showing slower cloud growth than competitors, raising concerns over its AI strategy.
These results pulled NASDAQ 100 futures down by -0.20%, as investors digested disappointing Amazon guidance despite Apple’s strength.
Additional Drivers:
US July Jobs Report due today may add volatility. Slower payroll growth (+75k est.) and a rise in the unemployment rate (to 4.2%) could support a dovish Fed narrative.
Trump’s Global Tariff Announcement added macro uncertainty, with sharp tariff hikes on countries with trade surpluses, including a 35% hit to Canada and 39% to Switzerland. This weighs on global trade sentiment.
Pharma Pressure: Trump is also targeting drugmakers on pricing. AstraZeneca hinted at unsustainability, suggesting regulatory risk may be rising for the sector.
Conclusion for NASDAQ 100 Trading:
The tech-heavy NASDAQ 100 faces near-term downside pressure, driven by Amazon’s weak outlook, broader macro headwinds from tariffs, and potential labor market softness. However, Apple's strong China rebound and stabilizing consumer trends (e.g., Target) offer some support. Expect choppy trade as markets await clarity from the jobs report and tariff policy impact.
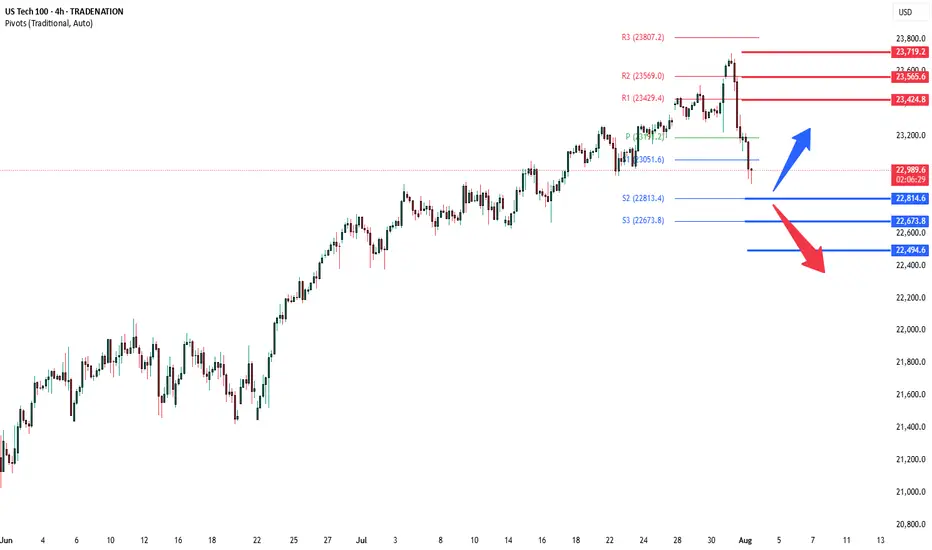
Key Support and Resistance Levels
Resistance Level 1: 23424
Resistance Level 2: 23565
Resistance Level 3: 23720
Support Level 1: 22815
Support Level 2: 22673
Support Level 3: 22500
This communication is for informational purposes only and should not be viewed as any form of recommendation as to a particular course of action or as investment advice. It is not intended as an offer or solicitation for the purchase or sale of any financial instrument or as an official confirmation of any transaction. Opinions, estimates and assumptions expressed herein are made as of the date of this communication and are subject to change without notice. This communication has been prepared based upon information, including market prices, data and other information, believed to be reliable; however, Trade Nation does not warrant its completeness or accuracy. All market prices and market data contained in or attached to this communication are indicative and subject to change without notice.
NSDQ100 important support at 23188US equities pulled back, breaking a six-day winning streak for the S&P 500 (-0.30%) as sentiment cooled ahead of key earnings and the Federal Reserve’s rate decision. The Nasdaq 100 (NDX) was weighed down by weakness in megacap tech stocks—the Mag-7 fell -0.68%, with Meta declining -2.46% and Microsoft earnings due after the close.
Post-earnings disappointments also pressured tech-related sentiment. PayPal slumped -8.66% on soft volume growth, despite unveiling a new crypto merchant feature, and UnitedHealth fell -7.46% on weaker sales. These sharp declines indicate heightened sensitivity to earnings misses in a market priced for perfection.
Meanwhile, market volatility could rise amid geopolitical jitters. A massive magnitude-8.8 earthquake in Russia’s Far East triggered tsunami alerts across the Pacific, briefly affecting Hawaii, California, and Shanghai. While many warnings were later downgraded, the event injected caution into markets.
On the macro front, investors are bracing for the Fed’s rate decision later today. The central bank is expected to hold rates steady, but traders are watching closely for guidance on future cuts—particularly in light of Trump’s renewed pressure for easing and ongoing global trade uncertainty, including tariff threats toward India.
Conclusion for Nasdaq 100 Trading:
With sentiment fragile and earnings risk front and center, traders in the Nasdaq 100 should expect near-term volatility, especially around Microsoft and Meta's earnings reports. The tech sector's leadership is under pressure, and any disappointing results could drag the index lower. Watch the Fed’s tone closely—a neutral or hawkish stance could further weigh on rate-sensitive tech. Cautious positioning or selective hedging may be warranted, particularly as geopolitical risks and trade policy uncertainty resurface.
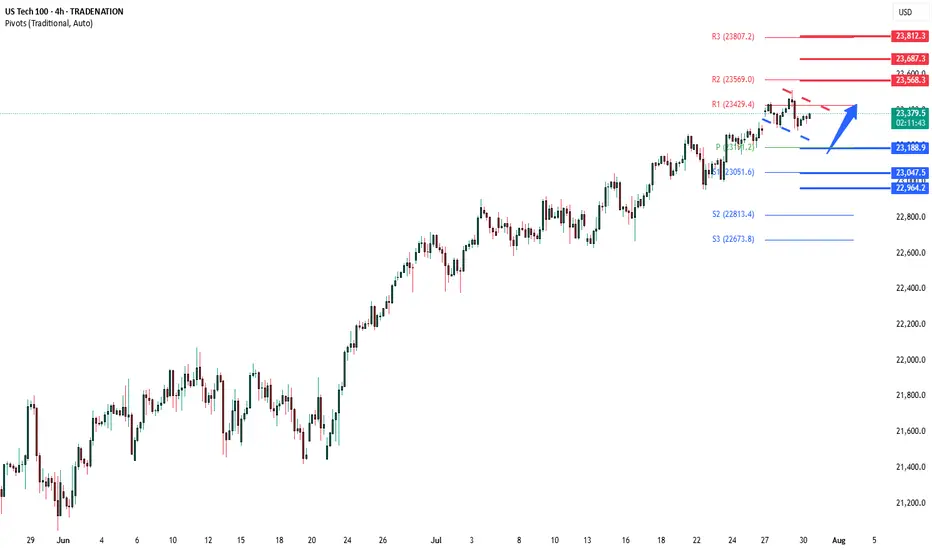
Key Support and Resistance Levels
Resistance Level 1: 23568
Resistance Level 2: 23687
Resistance Level 3: 23812
Support Level 1: 23188
Support Level 2: 23047
Support Level 3: 22965
This communication is for informational purposes only and should not be viewed as any form of recommendation as to a particular course of action or as investment advice. It is not intended as an offer or solicitation for the purchase or sale of any financial instrument or as an official confirmation of any transaction. Opinions, estimates and assumptions expressed herein are made as of the date of this communication and are subject to change without notice. This communication has been prepared based upon information, including market prices, data and other information, believed to be reliable; however, Trade Nation does not warrant its completeness or accuracy. All market prices and market data contained in or attached to this communication are indicative and subject to change without notice.
NSDQ100 pushing to new ATH?Thursday was a slightly positive session for equities, with the NASDAQ 100 rising +0.18% to close at a fresh record high, driven by strong economic data. However, overall market action was subdued, with the S&P 500’s trading range the narrowest since February (0.35%).
Notably, the equal-weighted S&P 500 fell -0.33%, highlighting underlying weakness outside mega-cap tech.
A key drag on the NASDAQ came from Tesla (-8.20%), which slumped after disappointing earnings. This weighed on the Magnificent 7, which declined -0.21% despite gains in the other six members.
On the macro front, the US dollar strengthened as Donald Trump downplayed his dispute with Fed Chair Jerome Powell, though continued to pressure the Fed on interest rates. Meanwhile, the FCC approved Paramount’s merger with Skydance, signaling a green light for M&A activity in media despite political tensions.
Conclusion – NASDAQ 100 Trading View:
The NASDAQ 100 remains technically bullish, setting new highs amid resilient economic data. However, breadth is weakening, and headline risk—especially around earnings (e.g., Tesla)—could trigger short-term volatility. Traders should stay long with caution, watching for sector rotation or profit-taking near highs, and monitor Fed-related rhetoric for macro-driven moves.
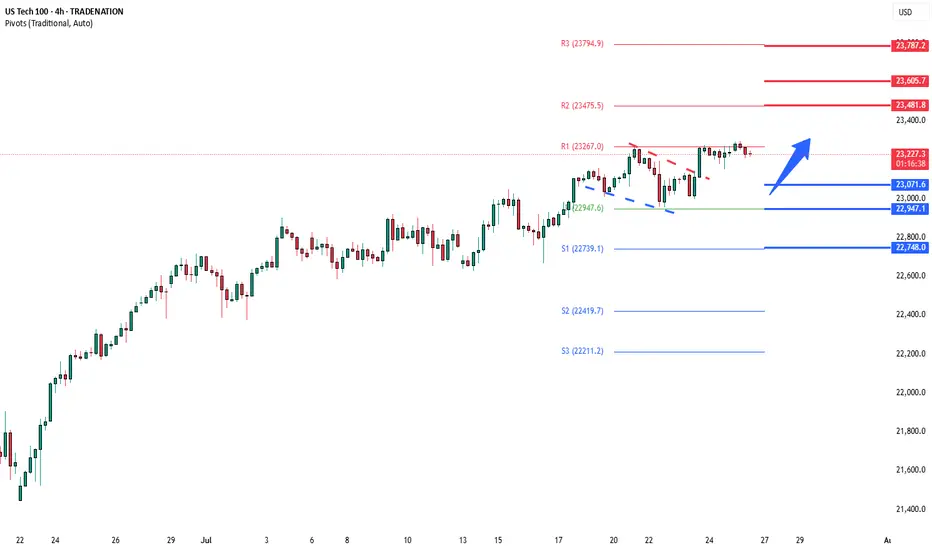
Key Support and Resistance Levels
Resistance Level 1: 23480
Resistance Level 2: 23600
Resistance Level 3: 23790
Support Level 1: 23070
Support Level 2: 22950
Support Level 3: 22750
This communication is for informational purposes only and should not be viewed as any form of recommendation as to a particular course of action or as investment advice. It is not intended as an offer or solicitation for the purchase or sale of any financial instrument or as an official confirmation of any transaction. Opinions, estimates and assumptions expressed herein are made as of the date of this communication and are subject to change without notice. This communication has been prepared based upon information, including market prices, data and other information, believed to be reliable; however, Trade Nation does not warrant its completeness or accuracy. All market prices and market data contained in or attached to this communication are indicative and subject to change without notice.
NSDQ100 another bullish flag developing ?Donald Trump has agreed a new trade deal with Japan, setting 15% tariffs on US imports like cars and launching a $550 billion fund to boost investment in the US. This is lower than his earlier 25% tariff threat. Other allies saw mixed outcomes—the Philippines got a small tariff cut, while Canada’s talks stalled. Goldman Sachs now expects the US baseline tariff rate to rise to 15%.
Trump also suggested that Fed Chair Jerome Powell may not stay in his role much longer, and he’s considering removing capital gains tax on home sales, which could affect the housing market.
Separately, a Chinese-linked cyberattack breached the US nuclear weapons agency, though no classified data was stolen. Meanwhile, SpaceX’s investor documents flagged Elon Musk’s political activity as a potential risk as the company targets a $400 billion valuation.
Conclusion for Nasdaq 100:
The Nasdaq 100 faces short-term uncertainty due to rising trade tariffs, Fed leadership questions, and geopolitical risks. While some US-focused investments could benefit, traders should stay cautious as policy and global tensions evolve.
Key Support and Resistance Levels
Resistance Level 1: 23265
Resistance Level 2: 23670
Resistance Level 3: 23480
Support Level 1: 22953
Support Level 2: 22840
Support Level 3: 22740
This communication is for informational purposes only and should not be viewed as any form of recommendation as to a particular course of action or as investment advice. It is not intended as an offer or solicitation for the purchase or sale of any financial instrument or as an official confirmation of any transaction. Opinions, estimates and assumptions expressed herein are made as of the date of this communication and are subject to change without notice. This communication has been prepared based upon information, including market prices, data and other information, believed to be reliable; however, Trade Nation does not warrant its completeness or accuracy. All market prices and market data contained in or attached to this communication are indicative and subject to change without notice.

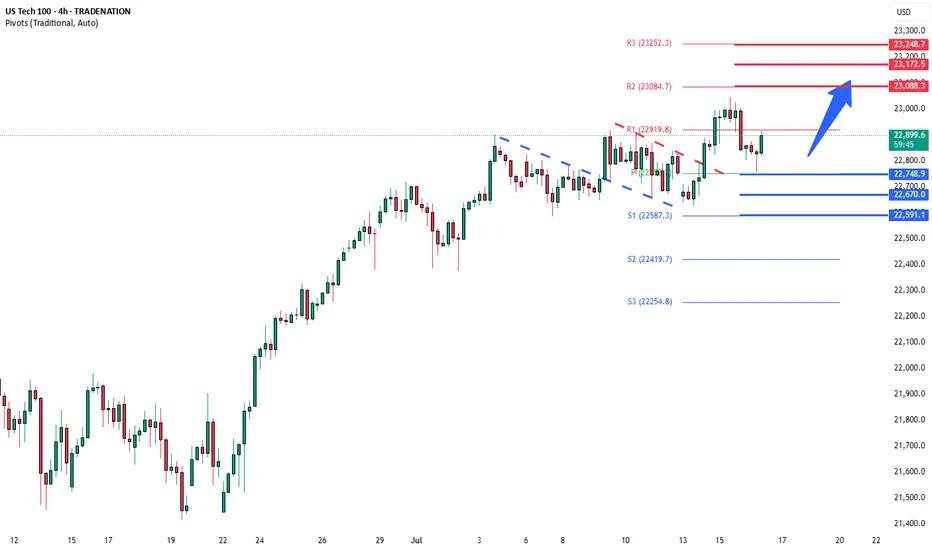
Trade, Fed, and Policy Developments Impacting NASDAQ 100Tariff Expansion Threat:
Donald Trump signaled upcoming tariffs on pharmaceuticals and semiconductors, two sectors heavily represented in the NASDAQ 100. These measures could:
Raise consumer costs.
Disrupt tech and healthcare supply chains.
Add margin pressure on multinational firms.
Corporate Impact:
Rio Tinto revealed $300M in losses from US aluminum tariffs on Canadian output.
Canada-US trade talks will intensify, but tariffs appear likely to remain, adding to cost overhang for manufacturers and downstream users.
Fed Leadership Uncertainty:
Kevin Hassett is emerging as the frontrunner to replace Fed Chair Jerome Powell in 2026.
Trump is critical of Powell, even citing Fed building renovation costs as a potential fireable offense.
This adds uncertainty to monetary policy continuity, especially as inflation rises and rate path expectations diverge.
401(k) and Private Equity Access:
The administration is finalizing an executive order allowing 401(k) plans to invest in private equity, a move that could:
Increase alternative asset exposure.
Boost private market valuations.
Signal a policy tilt toward financial market liberalization, which may help sustain risk sentiment in the medium term.
Conclusion for NASDAQ 100 (NSDQ100) Trading
The near-term risk for NASDAQ 100 is tilted negative due to the tariff threats on semiconductors and pharma, both major index components.
Fed leadership uncertainty could inject volatility into rate expectations, pressuring tech valuations sensitive to discount rate changes.
However, the longer-term policy shift toward broader 401(k) access to private markets could support overall market sentiment and capital flows.
Bias: Cautiously Bearish in the short term due to trade and Fed risks; neutral to slightly bullish medium term if private capital access reforms proceed and trade escalation is contained.
Key Support and Resistance Levels
Resistance Level 1: 23080
Resistance Level 2: 23170
Resistance Level 3: 23250
Support Level 1: 22750
Support Level 2: 22670
Support Level 3: 22590
This communication is for informational purposes only and should not be viewed as any form of recommendation as to a particular course of action or as investment advice. It is not intended as an offer or solicitation for the purchase or sale of any financial instrument or as an official confirmation of any transaction. Opinions, estimates and assumptions expressed herein are made as of the date of this communication and are subject to change without notice. This communication has been prepared based upon information, including market prices, data and other information, believed to be reliable; however, Trade Nation does not warrant its completeness or accuracy. All market prices and market data contained in or attached to this communication are indicative and subject to change without notice.
NSDQ100 Bullish breakout retest?Donald Trump escalated trade tensions again, threatening a 35% tariff on Canadian goods shortly after reopening trade talks, and floated doubling global tariffs to 20%. This reinforces his aggressive protectionist stance and puts renewed pressure on allies like Canada and Vietnam, the latter blindsided by a 20% levy. Meanwhile, US-China relations may be entering a critical phase, with a possible Trump-Xi summit hinted at by Marco Rubio during talks in Malaysia.
On the geopolitical front, Trump is signaling a harder line on Russia, previewing a “major statement” and backing expanded sanctions as the US sends more weapons to Ukraine. This raises global uncertainty, especially for energy and defense sectors.
Conclusion for NSDQ100 trading:
Rising trade tensions and geopolitical risks may dampen market sentiment and lead to volatility in tech-heavy Nasdaq stocks, particularly those reliant on global supply chains. While traders have grown numb to tariff talk, the cumulative pressure suggests a downside risk is building. In the short term, maintain a cautious stance—watch for potential pullbacks and heightened intraday volatility as policy clarity remains elusive.
Key Support and Resistance Levels
Resistance Level 1: 22940
Resistance Level 2: 23060
Resistance Level 3: 23180
Support Level 1: 22410
Support Level 2: 22300
Support Level 3: 22130
This communication is for informational purposes only and should not be viewed as any form of recommendation as to a particular course of action or as investment advice. It is not intended as an offer or solicitation for the purchase or sale of any financial instrument or as an official confirmation of any transaction. Opinions, estimates and assumptions expressed herein are made as of the date of this communication and are subject to change without notice. This communication has been prepared based upon information, including market prices, data and other information, believed to be reliable; however, Trade Nation does not warrant its completeness or accuracy. All market prices and market data contained in or attached to this communication are indicative and subject to change without notice.

Nasdaq 100 Index 2-Hour Chart Analysis2-hour candlestick chart for the Nasdaq 100 Index (NDX) on the NASDAQ exchange. The chart spans from May to August, showcasing a significant upward trend with notable fluctuations. Key indicators include a recent price of 22,861.53, representing a 0.72% increase. The chart features technical analysis elements such as support and resistance levels, highlighted by green and red boxes, and a downward arrow suggesting a potential price movement.

NSDQ100 Bullish Flag continuation pattern developing Metals Market Volatility
Trump’s proposed 50% tariff on copper imports triggered a sharp drop in London copper prices (~2%), with risks of falling below $9,000/ton. While U.S. prices spiked on supply concerns, the global move reflects industrial demand fears—potentially weighing on manufacturing and cyclical stocks.
Trade Negotiations Intensify
Asian trade delegates have logged over 350,000 air miles traveling to Washington as tariff timelines remain unclear. Ongoing uncertainty is capping broader risk appetite, though delayed duties and active talks are offering short-term relief to markets.
Fed Under Pressure
Trump ramped up criticism of Fed Chair Jerome Powell, calling him “terrible,” and may consider replacing him with top adviser Kevin Hassett. This raises questions about central bank independence and future rate policy, a potential headwind for investor confidence.
Market Snapshot
U.S. stock futures: Slightly higher
Oil: Up, on Red Sea conflict
Gold: Down, as risk appetite stabilizes
Conclusion – Nasdaq 100 Trading Outlook
Near-term view: Mildly bullish, supported by easing trade tension and tech sector strength.
Caution warranted: Watch for headline risks from new tariff announcements or Fed-related developments.
Key Support and Resistance Levels
Resistance Level 1: 22940
Resistance Level 2: 23060
Resistance Level 3: 23180
Support Level 1: 22410
Support Level 2: 22300
Support Level 3: 22130
This communication is for informational purposes only and should not be viewed as any form of recommendation as to a particular course of action or as investment advice. It is not intended as an offer or solicitation for the purchase or sale of any financial instrument or as an official confirmation of any transaction. Opinions, estimates and assumptions expressed herein are made as of the date of this communication and are subject to change without notice. This communication has been prepared based upon information, including market prices, data and other information, believed to be reliable; however, Trade Nation does not warrant its completeness or accuracy. All market prices and market data contained in or attached to this communication are indicative and subject to change without notice.

NSDQ100 lower after ADP Employment shrank to 33K in JuneTrump Trade Tensions:
Donald Trump reaffirmed his July 9 deadline for higher tariffs, intensifying criticism of Japan, particularly over auto sector issues. While Japan insists talks are in good faith, market fears of a breakdown are rising.
US Tax Policy in Focus:
Trump’s “Big Beautiful” tax and spending bill faces potential resistance in the House despite narrowly passing the Senate. The proposal’s scale and political friction are drawing investor attention.
Apple Supply Chain Worry:
Foxconn has pulled hundreds of Chinese staff from its Indian iPhone factories, sparking fresh concerns about Apple’s supply chain and Wall Street’s potentially overheated tech optimism.
Paramount Settlement:
Paramount resolved a lawsuit with Trump over alleged election interference via CBS’s coverage. Meanwhile, the company awaits FCC approval for its Skydance merger.
Auto Sector Weakness:
Stellantis reported a 10% drop in U.S. Q2 deliveries despite some brand gains. Tesla is expected to post a 12% annual decline in vehicle deliveries, reinforcing signs of cooling demand in the sector.
Conclusion:
Markets remain cautious but resilient amid political tensions, supply chain disruptions, and weaker auto sales. Attention is now turning to upcoming trade deadlines, policy decisions, and Q2 corporate results.
Key Support and Resistance Levels
Resistance Level 1: 22710
Resistance Level 2: 22820
Resistance Level 3: 22930
Support Level 1: 22190
Support Level 2: 22040
Support Level 3: 21900
This communication is for informational purposes only and should not be viewed as any form of recommendation as to a particular course of action or as investment advice. It is not intended as an offer or solicitation for the purchase or sale of any financial instrument or as an official confirmation of any transaction. Opinions, estimates and assumptions expressed herein are made as of the date of this communication and are subject to change without notice. This communication has been prepared based upon information, including market prices, data and other information, believed to be reliable; however, Trade Nation does not warrant its completeness or accuracy. All market prices and market data contained in or attached to this communication are indicative and subject to change without notice.

NSDQ100 Bullish breakout supported at 21950President Trump rejected a Pentagon intelligence report suggesting his airstrikes on Iran had limited effect, claiming they caused “total obliteration,” despite inconclusive satellite imagery. In a surprising move that weakens longstanding US sanctions, Trump also allowed China to resume purchases of Iranian oil.
Federal Reserve Chair Jerome Powell reiterated that the current inflation outlook supports holding interest rates steady. He is expected to provide further detail in testimony before the Senate Banking Committee today.
Markets responded calmly: stock futures were steady as the Israel-Iran truce held, and oil prices rose slightly after their sharpest two-day drop since 2022.
Separately, the UK announced plans to purchase 12 US-made F-35A fighter jets capable of carrying nuclear weapons, in a bid to strengthen ties with Trump. NATO allies are working diplomatically to reassure the US of their unity, ahead of a summit in The Hague.
Key Support and Resistance Levels
Resistance Level 1: 22380
Resistance Level 2: 22500
Resistance Level 3: 22690
Support Level 1: 21950
Support Level 2: 21810
Support Level 3: 21680
This communication is for informational purposes only and should not be viewed as any form of recommendation as to a particular course of action or as investment advice. It is not intended as an offer or solicitation for the purchase or sale of any financial instrument or as an official confirmation of any transaction. Opinions, estimates and assumptions expressed herein are made as of the date of this communication and are subject to change without notice. This communication has been prepared based upon information, including market prices, data and other information, believed to be reliable; however, Trade Nation does not warrant its completeness or accuracy. All market prices and market data contained in or attached to this communication are indicative and subject to change without notice.

NSDQ100 bullish continuation supported at 21300Markets & Geopolitics:
Investors are holding back as Trump may try diplomacy before acting against Iran. Oil prices dropped, European stocks rose, and the dollar slipped.
Tensions remain high: Israel hit Iranian missile and nuclear sites, and Iran’s president demanded Israel stop unconditionally. Iran’s foreign minister is in Geneva for talks, and the country is speeding up oil exports.
Technology:
SoftBank’s founder Masayoshi Son wants to partner with TSMC to build a huge AI and robotics hub in Arizona. It’s unclear if TSMC will join, as it’s already investing $165 billion in the US.
US Politics & Immigration:
A court backed Trump’s use of the National Guard during LA protests, despite pushback from California’s governor. A deeper report looks at how immigration raids affect workers.
Trade & Business:
Canada may raise tariffs on US steel and aluminum if trade talks stall. Meanwhile, Temu’s US sales are falling as it cuts back on ads. A Fidelity manager says markets have likely priced in Trump’s tariff threats and sees opportunity in mid-sized companies.
Key Trading Levels:
Resistance Level 1: 22070
Resistance Level 2: 22370
Resistance Level 3: 22780
Support Level 1: 21300
Support Level 2: 21060
Support Level 3: 20820
This communication is for informational purposes only and should not be viewed as any form of recommendation as to a particular course of action or as investment advice. It is not intended as an offer or solicitation for the purchase or sale of any financial instrument or as an official confirmation of any transaction. Opinions, estimates and assumptions expressed herein are made as of the date of this communication and are subject to change without notice. This communication has been prepared based upon information, including market prices, data and other information, believed to be reliable; however, Trade Nation does not warrant its completeness or accuracy. All market prices and market data contained in or attached to this communication are indicative and subject to change without notice.

NSDQ100 Geopolitics, Fed & Rates Outlook Geopolitics & Market Sentiment
Iran-Israel conflict enters its sixth day, raising fears of broader escalation.
Speculation is building that Donald Trump may authorize the use of the Massive Ordnance Penetrator (bunker-buster bomb) to target Iran’s nuclear facilities.
Trump is also meeting with Pakistan’s army chief today for talks on Iran, adding to geopolitical uncertainty.
So far, Iran’s oil infrastructure remains intact, and Hezbollah has stayed out of the conflict, limiting immediate economic fallout.
Fed & Rates Outlook
The Federal Reserve is expected to hold rates steady today as it waits for clearer economic signals amid ongoing Trump policy shifts.
Trump is pressuring the Fed, now arguing for lower rates to cut US debt costs.
Traders are building record positions betting on a dovish Fed shift after Powell's term ends in May 2026.
Market Implications for NSDQ100
Nasdaq futures are mildly positive, supported by:
Stability in tech earnings outlook
Expectations of Fed staying on hold, with a possible dovish bias emerging
However, Middle East tensions remain a risk. Any strike on oil infrastructure or major military escalation could:
Trigger a risk-off move
Push oil prices higher, raising inflation concerns
Weigh on tech stocks sensitive to rate outlooks and sentiment
Key Focus for Nasdaq Traders Today:
Fed decision and Powell’s tone (especially on inflation and growth risks)
Headlines from the Middle East
Oil price action near the five-month high (WTI around $73.50–$74)
Resistance Level 1: 22070
Resistance Level 2: 22370
Resistance Level 3: 22780
Support Level 1: 21300
Support Level 2: 21060
Support Level 3: 20820
This communication is for informational purposes only and should not be viewed as any form of recommendation as to a particular course of action or as investment advice. It is not intended as an offer or solicitation for the purchase or sale of any financial instrument or as an official confirmation of any transaction. Opinions, estimates and assumptions expressed herein are made as of the date of this communication and are subject to change without notice. This communication has been prepared based upon information, including market prices, data and other information, believed to be reliable; however, Trade Nation does not warrant its completeness or accuracy. All market prices and market data contained in or attached to this communication are indicative and subject to change without notice.

NSDQ100 uptrend consolidation supported at 21300Markets Rattled After Israel Strikes Iran
Israel launched major airstrikes on Iran, targeting nuclear and missile sites, as well as top military leaders. The move sharply escalates tensions in the Middle East and came despite warnings from former President Donald Trump, who was told of the attack only shortly beforehand. He later warned Iran that future strikes would be “even more brutal” if no deal is made.
Market Reaction:
Oil jumped up to 13% on fears of supply disruptions.
Gold climbed as investors rushed to safe-haven assets.
Stock futures and crypto fell on rising geopolitical risk.
The U.S. dollar dipped, then rebounded, as its role as a safe-haven asset came into focus.
Other Key Updates:
Trump wins court backing to keep troops in Los Angeles amid ongoing protests. A hearing is set for Tuesday.
Meta invests billions in Scale AI, bringing on its CEO to boost efforts in building artificial general intelligence. Meta is aggressively hiring top AI talent from firms like Google.
For Traders:
Watch oil and gold closely for continued volatility.
Safe-haven flows could drive further USD and gold moves.
Meta’s AI push may influence tech sector sentiment.
Key Support and Resistance Levels
Resistance Level 1: 22070
Resistance Level 2: 22370
Resistance Level 3: 22680
Support Level 1: 21300
Support Level 2: 21060
Support Level 3: 20820
This communication is for informational purposes only and should not be viewed as any form of recommendation as to a particular course of action or as investment advice. It is not intended as an offer or solicitation for the purchase or sale of any financial instrument or as an official confirmation of any transaction. Opinions, estimates and assumptions expressed herein are made as of the date of this communication and are subject to change without notice. This communication has been prepared based upon information, including market prices, data and other information, believed to be reliable; however, Trade Nation does not warrant its completeness or accuracy. All market prices and market data contained in or attached to this communication are indicative and subject to change without notice.

NSDQ100 INTRADAY awaits US CPI data Trade:
The US and China agreed on a basic plan to restart trade in sensitive goods. China will speed up rare earth exports, and the US may ease some export rules. The deal still needs approval from Trump and Xi. A court also ruled Trump can keep his global tariffs for now. Markets dipped due to the lack of details, and focus is now on US inflation data.
Protests:
LA had a quieter night after setting a downtown curfew. Anti-ICE protests spread to more cities. Trump’s move to send the military to LA is drawing controversy.
Key Support and Resistance Levels
Resistance Level 1: 22070
Resistance Level 2: 22370
Resistance Level 3: 22680
Support Level 1: 21300
Support Level 2: 21060
Support Level 3: 20820
This communication is for informational purposes only and should not be viewed as any form of recommendation as to a particular course of action or as investment advice. It is not intended as an offer or solicitation for the purchase or sale of any financial instrument or as an official confirmation of any transaction. Opinions, estimates and assumptions expressed herein are made as of the date of this communication and are subject to change without notice. This communication has been prepared based upon information, including market prices, data and other information, believed to be reliable; however, Trade Nation does not warrant its completeness or accuracy. All market prices and market data contained in or attached to this communication are indicative and subject to change without notice.

NSDQ100 INTRADAY ahead of ADP Jobs andd PMI dataToday’s key focus is on U.S. jobs and services data, and the Fed’s tone.
Markets will react to signs of inflation, growth and the Feds speech which could indicate a shift in direction of its core policy.
Key Support and Resistance Levels
Resistance Level 1: 22040
Resistance Level 2: 22250
Resistance Level 3: 22690
Support Level 1: 22330
Support Level 2: 22010
Support Level 3: 20780
This communication is for informational purposes only and should not be viewed as any form of recommendation as to a particular course of action or as investment advice. It is not intended as an offer or solicitation for the purchase or sale of any financial instrument or as an official confirmation of any transaction. Opinions, estimates and assumptions expressed herein are made as of the date of this communication and are subject to change without notice. This communication has been prepared based upon information, including market prices, data and other information, believed to be reliable; however, Trade Nation does not warrant its completeness or accuracy. All market prices and market data contained in or attached to this communication are indicative and subject to change without notice.

NSDQ100 INTRADAY at pivotal level ?Tariffs & Trade:
The Trump administration is exploring ways to push through import tariffs, possibly including a temporary 15% tariff for 150 days.
A federal appeals court has paused a suspension of the tariffs for now.
Markets:
US stocks are holding up well. The S&P 500 is on track for its best May since 1990.
However, June may be weaker, and futures suggest a quieter trading day ahead.
Federal Reserve & Tax Concerns:
President Trump urged Fed Chair Jerome Powell to cut interest rates in a recent meeting.
Wall Street is uneasy about a tax measure in Trump’s bill that may increase taxes on foreign investors in US assets.
Europe:
The European Central Bank is expected to cut interest rates next week and again in September, possibly settling at 1.75% until the end of 2026.
Bank of England Governor Andrew Bailey pushed for a stronger EU trade deal and emphasized a slow and cautious approach to rate cuts.
Geopolitics:
Russia hasn’t provided a peace talk agenda to Ukraine or its allies.
Hamas is reviewing a US-backed ceasefire plan but says it doesn’t yet meet its demands.
Key Support and Resistance Levels
Resistance Level 1: 21850
Resistance Level 2: 22050
Resistance Level 3: 22200
Support Level 1: 21000
Support Level 2: 20770
Support Level 3: 20560
This communication is for informational purposes only and should not be viewed as any form of recommendation as to a particular course of action or as investment advice. It is not intended as an offer or solicitation for the purchase or sale of any financial instrument or as an official confirmation of any transaction. Opinions, estimates and assumptions expressed herein are made as of the date of this communication and are subject to change without notice. This communication has been prepared based upon information, including market prices, data and other information, believed to be reliable; however, Trade Nation does not warrant its completeness or accuracy. All market prices and market data contained in or attached to this communication are indicative and subject to change without notice.

NSDQ100 INTRADAY resistance retest ahead of US OpenThe USD continues to rally, driven by:
A strong rebound in US Consumer Confidence, reversing a six-month downtrend.
A decline in the number of Americans expecting a recession, improving risk sentiment.
This positive momentum helped offset weaker April Durable Goods Orders, which reflected business concerns tied to Trump’s tariff policies.
Trump Signals Progress with EU Trade Talks
Trump stated on Truth Social that the EU is moving quickly to begin trade negotiations after he expressed satisfaction with a proposed 50% tariff.
Markets could interpret this as a step toward de-escalation, potentially supporting US equities and the USD, while posing risk to EU markets if tensions resume.
SpaceX Test Failure
SpaceX’s Starship test failed mid-flight. While a technical setback, broader market impact is likely minimal unless similar failures persist.
Could marginally affect aerospace and space-related stocks.
Elon Musk on Crypto & Tax Policy
Musk criticized Trump’s tax bill, claiming it undermines DOGE and broader crypto innovation.
Slightly negative for crypto sentiment, particularly speculative tokens like Dogecoin.
Earnings in Focus
Nvidia (NVDA):
Market will watch for signs of weaker China-related growth, tied to Trump’s policy on semiconductors and AI.
Key impact expected on tech stocks, semis, and the NASDAQ.
Salesforce (CRM):
Focus on adoption of new AI tools and updates on the $8 billion Informatica acquisition.
Could affect broader enterprise software and cloud sector sentiment.
Key Support and Resistance Levels
Resistance Level 1: 21520
Resistance Level 2: 21850
Resistance Level 3: 22200
Support Level 1: 21000
Support Level 2: 20770
Support Level 3: 20560
This communication is for informational purposes only and should not be viewed as any form of recommendation as to a particular course of action or as investment advice. It is not intended as an offer or solicitation for the purchase or sale of any financial instrument or as an official confirmation of any transaction. Opinions, estimates and assumptions expressed herein are made as of the date of this communication and are subject to change without notice. This communication has been prepared based upon information, including market prices, data and other information, believed to be reliable; however, Trade Nation does not warrant its completeness or accuracy. All market prices and market data contained in or attached to this communication are indicative and subject to change without notice.

NSDQ100 INTRADAY uptrend continuationTrade Tensions – Trump’s Tariff Plans
Donald Trump said he will set new tariff rates on trading partners within the next 2–3 weeks. China tariffs may remain at 30% through late 2025, according to a Bloomberg survey.
Relevance:
Renewed tariff threats could pressure Nasdaq 100 names with global exposure, especially semiconductors and large-cap tech (e.g., Apple, Nvidia).
Heightened inflation and supply chain risks may weigh on broader risk sentiment.
Geopolitical Risks – Russia, Middle East
Trump is open to meeting Vladimir Putin, though peace talks in Istanbul remain unproductive. Meanwhile, he returns from the Middle East with $200 billion in UAE investment deals.
Relevance:
Limited direct impact on Nasdaq 100, but reinforces broader geopolitical uncertainty, which may influence market volatility and global risk appetite.
Meta Under Pressure – Competition and Regulation
ByteDance, owner of TikTok, is reportedly on track to match Meta’s revenue this year. Meta shares fell on reports of delayed AI development and increasing EU regulatory pressure around user age restrictions.
Relevance:
Meta (META) faces increasing headwinds from both competition and regulation.
Sentiment could spill into other ad-driven or AI-exposed Nasdaq 100 names.
xAI Controversy – Grok AI Glitch
Elon Musk’s xAI chatbot Grok posted controversial content due to unauthorized system tampering. The company has since corrected the issue.
Relevance:
Raises concerns about oversight and content control in the AI space.
May indirectly affect sentiment around AI-related names in the Nasdaq 100, including Tesla and other emerging AI platforms.
Conclusion – Nasdaq 100 Implications
Caution warranted around large-cap tech, especially Meta and AI-focused companies.
Trade war rhetoric and geopolitical risk could add volatility to the broader index.
Watch for market reactions to tariff announcements, regulatory headlines, and key AI developments.
Key Support and Resistance Levels
Resistance Level 1: 21540
Resistance Level 2: 21710
Resistance Level 3: 21900
Support Level 1: 20890
Support Level 2: 20730
Support Level 3: 20600
This communication is for informational purposes only and should not be viewed as any form of recommendation as to a particular course of action or as investment advice. It is not intended as an offer or solicitation for the purchase or sale of any financial instrument or as an official confirmation of any transaction. Opinions, estimates and assumptions expressed herein are made as of the date of this communication and are subject to change without notice. This communication has been prepared based upon information, including market prices, data and other information, believed to be reliable; however, Trade Nation does not warrant its completeness or accuracy. All market prices and market data contained in or attached to this communication are indicative and subject to change without notice.

NSDQ100 INTRADAY uptrend continuationUS-China Trade Talks:
The Trump administration is considering cutting tariffs on Chinese goods to below 60% during upcoming talks. China may reciprocate. Chinese exports to the US have already dropped sharply following earlier steep tariffs.
Global Market Reaction:
Germany's DAX index hit a new high, recovering losses from the trade war. European stocks are rising on hopes of lower tariffs and potential rate cuts from the European Central Bank.
US Tax Policy:
Trump is urging Congress to raise taxes on the wealthy, proposing a 39.6% rate for individuals earning $2.5 million or more (or $5 million for couples).
Panasonic Job Cuts:
Panasonic plans to cut 10,000 jobs to improve profitability by focusing on growth areas and reducing operations in weaker sectors like TVs and industrial devices.
Key Support and Resistance Levels
Resistance Level 1: 20530
Resistance Level 2: 20730
Resistance Level 3: 20950
Support Level 1: 19640
Support Level 2: 19325
Support Level 3: 19030
This communication is for informational purposes only and should not be viewed as any form of recommendation as to a particular course of action or as investment advice. It is not intended as an offer or solicitation for the purchase or sale of any financial instrument or as an official confirmation of any transaction. Opinions, estimates and assumptions expressed herein are made as of the date of this communication and are subject to change without notice. This communication has been prepared based upon information, including market prices, data and other information, believed to be reliable; however, Trade Nation does not warrant its completeness or accuracy. All market prices and market data contained in or attached to this communication are indicative and subject to change without notice.

NSDQ100 INTRADAY awaits Fed Rate Decision Macro & Central Banks
The Federal Reserve is expected to keep interest rates unchanged. Officials say policy is well-positioned, despite political frustration.
China is adding stimulus: cutting rates, reducing bank reserve requirements, and increasing gold reserves for the sixth month in a row.
Markets
U.S. stock futures are higher.
The U.S. dollar is recovering after three days of declines.
The U.S. and China will restart trade talks — the first since the Trump-era tariff war.
Companies
Novo Nordisk shares are rising on expectations of less competition for its obesity drug Wegovy.
WeightWatchers has filed for bankruptcy.
Earnings reports this morning: Walt Disney, Uber, Barrick Gold.
Earnings reports this afternoon: Arm Holdings, Occidental Petroleum, Carvana, Flutter.
Key Support and Resistance Levels
Resistance Level 1: 20,190
Resistance Level 2: 20,510
Resistance Level 3: 20,930
Support Level 1: 19,330
Support Level 2: 19,020
Support Level 3: 18,570
This communication is for informational purposes only and should not be viewed as any form of recommendation as to a particular course of action or as investment advice. It is not intended as an offer or solicitation for the purchase or sale of any financial instrument or as an official confirmation of any transaction. Opinions, estimates and assumptions expressed herein are made as of the date of this communication and are subject to change without notice. This communication has been prepared based upon information, including market prices, data and other information, believed to be reliable; however, Trade Nation does not warrant its completeness or accuracy. All market prices and market data contained in or attached to this communication are indicative and subject to change without notice.

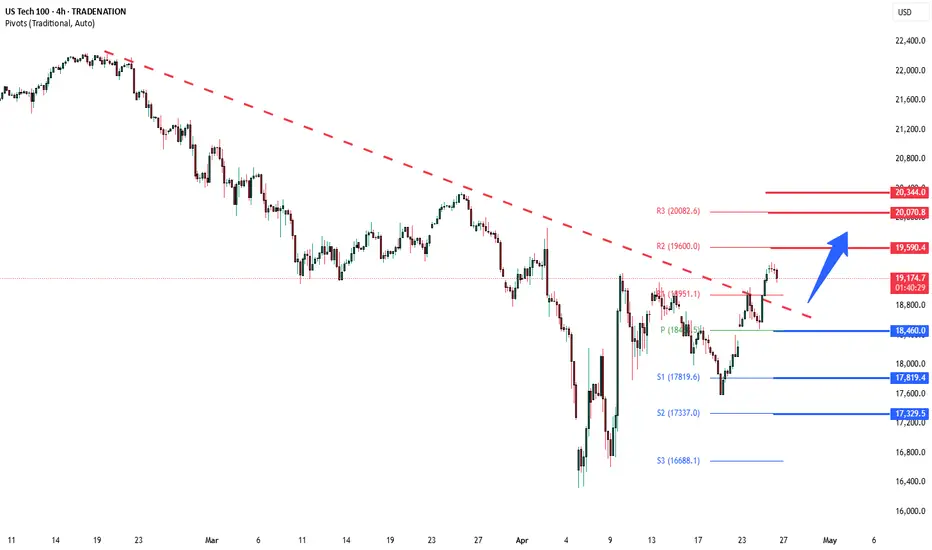
NSDQ100 INTRADAY trend change supported at 18950 Key Support and Resistance Levels
Resistance Level 1: 19590
Resistance Level 2: 20070
Resistance Level 3: 20344
Support Level 1: 18460
Support Level 2: 17820
Support Level 3: 17330
This communication is for informational purposes only and should not be viewed as any form of recommendation as to a particular course of action or as investment advice. It is not intended as an offer or solicitation for the purchase or sale of any financial instrument or as an official confirmation of any transaction. Opinions, estimates and assumptions expressed herein are made as of the date of this communication and are subject to change without notice. This communication has been prepared based upon information, including market prices, data and other information, believed to be reliable; however, Trade Nation does not warrant its completeness or accuracy. All market prices and market data contained in or attached to this communication are indicative and subject to change without notice.