SBIN is above breakout levelSBIN just crossed breakout level of 792.25 and now in bullish zone. Expected to cross 850 level. Stop loss is 782.75 (Reversal level as mentioned on chart)
Note: This is not a buy/sell trade call. It is an analysis.
Nse

COFORGE 8100 CE – 29 MAY EXPIntraday to Short-Term Trade Setup (15min/1H)
🟢 Bullish Breakout | Volume Surge Confirmed
🛒 Entry Zone (Buy Above): ₹258–260
🔑 Confirmation on 15min candle close above ₹260 with volume
🎯 Targets:
T1: ₹276
T2: ₹306.50
T3: ₹353.90 (if momentum continues into next session)
🛑 Stop Loss:
SL: ₹230 (on candle close basis for 15min TF)
Conservative SL: ₹240 (if tighter risk appetite)
📊 Indicators Signal:
✅ 9 EMA crossed 26 EMA (momentum confirmation)
✅ RSI at 76.79 – strong, but watch for pullback
✅ BB %B at 0.89 – breakout zone
✅ Clean breakout above resistance (~₹230) with volume spike
✅ Pivot & resistance flip visible on both 15min & 1H TF
For Education Purposes Only

Equity Research - TATA MOTORS LTD 📈 Buy Zone: ₹670.50 – ₹680.30
🎯 Target: ₹740.00
🛑 Stop Loss: ₹641.70
💹 CMP: ₹680.30
Technical Highlights:
✅ Bullish volume spike
✅ RSI above 60 – strong momentum
✅ Price above 20EMA & 50EMA
✅ Breakout and retest on 15m & 1H chart
✅ Good risk-reward setup
📊 Strategy: Wait for confirmation candle on 15min TF above ₹681 for entry.
📉 Stop loss below recent swing low at ₹641.70.
For Education Purposes Only

POWERGRID – Breakout Setup with Volume Spike📍 Entry Zone: ₹310.10 – ₹311.10
🎯 Target: ₹330.00
🛑 Stoploss: ₹302.00
📈 RSI has crossed above 60, volume confirms breakout momentum (🔵 arrow), and price is supported above key EMAs.
🔍 Strong bullish structure with clear higher lows and a clean breakout candle. Momentum shift confirmed with increasing volume.
For Education Purposes Only

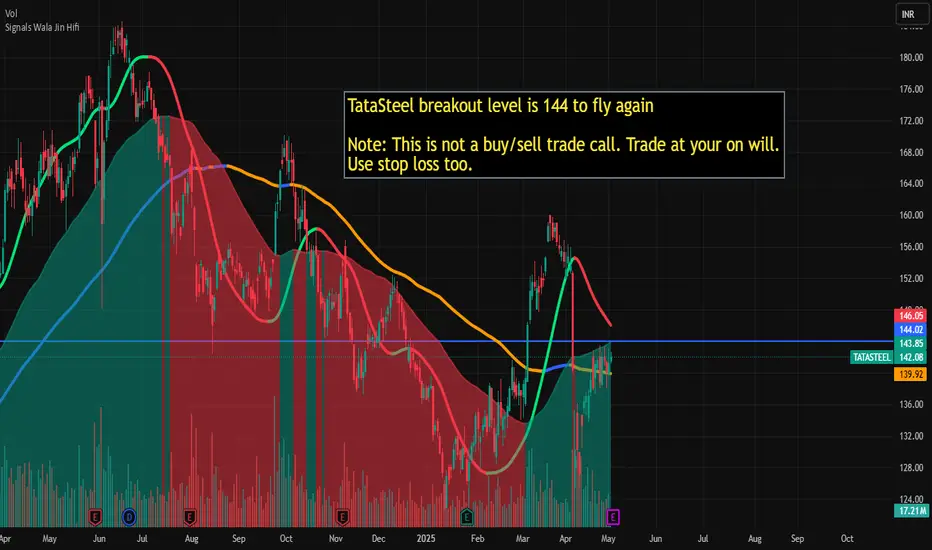
Tata Steel breakout level is 144 for fly againTataSteel breakout level is 144 to fly again
Note: This is not a buy/sell trade call. Trade at your on will. Use stop loss too.
TCS is into Bearish zone, Could drop to 2800TCS is entered into Bearish zone on Monthly Chart and It could drop tp 2800 and below levels.
Note: This is not a buy/sell trade call. Trade at your own will and analysis. Use stop loss too.

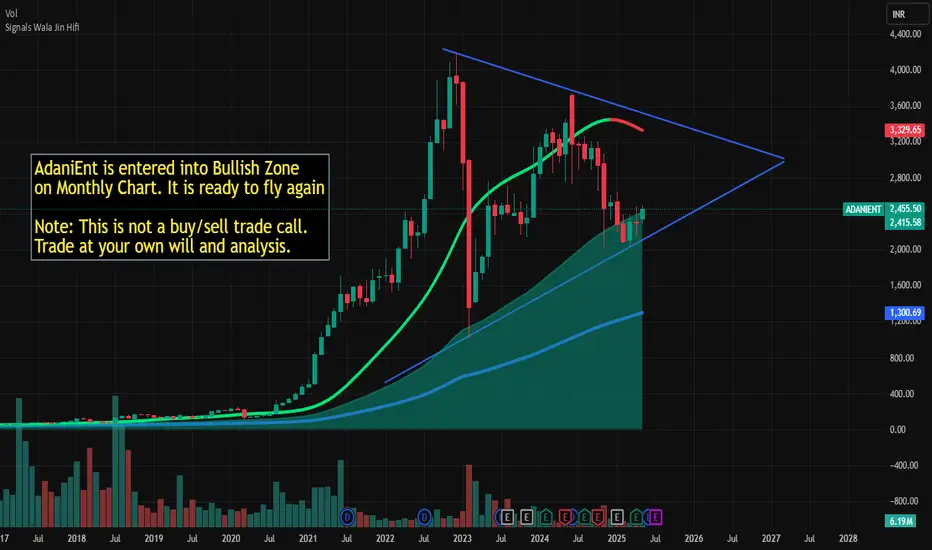
AdaniEnt is ready to fly againAdaniEnt is entered into Bullish Zone
on Monthly Chart. It is ready to fly again
Note: This is not a buy/sell trade call.
Trade at your own will and analysis.
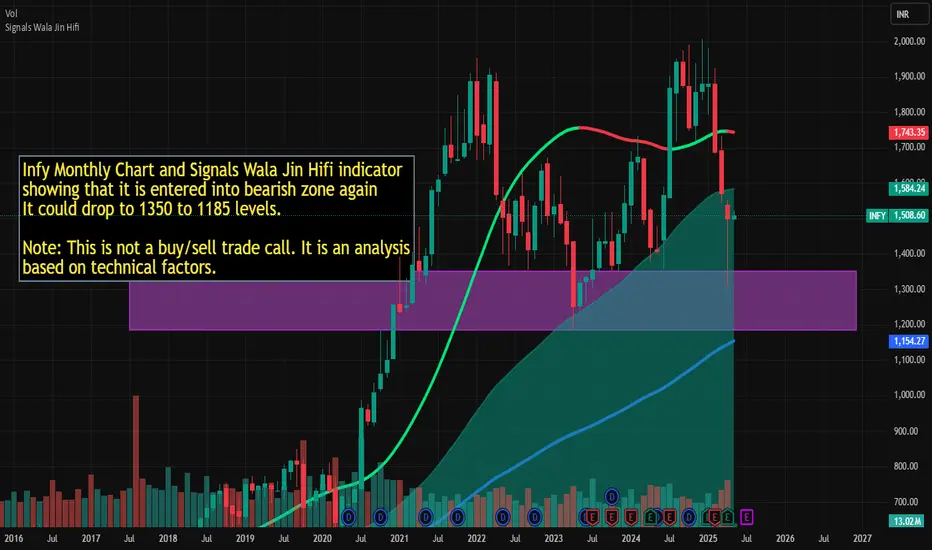
Infy could drop to 1350 to 1185 levels. Infy Monthly Chart and Signals Wala Jin Hifi indicator showing that it is entered into bearish zone again
It could drop to 1350 to 1185 levels.
Note: This is not a buy/sell trade call. It is an analysis based on technical factors.
AxisBank could drop to 1150 and 1100 for bounce backAxis Bank could drop to 1150 and 1100 levels for bounce back to 1200 and plus levels.
Note: This is not a buy/sell trade call. Trade at your own will and analysis. Use stop loss too.

Nifty Outlook for next weekNSE:NIFTY1!
Expecting a meltdown on Nifty for the next week, then a rapid push up towards the Buyside

GOLD Weekly Outlook 1st week of May 2025 COMEX:GC1!
Expecting another displacement towards the downside on Gold on a weekly fractal. Perfectly lined up with daily and weekly internals

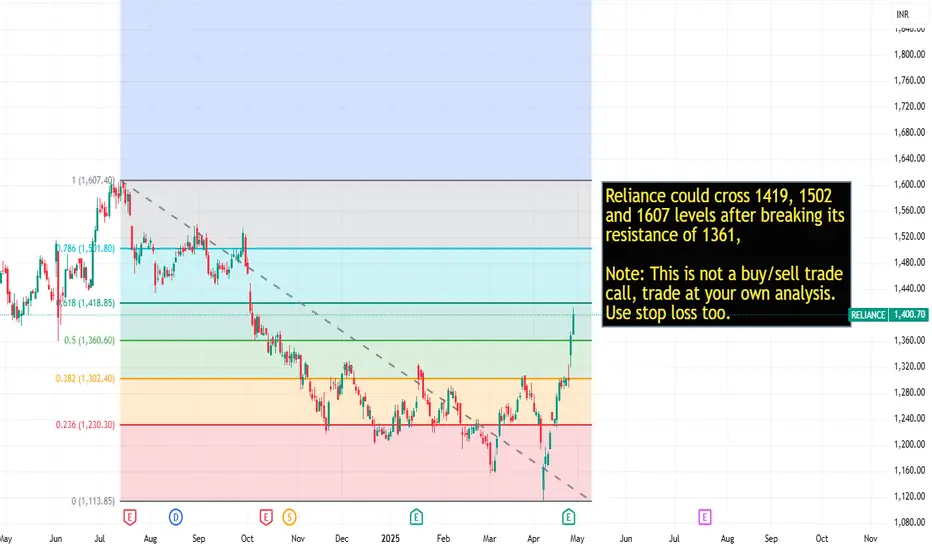
Reliance key levels after breakout of 1361Reliance could cross 1419, 1502
and 1607 levels after breaking its
resistance of 1361,
Note: This is not a buy/sell trade
call, trade at your own analysis.
Use stop loss too.
KFin Technologies LtdCompany Snapshot:
Sector: Financial Services (Mutual Fund Services, RTA)
Market Cap: ₹21,000 Cr
Current Price: ₹1,239.20
Debt-to-Equity: 0.06 (very low)
ROE: 39% | ROCE: 49%
Financial Highlights:
Revenue Growth (3Y CAGR): ~22%
Profit Growth (3Y CAGR): ~32%
EBITDA Margin: ~48%
P/E Ratio: ~35x (TTM)
Industry Avg P/E: ~30-32x
Recent Price Action:
Stock broke out sharply in April 2025.
Support: ₹1,180 | Resistance: ₹1,300
RSI near 70 (mildly overbought, but momentum strong).
Key Strengths:
Dominant RTA player with 70%+ MF asset share.
Consistent cash flows and expanding international footprint.
High operating leverage driving margin expansion.
Key Risks:
Regulatory changes (SEBI reforms) could pressure fees.
High client concentration risk with top AMCs.
Valuation & Recommendation:
DCF Estimated Fair Value: ₹1,280–₹1,350
Recommendation: BUY on Dips / Accumulate
12-month Target Price: ₹1,320
Investment Horizon: 1–2 years
📈 Verdict: Strong business fundamentals, steady growth, and low debt make KFin Technologies attractive for long-term investors. Minor corrections can offer better entry points.
For Education Purposes only

Live buy signal in AxisBank at 1182.6Live Khareedo (Buy) signal in AxisBank at 1182.6. Lets see how much it will rise.
Note: This is not a buy/sell trade call. Use stop loss.

Live buying signal in TataMotors at 664Live Khareedo (Buy) signal in Tata Motors at 664. Lets see how long it will go up.
Note: This is not a buy/sell trade call, trade at your own will and analysis. Use stop loss too.

Live buying signal in Reliance at 1348Live signal in Reliance at 1348 Khareedo (Buy), Lets see how long it will go up.
Note: This is not a buy/sell trade call. Use stop loss.

Live buying signal in Nifty 24275Live Khareedo (Buying) signal in Nifty at 24275, lets see how long it will go up.
Note: This is not a buy/sell trade call. trade at your own will and analysis. Use stop loss.

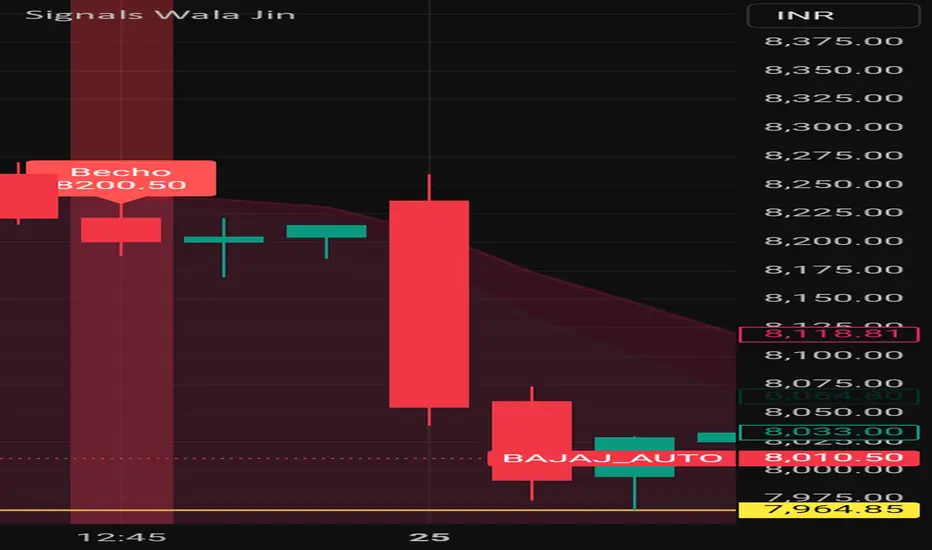
235 rupees dropped #BajajAuto share after signal 235 points dropped #BajajAuto share after generation of Signal "Becho" means sell by my custom designed indicator named SignalsWalaJin
Note: This is not a buy sell trade call. Trade at your own will. Use stop loss too.
113 rupe dropped Adanient after signal 113 rupees dropped #Adanient share after generation of Signal "Becho" means sell by my custom designed indicator named SignalsWalaJin
Note: This is not a buy sell trade call. Trade at your own will. Use stop loss too.

153 points dropped #Tac after SignalsWalaJin signal153 points dropped #Tac share after generation of Signal "Becho" means sell by my custom designed indicator named SignalsWalaJin
Note: This is not a buy sell trade call. Trade at your own will. Use stop loss too.

63 points dropped #AxisBank after #SignalsWalaJin signal63 points dropped #Axisbank share after generation of Signal "Becho" means sell by my custom designed indicator named SignalsWalaJin
Note: This is not a buy sell trade call. Trade at your own will. Use stop loss too.

Dixon in bearish zoneJadugar and Paka Kam generated signals Becho @ 16217 means sell at 16217, lets see how much it will fall.

IndusIndBk is in bearish zoneIndusIndBk is into bearish zone, my custom indicator generated sell "Becho" signal at 824.05 and it was dropped till 805 and rise again. Lets see how much it will drop.
Note: This is not a buy/sell call, Use stop loss too.
