IRCON - BREAKOUT STOCK FOR SWING TRADING#IRCON
SWING TRADING STOCK
Entry - 250
SL - 225
Targets - 280, 320
@Jagadheesh_JP
Nse

BANK NIFTY INTRADAY LEVELS FOR 03/05/2024BUY ABOVE - 49480
SL - 49340
TARGETS - 49670,49850,50000
SELL BELOW - 49180
SL - 49340
TARGETS - 49020,48800,48630
NO TRADE ZONE - 49180 to 49480
Previous Day High - 49480
Previous Day Low - 49180
Based on price action major support & resistance's are here, the red lines acts as resistances, the green lines acts as supports. If the price breaks the support/resistance, it will move to the next support/resistance line. White lines indicates previous day high & low, high acts as a resistance & low acts as a support for next day.
Trendlines are also significant to price action. If the price is above/below the trendlines, can expect an UP/DOWN with aggressive move.
Please NOTE: this levels are for intraday trading only.
Disclaimer - All information on this page is for educational purposes only,
we are not SEBI Registered, Please consult a SEBI registered financial advisor for your financial matters before investing And taking any decision. We are not responsible for any profit/loss you made.
Request your support and engagement by liking and commenting & follow to provide encouragement
HAPPY TRADING 👍

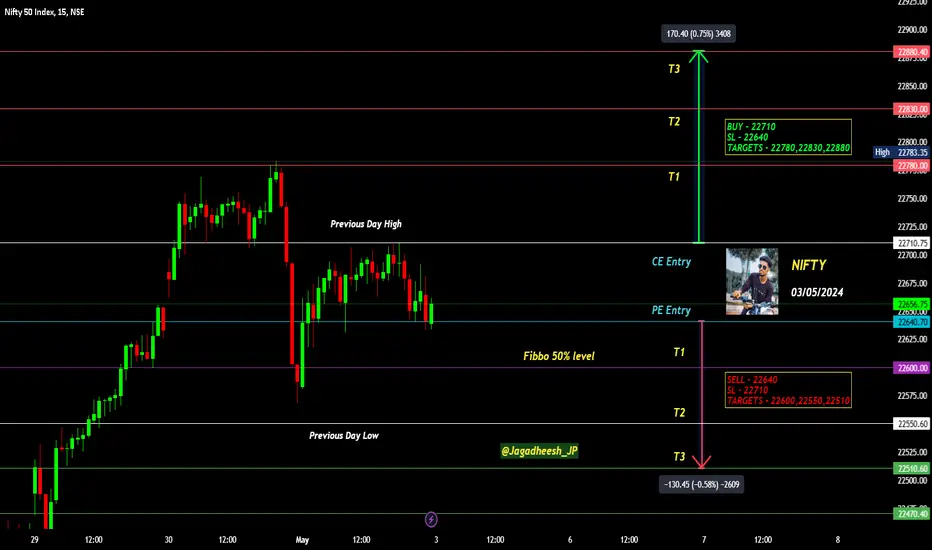
NIFTY INTRADAY LEVELS FOR 03/05/2024BUY ABOVE - 22710
SL - 22640
TARGETS - 22780,22830,22880
SELL BELOW - 22640
SL - 22710
TARGETS - 22600,22550,22510
NO TRADE ZONE - 22640 to 22710
Previous Day High - 22710
Previous Day Low - 22550
Based on price action major support & resistance's are here, the red lines acts as resistances, the green lines acts as supports. If the price breaks the support/resistance, it will move to the next support/resistance line. White lines indicates previous day high & low, high acts as a resistance & low acts as a support for next day.
Trendlines are also significant to price action. If the price is above/below the trendlines, can expect an UP/DOWN with aggressive move.
Please NOTE: this levels are for intraday trading only.
Disclaimer - All information on this page is for educational purposes only,
we are not SEBI Registered, Please consult a SEBI registered financial advisor for your financial matters before investing And taking any decision. We are not responsible for any profit/loss you made.
Request your support and engagement by liking and commenting & follow to provide encouragement
HAPPY TRADING 👍
PETRONET LNGThis stock breakout nearly 5 years consolidation level with huge volume
and this is only for educational purpose

BANK NIFTY INTRADAY LEVELS FOR 02/05/2024BUY ABOVE - 49480
SL - 49250
TARGETS - 49670,49850,50000
SELL BELOW - 49250
SL - 49480
TARGETS - 49020,48800,48630
NO TRADE ZONE - 49250 to 49480
Previous Day High - 50000
Previous Day Low - 49250
Based on price action major support & resistance's are here, the red lines acts as resistances, the green lines acts as supports. If the price breaks the support/resistance, it will move to the next support/resistance line. White lines indicates previous day high & low, high acts as a resistance & low acts as a support for next day.
Trendlines are also significant to price action. If the price is above/below the trendlines, can expect an UP/DOWN with aggressive move.
Please NOTE: this levels are for intraday trading only.
Disclaimer - All information on this page is for educational purposes only,
we are not SEBI Registered, Please consult a SEBI registered financial advisor for your financial matters before investing And taking any decision. We are not responsible for any profit/loss you made.
Request your support and engagement by liking and commenting & follow to provide encouragement
HAPPY TRADING 👍

NIFTY INTRADAY LEVELS FOR 02/05/2024BUY ABOVE - 22600
SL - 22550
TARGETS - 22660,22710,22780
SELL BELOW - 22550
SL - 22600
TARGETS - 22510,22470,22430
NO TRADE ZONE - 22550 to 22600
Previous Day High - 22780
Previous Day Low - 22550
Based on price action major support & resistance's are here, the red lines acts as resistances, the green lines acts as supports. If the price breaks the support/resistance, it will move to the next support/resistance line. White lines indicates previous day high & low, high acts as a resistance & low acts as a support for next day.
Trendlines are also significant to price action. If the price is above/below the trendlines, can expect an UP/DOWN with aggressive move.
Please NOTE: this levels are for intraday trading only.
Disclaimer - All information on this page is for educational purposes only,
we are not SEBI Registered, Please consult a SEBI registered financial advisor for your financial matters before investing And taking any decision. We are not responsible for any profit/loss you made.
Request your support and engagement by liking and commenting & follow to provide encouragement
HAPPY TRADING 👍

NIFTY50 BULLISH CHANNELNIFTY is playing inside a strong bullish channel where we witness a steady growth ever since the bullish sentiment. Price respected the previous high created on the daily timeframe. Where we might see some price action intact with the upper and lower boundaries for sometime. With a future breakout confirmation on the lower boundary, we may witness a bearish trend with a nice bearish momentum.

NIFTY stuck in channelNSE:NIFTY at its all-time high is consolidating in a channel pattern between 22000 and 23000.
Good time to accumulate value stocks to reap benefits if nifty breaks upwards.
Also reserve to pump in capital if nifty breaks downwards.
Key note : Always follow proper risk management to avoid losing capital from false breakouts as this is common.
Caution : This is a knowledge sharing analysis, not a call.
Profits are not made from following ideas, but by following Risk Management.

BANK NIFTY INTRADAY LEVELS FOR 30/04/2024BUY ABOVE - 49480
SL - 49250
TARGETS - 49670,49850,50000
SELL BELOW - 49250
SL - 49480
TARGETS - 49020,48800,48630
NO TRADE ZONE - 49250 to 49480
Previous Day High - 49480
Previous Day Low - 48310
Based on price action major support & resistance's are here, the red lines acts as resistances, the green lines acts as supports. If the price breaks the support/resistance, it will move to the next support/resistance line. White lines indicates previous day high & low, high acts as a resistance & low acts as a support for next day.
Trendlines are also significant to price action. If the price is above/below the trendlines, can expect an UP/DOWN with aggressive move.
Please NOTE: this levels are for intraday trading only.
Disclaimer - All information on this page is for educational purposes only,
we are not SEBI Registered, Please consult a SEBI registered financial advisor for your financial matters before investing And taking any decision. We are not responsible for any profit/loss you made.
Request your support and engagement by liking and commenting & follow to provide encouragement
HAPPY TRADING 👍

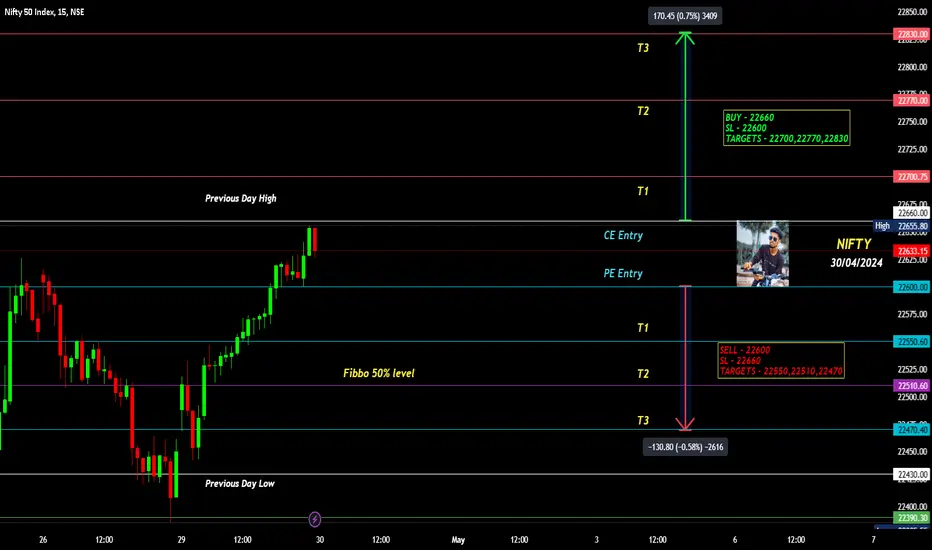
NIFTY INTRADAY LEVELS FOR 30/04/2024BUY ABOVE - 22660
SL - 22600
TARGETS - 22700,22770,22830
SELL BELOW - 22600
SL - 22660
TARGETS - 22550,22510,22470
NO TRADE ZONE - 22600 to 22660
Previous Day High - 22660
Previous Day Low - 22430
Based on price action major support & resistance's are here, the red lines acts as resistances, the green lines acts as supports. If the price breaks the support/resistance, it will move to the next support/resistance line. White lines indicates previous day high & low, high acts as a resistance & low acts as a support for next day.
Trendlines are also significant to price action. If the price is above/below the trendlines, can expect an UP/DOWN with aggressive move.
Please NOTE: this levels are for intraday trading only.
Disclaimer - All information on this page is for educational purposes only,
we are not SEBI Registered, Please consult a SEBI registered financial advisor for your financial matters before investing And taking any decision. We are not responsible for any profit/loss you made.
Request your support and engagement by liking and commenting & follow to provide encouragement
HAPPY TRADING 👍
IOC Bullish Breakout IdentifiedIdentified a bullish breakout on the flag formed. Here we expect a continuation in the rally back towards the previous high formed close to 192+

ICICIBANK Bullish trend ContinuationContinuation in the bullish trend formed under the daily timeframe. Once again we witness a bullish breakout on the bull flag formed where we see a potential rally to the upside. This trend remains strong and valid with a perfect bullish setup.

BANK NIFTY INTRADAY LEVEL FOR 29/04/2024BUY ABOVE - 48310
SL - 48220
TARGETS - 48400,48500,48630
SELL BELOW - 48120
SL - 48220
TARGETS - 48030,47940,47840
NO TRADE ZONE - 48120 to 48310
Previous Day High - 48630
Previous Day Low - 48120
Based on price action major support & resistance's are here, the red lines acts as resistances, the green lines acts as supports. If the price breaks the support/resistance, it will move to the next support/resistance line. White lines indicates previous day high & low, high acts as a resistance & low acts as a support for next day.
Trendlines are also significant to price action. If the price is above/below the trendlines, can expect an UP/DOWN with aggressive move.
Please NOTE: this levels are for intraday trading only.
Disclaimer - All information on this page is for educational purposes only,
we are not SEBI Registered, Please consult a SEBI registered financial advisor for your financial matters before investing And taking any decision. We are not responsible for any profit/loss you made.
Request your support and engagement by liking and commenting & follow to provide encouragement
HAPPY TRADING 👍

NIFTY INTRADAY LEVELS FOR 29/04/2024BUY ABOVE - 22470
SL - 22430
TARGETS - 22510,22550,22620
SELL BELOW - 22390
SL - 22430
TARGETS - 22360,22320,22270
NO TRADE ZONE - 22390 to 22470
Previous Day High - 22620
Previous Day Low - 22390
Based on price action major support & resistance's are here, the red lines acts as resistances, the green lines acts as supports. If the price breaks the support/resistance, it will move to the next support/resistance line. White lines indicates previous day high & low, high acts as a resistance & low acts as a support for next day.
Trendlines are also significant to price action. If the price is above/below the trendlines, can expect an UP/DOWN with aggressive move.
Please NOTE: this levels are for intraday trading only.
Disclaimer - All information on this page is for educational purposes only,
we are not SEBI Registered, Please consult a SEBI registered financial advisor for your financial matters before investing And taking any decision. We are not responsible for any profit/loss you made.
Request your support and engagement by liking and commenting & follow to provide encouragement
HAPPY TRADING 👍

An Ascending Triangle for MARICO!!!The ascending triangle is a bullish formation that usually forms during an uptrend as a continuation pattern!
For target measure the distance from the start of the pattern, at the lowest point of the rising trendline to the flat support line. That same distance can be transposed later on, starting from the breakout point and ending at the potential take profit level!

#VOLTAS 1Hr Time FrameLikely to hit upper targets in a few days.
Rising RSI
Rising momentum
Good volume
Strategy supporting BUY position and hold till Target 4.
All the best.

MPHASIS Potential LONG Entry in 1Hr TFMPHASIS - Looking like a good LONG entry from here.
Once the Risological Karma goes green, it is an entry point.
Good short term gains on this trade, will update you how it goes.

KPITECH Likely to hit all targets in a few days.After a successful and profitable SHORT position, KPITECH is ready to give profits in LONG position. Good reversal in 1 Hr TF and 15m scalp looks good too!

PATANJALI Likely to hit all targets within 1 weekPATANJALI gave a clear entry on April 16, good breakout with volume.
Has hit our 3rd target so far and is likely to hit all targets in a weeks time.

BANK NIFTY INTRADAY LEVELS FOR 26/04/2024BUY ABOVE - 48630
SL - 48500
TARGETS - 48800,48930,49050
SELL BELOW - 48400
SL - 48500
TARGETS - 48310,48220,48120
NO TRADE ZONE - 48400 to 48630
Previous Day High - 48630
Previous Day Low - 47730
Based on price action major support & resistance's are here, the red lines acts as resistances, the green lines acts as supports. If the price breaks the support/resistance, it will move to the next support/resistance line. White lines indicates previous day high & low, high acts as a resistance & low acts as a support for next day.
Trendlines are also significant to price action. If the price is above/below the trendlines, can expect an UP/DOWN with aggressive move.
Please NOTE: this levels are for intraday trading only.
Disclaimer - All information on this page is for educational purposes only,
we are not SEBI Registered, Please consult a SEBI registered financial advisor for your financial matters before investing And taking any decision. We are not responsible for any profit/loss you made.
Request your support and engagement by liking and commenting & follow to provide encouragement
HAPPY TRADING 👍

NIFTY INTRADAY LEVELS FOR 26/04/2024BUY ABOVE - 22620
SL - 22570
TARGETS - 22670,22720,22770
SELL BELOW - 22510
SL - 22570
TARGETS - 22510,22430,22390
NO TRADE ZONE - 22510 to 22620
Previous Day High - 22620
Previous Day Low - 22320
Based on price action major support & resistance's are here, the red lines acts as resistances, the green lines acts as supports. If the price breaks the support/resistance, it will move to the next support/resistance line. White lines indicates previous day high & low, high acts as a resistance & low acts as a support for next day.
Trendlines are also significant to price action. If the price is above/below the trendlines, can expect an UP/DOWN with aggressive move.
Please NOTE: this levels are for intraday trading only.
Disclaimer - All information on this page is for educational purposes only,
we are not SEBI Registered, Please consult a SEBI registered financial advisor for your financial matters before investing And taking any decision. We are not responsible for any profit/loss you made.
Request your support and engagement by liking and commenting & follow to provide encouragement
HAPPY TRADING 👍

🇮🇳 YESBANK Analysis📉Potential downside momentum can be expected under the hourly timeframe where we may witness a reversal on the lower boundary created.

BANK NIFTY INTRADAY LEVELS FOR 25/04/2024BUY ABOVE - 48260
SL - 48120
TARGETS - 48400,48510,48670
SELL BELOW - 48120
SL - 48260
TARGETS - 48030,47940,47840
NO TRADE ZONE - 48120 to 48260
Previous Day High - 48260
Previous Day Low - 48030
Based on price action major support & resistance's are here, the red lines acts as resistances, the green lines acts as supports. If the price breaks the support/resistance, it will move to the next support/resistance line. White lines indicates previous day high & low, high acts as a resistance & low acts as a support for next day.
Trendlines are also significant to price action. If the price is above/below the trendlines, can expect an UP/DOWN with aggressive move.
Please NOTE: this levels are for intraday trading only.
Disclaimer - All information on this page is for educational purposes only,
we are not SEBI Registered, Please consult a SEBI registered financial advisor for your financial matters before investing And taking any decision. We are not responsible for any profit/loss you made.
Request your support and engagement by liking and commenting & follow to provide encouragement
HAPPY TRADING 👍
