NIFTY INTRADAY LEVELS FOR 11/03/2024BUY ABOVE - 22520
SL - 22500
TARGETS - 22580,22650,22700
SELL BELOW - 22470
SL - 22500
TARGETS - 22430,22380,22350
NO TRADE ZONE - 22470 to 22520
Previous Day High - 22520
Previous Day Low - 22430
Based on price action major support & resistance's are here, the red lines acts as resistances, the green lines acts as supports. If the price breaks the support/resistance, it will move to the next support/resistance line. White lines indicates previous day high & low, high acts as a resistance & low acts as a support for next day.
Trendlines are also significant to price action. If the price is above/below the trendlines, can expect an UP/DOWN with aggressive move.
Please NOTE: this levels are for intraday trading only.
Disclaimer - All information on this page is for educational purposes only,
we are not SEBI Registered, Please consult a SEBI registered financial advisor for your financial matters before investing And taking any decision. We are not responsible for any profit/loss you made.
Request your support and engagement by liking and commenting & follow to provide encouragement
HAPPY TRADING 👍
Nse

BANK NIFTY INTRADAY LEVELS FOR 07/03/2024BUY ABOVE - 48020
SL - 47880
TARGETS - 48160,48310,48440
SELL BELOW - 47880
SL - 48020
TARGETS - 47750,47650,47500
NO TRADE ZONE - 47880 to 48020
Previous Day High - 48160
Previous Day Low - 47500
Based on price action major support & resistance's are here, the red lines acts as resistances, the green lines acts as supports. If the price breaks the support/resistance, it will move to the next support/resistance line. White lines indicates previous day high & low, high acts as a resistance & low acts as a support for next day.
Trendlines are also significant to price action. If the price is above/below the trendlines, can expect an UP/DOWN with aggressive move.
Please NOTE: this levels are for intraday trading only.
Disclaimer - All information on this page is for educational purposes only,
we are not SEBI Registered, Please consult a SEBI registered financial advisor for your financial matters before investing And taking any decision. We are not responsible for any profit/loss you made.
Request your support and engagement by liking and commenting & follow to provide encouragement
HAPPY TRADING 👍

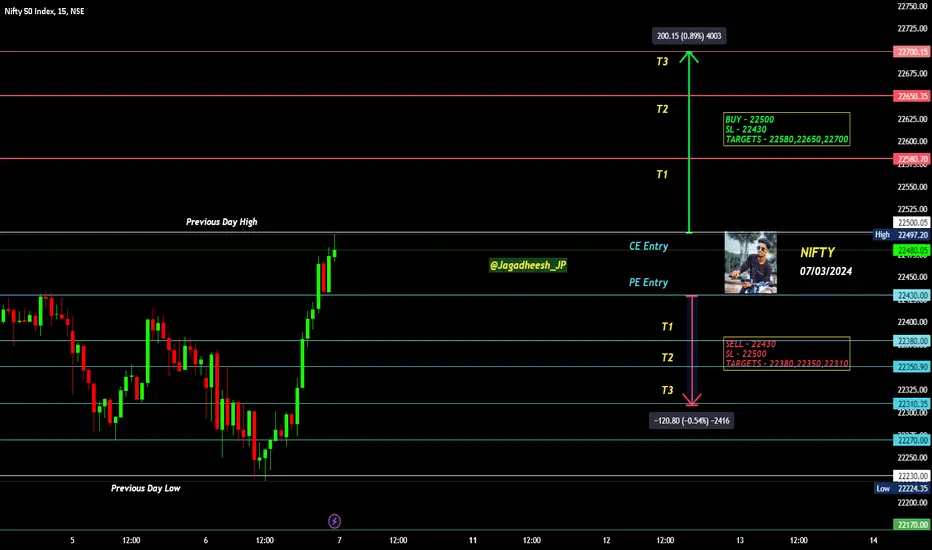
NIFTY INTRADAY LEVELS FOR 07/03/2024BUY ABOVE - 22500
SL - 22430
TARGETS - 22580,22650,22700
SELL BELOW - 22430
SL - 22500
TARGETS - 22380,22350,22310
NO TRADE ZONE - 22430 to 22500
Previous Day High - 22500
Previous Day Low - 22230
Based on price action major support & resistance's are here, the red lines acts as resistances, the green lines acts as supports. If the price breaks the support/resistance, it will move to the next support/resistance line. White lines indicates previous day high & low, high acts as a resistance & low acts as a support for next day.
Trendlines are also significant to price action. If the price is above/below the trendlines, can expect an UP/DOWN with aggressive move.
Please NOTE: this levels are for intraday trading only.
Disclaimer - All information on this page is for educational purposes only,
we are not SEBI Registered, Please consult a SEBI registered financial advisor for your financial matters before investing And taking any decision. We are not responsible for any profit/loss you made.
Request your support and engagement by liking and commenting & follow to provide encouragement
HAPPY TRADING 👍
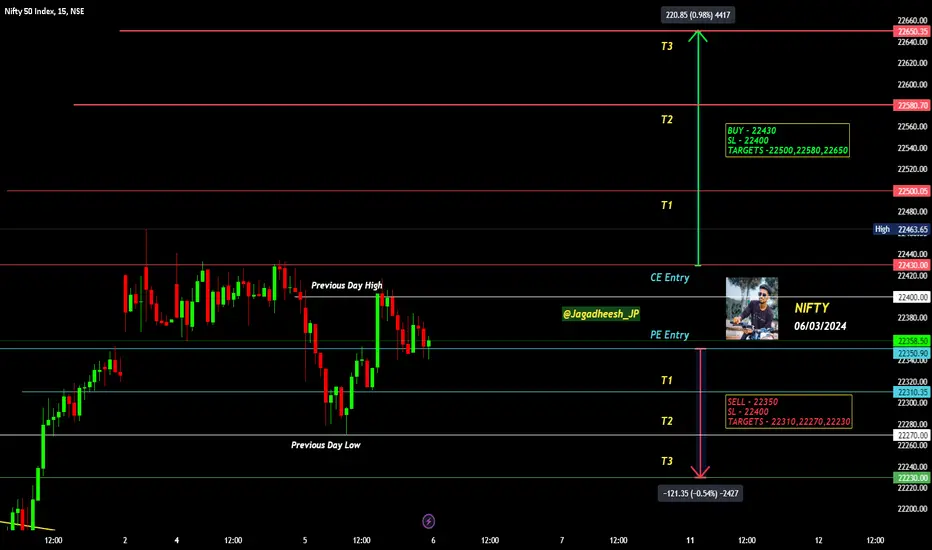
NIFTY INTRADAY LEVELS FOR 06/03/2024BUY ABOVE - 22430
SL - 22400
TARGETS -22500,22580,22650
SELL BELOW - 22350
SL - 22400
TARGETS - 22310,22270,22230
NO TRADE ZONE - 22350 to 22430
Previous Day High - 2200
Previous Day Low - 22270
Based on price action major support & resistance's are here, the red lines acts as resistances, the green lines acts as supports. If the price breaks the support/resistance, it will move to the next support/resistance line. White lines indicates previous day high & low, high acts as a resistance & low acts as a support for next day.
Trendlines are also significant to price action. If the price is above/below the trendlines, can expect an UP/DOWN with aggressive move.
Please NOTE: this levels are for intraday trading only.
Disclaimer - All information on this page is for educational purposes only,
we are not SEBI Registered, Please consult a SEBI registered financial advisor for your financial matters before investing And taking any decision. We are not responsible for any profit/loss you made.
Request your support and engagement by liking and commenting & follow to provide encouragement
HAPPY TRADING 👍
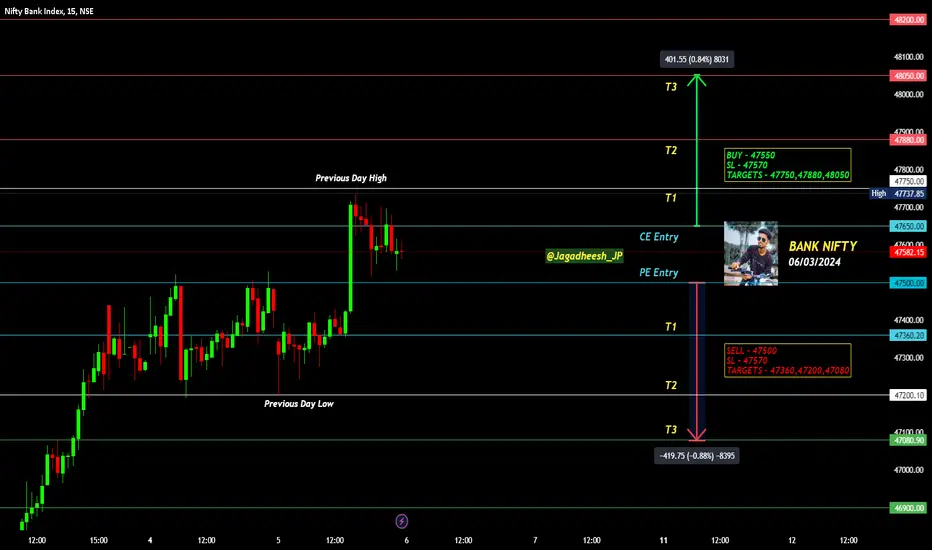
BANK NIFTY INTRADAY LEVELS FOR 06/03/2024BUY ABOVE - 47550
SL - 47570
TARGETS - 47750,47880,48050
SELL BELOW - 47500
SL - 47570
TARGETS - 47360,47200,47080
NO TRADE ZONE - 47500 to 47650
Previous Day High - 47750
Previous Day Low - 47200
Based on price action major support & resistance's are here, the red lines acts as resistances, the green lines acts as supports. If the price breaks the support/resistance, it will move to the next support/resistance line. White lines indicates previous day high & low, high acts as a resistance & low acts as a support for next day.
Trendlines are also significant to price action. If the price is above/below the trendlines, can expect an UP/DOWN with aggressive move.
Please NOTE: this levels are for intraday trading only.
Disclaimer - All information on this page is for educational purposes only,
we are not SEBI Registered, Please consult a SEBI registered financial advisor for your financial matters before investing And taking any decision. We are not responsible for any profit/loss you made.
Request your support and engagement by liking and commenting & follow to provide encouragement
HAPPY TRADING 👍
BANK NIFTY INTRADAY LEVELS FOR 05/03/2024BUY ABOVE - 47500
SL - 47360
TARGETS - 47640,47750,47880
SELL BELOW - 47360
SL - 47500
TARGETS - 47200,47080,46900
NO TRADE ZONE - 47360 to 47500
Previous Day High - 47500
Previous Day Low - 47200
Based on price action major support & resistance's are here, the red lines acts as resistances, the green lines acts as supports. If the price breaks the support/resistance, it will move to the next support/resistance line. White lines indicates previous day high & low, high acts as a resistance & low acts as a support for next day.
Trendlines are also significant to price action. If the price is above/below the trendlines, can expect an UP/DOWN with aggressive move.
Please NOTE: this levels are for intraday trading only.
Disclaimer - All information on this page is for educational purposes only,
we are not SEBI Registered, Please consult a SEBI registered financial advisor for your financial matters before investing And taking any decision. We are not responsible for any profit/loss you made.
Request your support and engagement by liking and commenting & follow to provide encouragement
HAPPY TRADING 👍

NIFTY INTRADAY LEVELS FOR 05/03/2024BUY ABOVE - 22430
SL - 22370
TARGETS -22500,22580,22650
SELL BELOW - 22350
SL - 22400
TARGETS - 22310,22270,22230
NO TRADE ZONE - 22350 to 22430
Previous Day High - 22430
Previous Day Low - 22370
Based on price action major support & resistance's are here, the red lines acts as resistances, the green lines acts as supports. If the price breaks the support/resistance, it will move to the next support/resistance line. White lines indicates previous day high & low, high acts as a resistance & low acts as a support for next day.
Trendlines are also significant to price action. If the price is above/below the trendlines, can expect an UP/DOWN with aggressive move.
Please NOTE: this levels are for intraday trading only.
Disclaimer - All information on this page is for educational purposes only,
we are not SEBI Registered, Please consult a SEBI registered financial advisor for your financial matters before investing And taking any decision. We are not responsible for any profit/loss you made.
Request your support and engagement by liking and commenting & follow to provide encouragement
HAPPY TRADING 👍

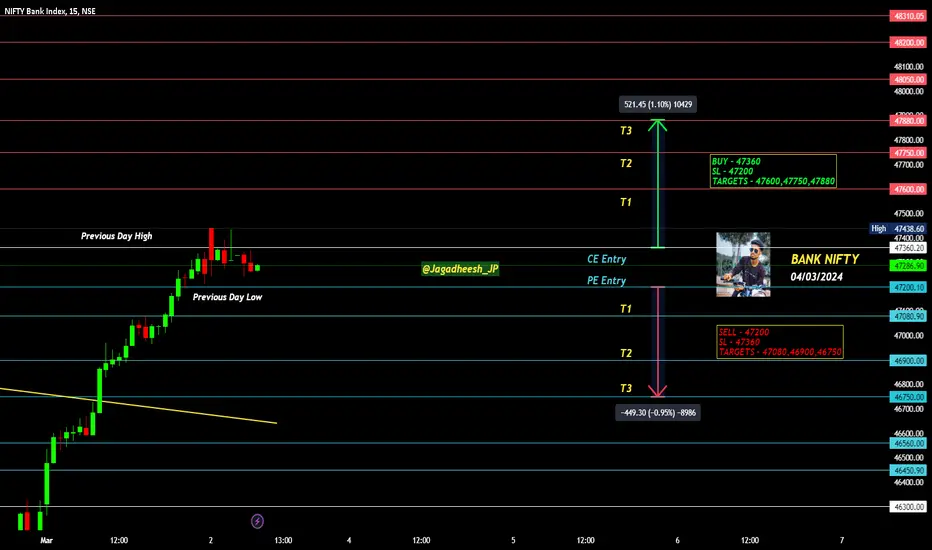
BANK NIFTY INTRADAY LEVELS FOR 04/03/2024BUY ABOVE - 47360
SL - 47200
TARGETS - 47600,47750,47880
SELL BELOW - 47200
SL - 47360
TARGETS - 47080,46900,46750
NO TRADE ZONE - 47200 to 47350
Previous Day High - 47350
Previous Day Low - 46300
Based on price action major support & resistance's are here, the red lines acts as resistances, the green lines acts as supports. If the price breaks the support/resistance, it will move to the next support/resistance line. White lines indicates previous day high & low, high acts as a resistance & low acts as a support for next day.
Trendlines are also significant to price action. If the price is above/below the trendlines, can expect an UP/DOWN with aggressive move.
Please NOTE: this levels are for intraday trading only.
Disclaimer - All information on this page is for educational purposes only,
we are not SEBI Registered, Please consult a SEBI registered financial advisor for your financial matters before investing And taking any decision. We are not responsible for any profit/loss you made.
Request your support and engagement by liking and commenting & follow to provide encouragement
HAPPY TRADING 👍
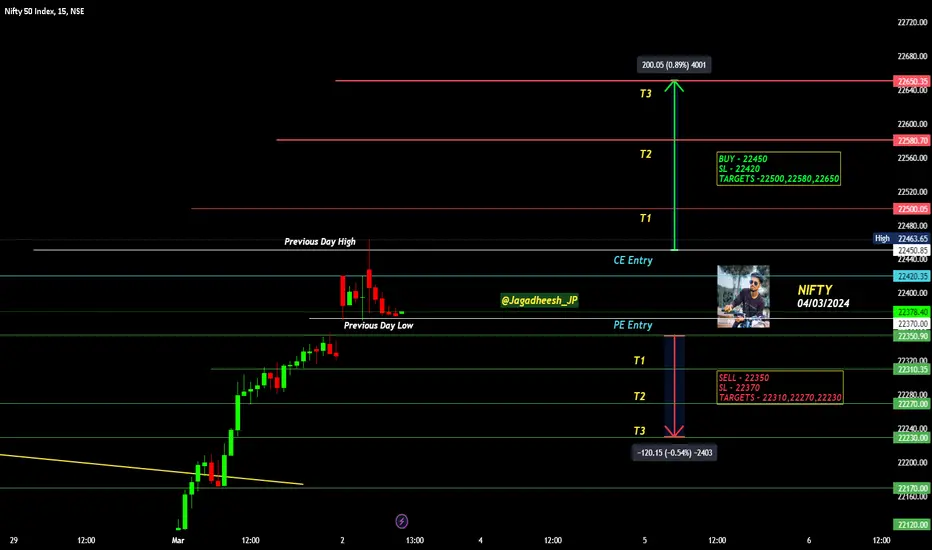
NIFTY INTRADAY LEVELS FOR 04/03/2024BUY ABOVE - 22450
SL - 22420
TARGETS -22500,22580,22650
SELL BELOW - 22350
SL - 22370
TARGETS - 22310,22270,22230
NO TRADE ZONE - 22350 to 22450
Previous Day High - 22450
Previous Day Low - 22370
Based on price action major support & resistance's are here, the red lines acts as resistances, the green lines acts as supports. If the price breaks the support/resistance, it will move to the next support/resistance line. White lines indicates previous day high & low, high acts as a resistance & low acts as a support for next day.
Trendlines are also significant to price action. If the price is above/below the trendlines, can expect an UP/DOWN with aggressive move.
Please NOTE: this levels are for intraday trading only.
Disclaimer - All information on this page is for educational purposes only,
we are not SEBI Registered, Please consult a SEBI registered financial advisor for your financial matters before investing And taking any decision. We are not responsible for any profit/loss you made.
Request your support and engagement by liking and commenting & follow to provide encouragement
HAPPY TRADING 👍
I am BULLISH on AAVAS!!!Taking a long position regardless of the bearish pattern!
The stock is down over 50% from its all time high and seems consolidation done!
Long in it!
Target-2200
Above that TSL!

DEVYANI is ready for a feast!!!150 has always been a responsive zone!
A position near it with a sl below the rance and target being the resistance!
Would like to hold and see if it gives the potential breakout returns!
Long in it!

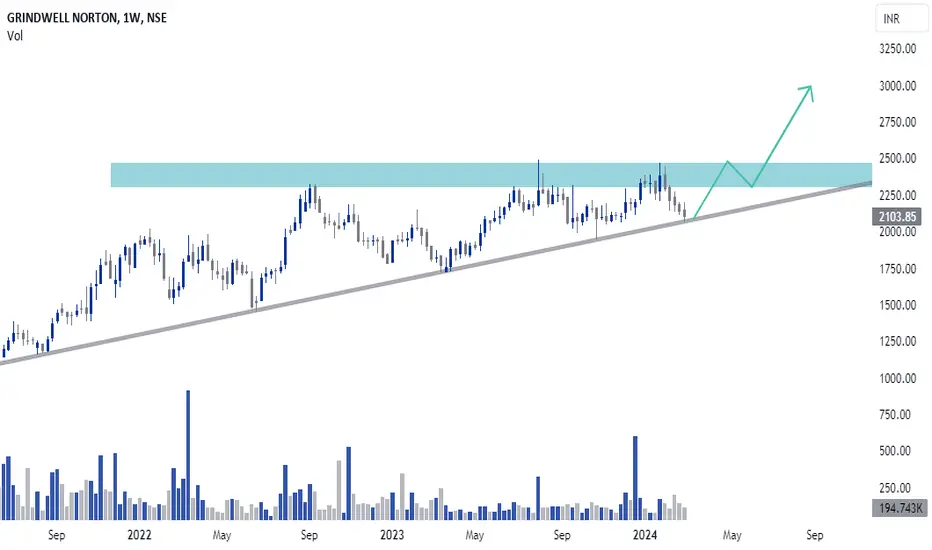
GRINDWELL NORTON This stock took support from major trendline stock create good opportunity for swing trade
and this is only for educational purpose
TATA STEEL LTDThis stock breakout ATH level and 2 years major resistance breakout and TGT will be 1:4 level
and this is only for educational purpose

BANK NIFTY INTRADAY LEVELS FOR SATURDAY 02/03/2024BUY ABOVE - 47360
SL - 47200
TARGETS - 47600,47750,47880
SELL BELOW - 47200
SL - 47360
TARGETS - 47080,46900,46750
NO TRADE ZONE - 47200 to 47350
Previous Day High - 47350
Previous Day Low - 46300
Based on price action major support & resistance's are here, the red lines acts as resistances, the green lines acts as supports. If the price breaks the support/resistance, it will move to the next support/resistance line. White lines indicates previous day high & low, high acts as a resistance & low acts as a support for next day.
Trendlines are also significant to price action. If the price is above/below the trendlines, can expect an UP/DOWN with aggressive move.
Please NOTE: this levels are for intraday trading only.
Disclaimer - All information on this page is for educational purposes only,
we are not SEBI Registered, Please consult a SEBI registered financial advisor for your financial matters before investing And taking any decision. We are not responsible for any profit/loss you made.
Request your support and engagement by liking and commenting & follow to provide encouragement
HAPPY TRADING 👍

NIFTY INTRADAY LEVELS FOR SATURDAY TRADING 02/03/2024BUY ABOVE - 22350
SL - 22210
TARGETS -22230,22170,22120
SELL BELOW - 22940
SL - 21990
TARGETS - 21890,21850,21800
NO TRADE ZONE - 22310 to 22350
Previous Day High - 22350
Previous Day Low - 22060
Based on price action major support & resistance's are here, the red lines acts as resistances, the green lines acts as supports. If the price breaks the support/resistance, it will move to the next support/resistance line. White lines indicates previous day high & low, high acts as a resistance & low acts as a support for next day.
Trendlines are also significant to price action. If the price is above/below the trendlines, can expect an UP/DOWN with aggressive move.
Please NOTE: this levels are for intraday trading only.
Disclaimer - All information on this page is for educational purposes only,
we are not SEBI Registered, Please consult a SEBI registered financial advisor for your financial matters before investing And taking any decision. We are not responsible for any profit/loss you made.
Request your support and engagement by liking and commenting & follow to provide encouragement
HAPPY TRADING 👍

SWING IDEA - SAINT GOBAIN
Strong breakout and a retest is on going
previously 111 levels acted as a strong resistance and now it is broken and is acting like a support
50EMA support on daily TF
0.61% Fibonacci support

BANK NIFTY INTRADAY LEVELS FOR 01/03/2024BUY ABOVE - 46300
SL - 46100
TARGETS - 46450,46560,46750
SELL BELOW - 45930
SL - 46100
TARGETS - 45730,45570,45330
NO TRADE ZONE - 45930 to 46300
Previous Day High - 46300
Previous Day Low - 45730
Based on price action major support & resistance's are here, the red lines acts as resistances, the green lines acts as supports. If the price breaks the support/resistance, it will move to the next support/resistance line. White lines indicates previous day high & low, high acts as a resistance & low acts as a support for next day.
Trendlines are also significant to price action. If the price is above/below the trendlines, can expect an UP/DOWN with aggressive move.
Please NOTE: this levels are for intraday trading only.
Disclaimer - All information on this page is for educational purposes only,
we are not SEBI Registered, Please consult a SEBI registered financial advisor for your financial matters before investing And taking any decision. We are not responsible for any profit/loss you made.
Request your support and engagement by liking and commenting & follow to provide encouragement
HAPPY TRADING 👍

NIFTY INTRADAY LEVELS FOR 01/03/2024BUY ABOVE - 22060
SL - 22020
TARGETS -22120,22170,22230
SELL BELOW - 22940
SL - 21990
TARGETS - 21890,21850,21800
NO TRADE ZONE - 21940 to 22060
Previous Day High - 22060
Previous Day Low - 21850
Based on price action major support & resistance's are here, the red lines acts as resistances, the green lines acts as supports. If the price breaks the support/resistance, it will move to the next support/resistance line. White lines indicates previous day high & low, high acts as a resistance & low acts as a support for next day.
Trendlines are also significant to price action. If the price is above/below the trendlines, can expect an UP/DOWN with aggressive move.
Please NOTE: this levels are for intraday trading only.
Disclaimer - All information on this page is for educational purposes only,
we are not SEBI Registered, Please consult a SEBI registered financial advisor for your financial matters before investing And taking any decision. We are not responsible for any profit/loss you made.
Request your support and engagement by liking and commenting & follow to provide encouragement
HAPPY TRADING 👍

POONAWALA FINCORP long idea accumulate between 375 and add at 340s for the long term. exit on any break of 270s this is a long term play

NCC long idea LONG TERM PICK , can buy around 148/149 sl 134
solid order book , hopefully company walks the talk

TEXRAIL watch added , long near fib support
near around 120s small and then 115'S .
STOP CAN BE below 100'S

SWELECT long near 645 strong volumes , consistent , breaking over consistently , some strong hands look involved ,

IRCON long 137 another railway story , maybe im entering a bit too early again , lets find out soon
support at 137 , if the gap fills and reverses might be good to go
else will exit and attempt to enter again at 120'S
