NIFTY INTRADAY LEVELS FOR 25/10/2023BUY ABOVE - 19330
SL - 19290
TARGETS - 19380,19440,19490
SELL BELOW - 19260
SL - 19290
TARGETS - 19200,19140,19070
NO TRADE ZONE - 19260 to 19330
Previous Day High - 19560
Previous Day Low - 19260
I am sharing NIFTY levels this levels acts as important support & resistance for intraday. if you want to trade with this levels wait for 15 min Candle closing above that levels. You can trade with breakout and reversal both.
In this channel, I share my expertise in trading strategies, technical analysis, and market trends to help you make informed decisions in your trading ventures.
Stay tuned for daily updates, in-depth market analyses, and real-time trading scenarios to witness firsthand how we transform from Zero to Hero in the trading world. My Only aim is to empower you with the knowledge and skills necessary to navigate the complexities of the financial markets successfully.
Based on price action major support & resistance's are here, the red lines acts as resistances, the green lines acts as supports. If the price breaks the support/resistance, it will move to the next support/resistance line. White lines indicates previous day high & low, high acts as a resistance & low acts as a support for next day.
Please NOTE: this levels are for intraday trading only.
Disclaimer - All information on this page is for educational purposes only,
we are not SEBI Registered, Please consult a SEBI registered financial advisor for your financial matters before investing And taking any decision. We are not responsible for any profit/loss you made.
Request your support and engagement by liking and commenting & follow to provide encouragement
HAPPY TRADING 👍
Nse

BANK NIFTY INTRADAY LEVELS FOR 25/10/2023BUY ABOVE - 43200
SL - 43030
TARGETS - 43350,43600,43730
SELL BELOW - 43030
SL - 43200
TARGETS - 42800,42500,42270
NO TRADE ZONE - 43030 to 43200
Previous Day High - 43850
Previous Day Low - 43030
I am sharing BANK NIFTY levels this levels acts as important support & resistance for intraday. if you want to trade with this levels wait for 15 min Candle closing above that levels. You can trade with breakout and reversal both.
In this channel, I share my expertise in trading strategies, technical analysis, and market trends to help you make informed decisions in your trading ventures.
Stay tuned for daily updates, in-depth market analyses, and real-time trading scenarios to witness firsthand how we transform from Zero to Hero in the trading world. My Only aim is to empower you with the knowledge and skills necessary to navigate the complexities of the financial markets successfully.
Based on price action major support & resistance's are here, the red lines acts as resistances, the green lines acts as supports. If the price breaks the support/resistance, it will move to the next support/resistance line. White lines indicates previous day high & low, high acts as a resistance & low acts as a support for next day.
Trendlines are also significant to price action. If the price is above/below the trendlines, can expect an UP/DOWN with aggressive move.
Please NOTE: this levels are for intraday trading only.
Disclaimer - All information on this page is for educational purposes only,
we are not SEBI Registered, Please consult a SEBI registered financial advisor for your financial matters before investing And taking any decision. We are not responsible for any profit/loss you made.
Request your support and engagement by liking and commenting & follow to provide encouragement
HAPPY TRADING 👍

BANK NIFTY INTRADAY LEVELS FOR 23/10/2023BUY ABOVE - 43850
SL - 43730
TARGETS - 43970,44060,44210
SELL BELOW - 43600
SL - 43730
TARGETS - 43450,43350,43200
NO TRADE ZONE - 43730 to 43970
Previous Day High - 43850
Previous Day Low - 43600
I am sharing BANK NIFTY levels this levels acts as important support & resistance for intraday. if you want to trade with this levels wait for 15 min Candle closing above that levels. You can trade with breakout and reversal both.
In this channel, I share my expertise in trading strategies, technical analysis, and market trends to help you make informed decisions in your trading ventures.
Stay tuned for daily updates, in-depth market analyses, and real-time trading scenarios to witness firsthand how we transform from Zero to Hero in the trading world. My Only aim is to empower you with the knowledge and skills necessary to navigate the complexities of the financial markets successfully.
Based on price action major support & resistance's are here, the red lines acts as resistances, the green lines acts as supports. If the price breaks the support/resistance, it will move to the next support/resistance line. White lines indicates previous day high & low, high acts as a resistance & low acts as a support for next day.
Trendlines are also significant to price action. If the price is above/below the trendlines, can expect an UP/DOWN with aggressive move.
Please NOTE: this levels are for intraday trading only.
Disclaimer - All information on this page is for educational purposes only,
we are not SEBI Registered, Please consult a SEBI registered financial advisor for your financial matters before investing And taking any decision. We are not responsible for any profit/loss you made.
Request your support and engagement by liking and commenting & follow to provide encouragement
HAPPY TRADING 👍

NIFTY INTRADAY LEVELS FOR 23/10/2023BUY ABOVE - 19590
SL - 19560
TARGETS - 19640,19680,19720
SELL BELOW - 19530
SL - 19560
TARGETS - 19490,19450,19420
NO TRADE ZONE - 19530 to 19590
Previous Day High - 19590
Previous Day Low - 19512
I am sharing NIFTY levels this levels acts as important support & resistance for intraday. if you want to trade with this levels wait for 15 min Candle closing above that levels. You can trade with breakout and reversal both.
In this channel, I share my expertise in trading strategies, technical analysis, and market trends to help you make informed decisions in your trading ventures.
Stay tuned for daily updates, in-depth market analyses, and real-time trading scenarios to witness firsthand how we transform from Zero to Hero in the trading world. My Only aim is to empower you with the knowledge and skills necessary to navigate the complexities of the financial markets successfully.
Based on price action major support & resistance's are here, the red lines acts as resistances, the green lines acts as supports. If the price breaks the support/resistance, it will move to the next support/resistance line. White lines indicates previous day high & low, high acts as a resistance & low acts as a support for next day.
Please NOTE: this levels are for intraday trading only.
Disclaimer - All information on this page is for educational purposes only,
we are not SEBI Registered, Please consult a SEBI registered financial advisor for your financial matters before investing And taking any decision. We are not responsible for any profit/loss you made.
Request your support and engagement by liking and commenting & follow to provide encouragement
HAPPY TRADING 👍

BANK NIFTY INTRADAY LEVELS FOR 20/10/2023BUY ABOVE- 43970
SL - 43850
TARGETS - 44060,44210,44350
SELL BELOW - 43730
SL - 43850
TARGETS - 43600,43450,43350
NO TRADE ZONE - 43730 to 43970
Previous Day High - 44060
Previous Day Low - 43560
I am sharing BANK NIFTY levels this levels acts as important support & resistance for intraday. if you want to trade with this levels wait for 15 min Candle closing above that levels. You can trade with breakout and reversal both.
In this channel, I share my expertise in trading strategies, technical analysis, and market trends to help you make informed decisions in your trading ventures.
Stay tuned for daily updates, in-depth market analyses, and real-time trading scenarios to witness firsthand how we transform from Zero to Hero in the trading world. My Only aim is to empower you with the knowledge and skills necessary to navigate the complexities of the financial markets successfully.
Based on price action major support & resistance's are here, the red lines acts as resistances, the green lines acts as supports. If the price breaks the support/resistance, it will move to the next support/resistance line. White lines indicates previous day high & low, high acts as a resistance & low acts as a support for next day.
Trendlines are also significant to price action. If the price is above/below the trendlines, can expect an UP/DOWN with aggressive move.
Please NOTE: this levels are for intraday trading only.
Disclaimer - All information on this page is for educational purposes only,
we are not SEBI Registered, Please consult a SEBI registered financial advisor for your financial matters before investing And taking any decision. We are not responsible for any profit/loss you made.
Request your support and engagement by liking and commenting & follow to provide encouragement
HAPPY TRADING 👍

NIFTY INTRADAY LEVELS FOR 20/10/2023BUY ABOVE - 19680
SL - 19640
TARGETS - 19720,19750,19780
SELL BELOW - 19600
SL - 19640
TARGETS - 19540,19500,19450
NO TRADE ZONE - 19600 to 19680
Previous Day High - 19680
Previous Day Low - 19510
I am sharing NIFTY levels this levels acts as important support & resistance for intraday. if you want to trade with this levels wait for 15 min Candle closing above that levels. You can trade with breakout and reversal both.
In this channel, I share my expertise in trading strategies, technical analysis, and market trends to help you make informed decisions in your trading ventures.
Stay tuned for daily updates, in-depth market analyses, and real-time trading scenarios to witness firsthand how we transform from Zero to Hero in the trading world. My Only aim is to empower you with the knowledge and skills necessary to navigate the complexities of the financial markets successfully.
Based on price action major support & resistance's are here, the red lines acts as resistances, the green lines acts as supports. If the price breaks the support/resistance, it will move to the next support/resistance line. White lines indicates previous day high & low, high acts as a resistance & low acts as a support for next day.
Please NOTE: this levels are for intraday trading only.
Disclaimer - All information on this page is for educational purposes only,
we are not SEBI Registered, Please consult a SEBI registered financial advisor for your financial matters before investing And taking any decision. We are not responsible for any profit/loss you made.
Request your support and engagement by liking and commenting & follow to provide encouragement
HAPPY TRADING 👍

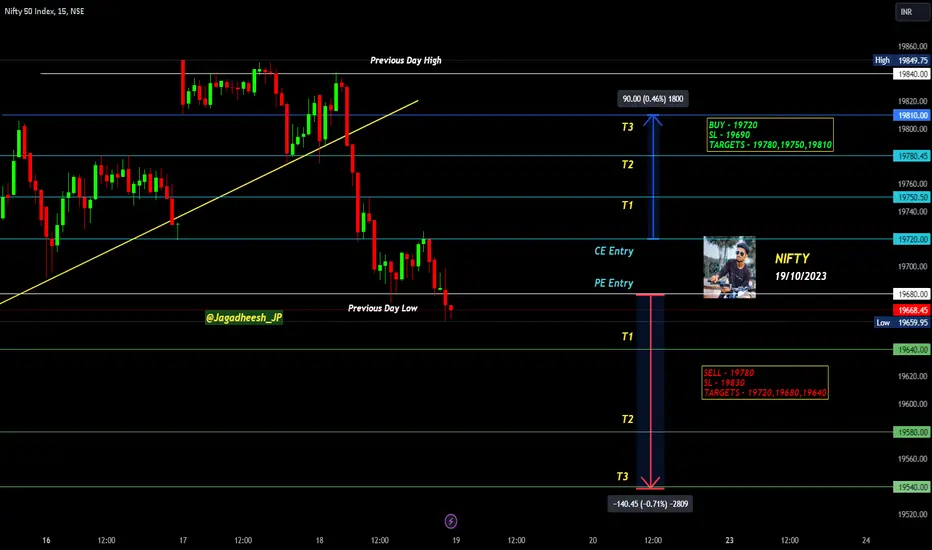
NIFTY INTRADAY LEVELS FOR 19/10/2023BUY - 19720
SL - 19690
TARGETS - 19780,19750,19810
SELL - 19780
SL - 19830
TARGETS - 19720,19680,19640
NO TRADE ZONE - 19680 to 19720
Previous Day High - 19840
Previous Day Low - 19660
I am sharing NIFTY levels this levels acts as important support & resistance for intraday. if you want to trade with this levels wait for 15 min Candle closing above that levels. You can trade with breakout and reversal both.
In this channel, I share my expertise in trading strategies, technical analysis, and market trends to help you make informed decisions in your trading ventures.
Stay tuned for daily updates, in-depth market analyses, and real-time trading scenarios to witness firsthand how we transform from Zero to Hero in the trading world. My Only aim is to empower you with the knowledge and skills necessary to navigate the complexities of the financial markets successfully.
Based on price action major support & resistance's are here, the red lines acts as resistances, the green lines acts as supports. If the price breaks the support/resistance, it will move to the next support/resistance line. White lines indicates previous day high & low, high acts as a resistance & low acts as a support for next day.
Please NOTE: this levels are for intraday trading only.
Disclaimer - All information on this page is for educational purposes only,
we are not SEBI Registered, Please consult a SEBI registered financial advisor for your financial matters before investing And taking any decision. We are not responsible for any profit/loss you made.
Request your support and engagement by liking and commenting & follow to provide encouragement
HAPPY TRADING 👍
BANK NIFTY INTRADAY LEVELS FOR 19/10/2023BUY ABOVE - 43970
SL - 43870
TARGETS - 44120,44210,44350
SELL BELOW - 43870
SL - 43970
TARGETS - 43730,43600,43450
NO TRADE ZONE - 43870 to 43970
Previous Day High - 44440
Previous Day Low - 43870
I am sharing BANK NIFTY levels this levels acts as important support & resistance for intraday. if you want to trade with this levels wait for 15 min Candle closing above that levels. You can trade with breakout and reversal both.
In this channel, I share my expertise in trading strategies, technical analysis, and market trends to help you make informed decisions in your trading ventures.
Stay tuned for daily updates, in-depth market analyses, and real-time trading scenarios to witness firsthand how we transform from Zero to Hero in the trading world. My Only aim is to empower you with the knowledge and skills necessary to navigate the complexities of the financial markets successfully.
Based on price action major support & resistance's are here, the red lines acts as resistances, the green lines acts as supports. If the price breaks the support/resistance, it will move to the next support/resistance line. White lines indicates previous day high & low, high acts as a resistance & low acts as a support for next day.
Trendlines are also significant to price action. If the price is above/below the trendlines, can expect an UP/DOWN with aggressive move.
Please NOTE: this levels are for intraday trading only.
Disclaimer - All information on this page is for educational purposes only,
we are not SEBI Registered, Please consult a SEBI registered financial advisor for your financial matters before investing And taking any decision. We are not responsible for any profit/loss you made.
Request your support and engagement by liking and commenting & follow to provide encouragement
HAPPY TRADING 👍

BANK NIFTY INTRADAY LEVELS FOR 18/10/2023BUY ABOVE - 44520
SL - 44550
TARGETS - 44590,44670,44750
SELL BELOW - 44350
SL - 44440
TARGETS - 44210,44120,44040
NO TRADE ZONE - 44350 to 44520
Previous Day High - 44590
Previous Day Low - 44350
I am sharing BANK NIFTY levels this levels acts as important support & resistance for intraday. if you want to trade with this levels wait for 15 min Candle closing above that levels. You can trade with breakout and reversal both.
In this channel, I share my expertise in trading strategies, technical analysis, and market trends to help you make informed decisions in your trading ventures.
Stay tuned for daily updates, in-depth market analyses, and real-time trading scenarios to witness firsthand how we transform from Zero to Hero in the trading world. My Only aim is to empower you with the knowledge and skills necessary to navigate the complexities of the financial markets successfully.
Based on price action major support & resistance's are here, the red lines acts as resistances, the green lines acts as supports. If the price breaks the support/resistance, it will move to the next support/resistance line. White lines indicates previous day high & low, high acts as a resistance & low acts as a support for next day.
Trendlines are also significant to price action. If the price is above/below the trendlines, can expect an UP/DOWN with aggressive move.
Please NOTE: this levels are for intraday trading only.
Disclaimer - All information on this page is for educational purposes only,
we are not SEBI Registered, Please consult a SEBI registered financial advisor for your financial matters before investing And taking any decision. We are not responsible for any profit/loss you made.
Request your support and engagement by liking and commenting & follow to provide encouragement
HAPPY TRADING 👍

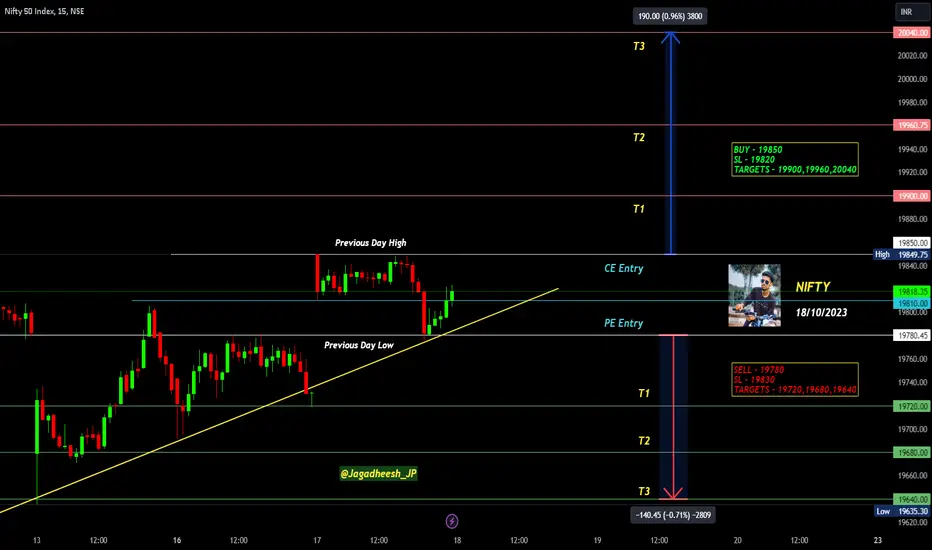
NIFTY INTRADAY LEVELS FOR 18/10/2023BUY ABOVE - 19850
SL - 19820
TARGETS - 19900,19960,20040
SELL BELOW - 19780
SL - 19830
TARGETS - 19720,19680,19640
NO TRADE ZONE - 19780 to 19850
Previous Day High - 19850
Previous Day Low - 19780
I am sharing NIFTY levels this levels acts as important support & resistance for intraday. if you want to trade with this levels wait for 15 min Candle closing above that levels. You can trade with breakout and reversal both.
In this channel, I share my expertise in trading strategies, technical analysis, and market trends to help you make informed decisions in your trading ventures.
Stay tuned for daily updates, in-depth market analyses, and real-time trading scenarios to witness firsthand how we transform from Zero to Hero in the trading world. My Only aim is to empower you with the knowledge and skills necessary to navigate the complexities of the financial markets successfully.
Based on price action major support & resistance's are here, the red lines acts as resistances, the green lines acts as supports. If the price breaks the support/resistance, it will move to the next support/resistance line. White lines indicates previous day high & low, high acts as a resistance & low acts as a support for next day.
Please NOTE: this levels are for intraday trading only.
Disclaimer - All information on this page is for educational purposes only,
we are not SEBI Registered, Please consult a SEBI registered financial advisor for your financial matters before investing And taking any decision. We are not responsible for any profit/loss you made.
Request your support and engagement by liking and commenting & follow to provide encouragement
HAPPY TRADING 👍
#AWL LONG TRADE IDEA SETUPGreetings Folks,
today i have prepared a setup of AWL on NSE
the analysis is as follows-
- the price is in downtrend from some time
- the price is consolidating in a triangle pattern right now
- can breakout both sides, but i am hoping more upper side
- have also marked 2 support zones in case it breaks down
dont play with fire, always use a predefined stoploss

Swing Buy Opportunity TVS MOTOR COMPANYRefer the chart for Entry,Target and SL.
NOTE: This trade is only for Equity Swing buy and not to be considered for options trading.
Please do follow Position Sizing and Risk Reward Ratio while planning any trades.
Note: This information is for education purpose only and please do your own research and consult your financial advisor prior to taking any action.
TO CONNECT WITH ME CHECK OUT MY BIO.
If you like this Idea, Please do like my ideas and share it with your friends. check my bio.
Please boost my ideas and send cheers as it acts as a motivation to keep posting my analysis.
Thank you

#GAIL LONG TRADE IDEA SETUPGreetings Folks,
today i have prepared a setup of GAIL on NSE
the analysis is as follows
- the price is making clean market structure
- broke past the previous all time high
- now forming a pattern as shown in chart
- if the price takes support from the trendline, then it will breakout pretty good but if it breaks the trendline down then it may take support from the zone mentioned below
dont play with fire, always use a predefined stoploss

Campus activewear ltd. #india #bse #nseAfter 1 year of consolidation campus activewear stock is ready to fly if eles tomorrow's closing is above 301 we will see a big rally target-390++
#india #bse #nse

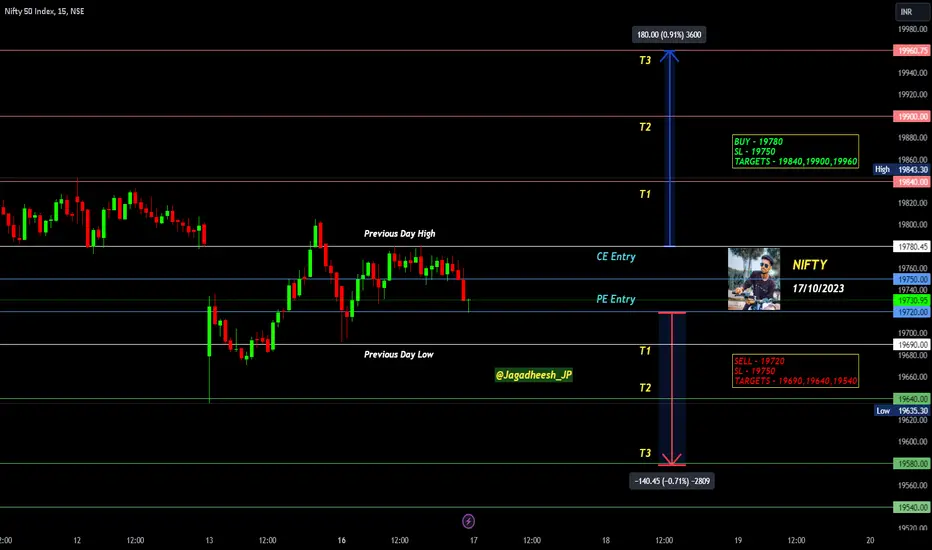
NIFTY INTRADAY LEVELS FOR 17/10/2023BUY ABOVE - 19780
SL - 19750
TARGETS - 19840,19900,19960
SELL BELOW - 19720
SL - 19750
TARGETS - 19690,19640,19540
NO TRADE ZONE - 19720 to 19780
Previous Day High - 19780
Previous Day Low - 19690
I am sharing NIFTY levels this levels acts as important support & resistance for intraday. if you want to trade with this levels wait for 15 min Candle closing above that levels. You can trade with breakout and reversal both.
In this channel, I share my expertise in trading strategies, technical analysis, and market trends to help you make informed decisions in your trading ventures.
Stay tuned for daily updates, in-depth market analyses, and real-time trading scenarios to witness firsthand how we transform from Zero to Hero in the trading world. My Only aim is to empower you with the knowledge and skills necessary to navigate the complexities of the financial markets successfully.
Based on price action major support & resistance's are here, the red lines acts as resistances, the green lines acts as supports. If the price breaks the support/resistance, it will move to the next support/resistance line. White lines indicates previous day high & low, high acts as a resistance & low acts as a support for next day.
Please NOTE: this levels are for intraday trading only.
Disclaimer - All information on this page is for educational purposes only,
we are not SEBI Registered, Please consult a SEBI registered financial advisor for your financial matters before investing And taking any decision. We are not responsible for any profit/loss you made.
Request your support and engagement by liking and commenting & follow to provide encouragement
HAPPY TRADING 👍
BANK NIFTY INTRADAY LEVELS FOR 17/10/2023BUY ABOVE - 44350
SL - 44270
TARGETS - 44430,44550,44670
SELL BELOW - 44210
SL - 44300
TARGETS - 44120,44040,43960
NO TRADE ZONE - 44210 to 44350
Previous Day High - 44350
Previous Day Low - 44040
I am sharing BANK NIFTY levels this levels acts as important support & resistance for intraday. if you want to trade with this levels wait for 15 min Candle closing above that levels. You can trade with breakout and reversal both.
In this channel, I share my expertise in trading strategies, technical analysis, and market trends to help you make informed decisions in your trading ventures.
Stay tuned for daily updates, in-depth market analyses, and real-time trading scenarios to witness firsthand how we transform from Zero to Hero in the trading world. My Only aim is to empower you with the knowledge and skills necessary to navigate the complexities of the financial markets successfully.
Based on price action major support & resistance's are here, the red lines acts as resistances, the green lines acts as supports. If the price breaks the support/resistance, it will move to the next support/resistance line. White lines indicates previous day high & low, high acts as a resistance & low acts as a support for next day.
Trendlines are also significant to price action. If the price is above/below the trendlines, can expect an UP/DOWN with aggressive move.
Please NOTE: this levels are for intraday trading only.
Disclaimer - All information on this page is for educational purposes only,
we are not SEBI Registered, Please consult a SEBI registered financial advisor for your financial matters before investing And taking any decision. We are not responsible for any profit/loss you made.
Request your support and engagement by liking and commenting & follow to provide encouragement
HAPPY TRADING 👍

IIFL FIN Long idea another longer term pick. ive outlined 3 zones where demand can come in , buy at these 3 prices in 3 lots . 575 , 555 and 535 . sl below 495 FOR LONG TERM .

ASIAN GRANITO INDIA | DOWN TREND BREAKOUT PATTERNDOWN TREND BREAKOUT STRATEGY
Entry Price - 80₹
SL - 30₹
Targets - 130,200,300,390+
In this channel, I share my expertise in trading strategies, technical analysis, and market trends to help you make informed decisions in your trading ventures.
Stay tuned for daily updates, in-depth market analyses, and real-time trading scenarios to witness firsthand how we transform from Zero to Hero in the trading world. My Only aim is to empower you with the knowledge and skills necessary to navigate the complexities of the financial markets successfully.
Disclaimer - All information on this page is for educational purposes only,
we are not SEBI Registered, Please consult a SEBI registered financial advisor for your financial matters before investing And taking any decision. We are not responsible for any profit/loss you made.
Request your support and engagement by liking and commenting & follow to provide encouragement
HAPPY TRADING 👍

BANK NIFTY INTRADAY LEVELS FOR 16/10/2023BUY ABOVE - 44340
SL - 44280
TARGETS - 44430,44550,44670
SELL BELOW - 44210
SL - 44300
TARGETS - 44120,44040,43960
NO TRADE ZONE - 44210 to 44340
Previous Day High - 44550
Previous Day Low - 44210
I am sharing BANK NIFTY levels this levels acts as important support & resistance for intraday. if you want to trade with this levels wait for 15 min Candle closing above that levels. You can trade with breakout and reversal both.
In this channel, I share my expertise in trading strategies, technical analysis, and market trends to help you make informed decisions in your trading ventures.
Stay tuned for daily updates, in-depth market analyses, and real-time trading scenarios to witness firsthand how we transform from Zero to Hero in the trading world. My Only aim is to empower you with the knowledge and skills necessary to navigate the complexities of the financial markets successfully.
Based on price action major support & resistance's are here, the red lines acts as resistances, the green lines acts as supports. If the price breaks the support/resistance, it will move to the next support/resistance line. White lines indicates previous day high & low, high acts as a resistance & low acts as a support for next day.
Trendlines are also significant to price action. If the price is above/below the trendlines, can expect an UP/DOWN with aggressive move.
Please NOTE: this levels are for intraday trading only.
Disclaimer - All information on this page is for educational purposes only,
we are not SEBI Registered, Please consult a SEBI registered financial advisor for your financial matters before investing And taking any decision. We are not responsible for any profit/loss you made.
Request your support and engagement by liking and commenting & follow to provide encouragement
HAPPY TRADING 👍

NIFTY INTRADAY LEVELS FOR 16/10/2023BUY ABOVE - 19800
SL - 19770
TARGETS - 19840,19900,19960
SELL BELOW - 19720
SL - 19750
TARGETS - 19680,19640,19540
NO TRADE ZONE - 19720 to 19800
Previous Day High - 19800
Previous Day Low - 19640
I am sharing NIFTY levels this levels acts as important support & resistance for intraday. if you want to trade with this levels wait for 15 min Candle closing above that levels. You can trade with breakout and reversal both.
In this channel, I share my expertise in trading strategies, technical analysis, and market trends to help you make informed decisions in your trading ventures.
Stay tuned for daily updates, in-depth market analyses, and real-time trading scenarios to witness firsthand how we transform from Zero to Hero in the trading world. My Only aim is to empower you with the knowledge and skills necessary to navigate the complexities of the financial markets successfully.
Based on price action major support & resistance's are here, the red lines acts as resistances, the green lines acts as supports. If the price breaks the support/resistance, it will move to the next support/resistance line. White lines indicates previous day high & low, high acts as a resistance & low acts as a support for next day.
Please NOTE: this levels are for intraday trading only.
Disclaimer - All information on this page is for educational purposes only,
we are not SEBI Registered, Please consult a SEBI registered financial advisor for your financial matters before investing And taking any decision. We are not responsible for any profit/loss you made.
Request your support and engagement by liking and commenting & follow to provide encouragement
HAPPY TRADING 👍

GVK POWER & INFRA | BEST PENNY STOCK TO NOWEntry Price - 9₹
SL - 4.5₹
Targets - 20,27,40,53,90+
In this channel, I share my expertise in trading strategies, technical analysis, and market trends to help you make informed decisions in your trading ventures.
Stay tuned for daily updates, in-depth market analyses, and real-time trading scenarios to witness firsthand how we transform from Zero to Hero in the trading world. My Only aim is to empower you with the knowledge and skills necessary to navigate the complexities of the financial markets successfully.
Disclaimer - All information on this page is for educational purposes only,
we are not SEBI Registered, Please consult a SEBI registered financial advisor for your financial matters before investing And taking any decision. We are not responsible for any profit/loss you made.
Request your support and engagement by liking and commenting & follow to provide encouragement
HAPPY TRADING 👍

BHEL's future seems bright!!!The correction seems done!
Now the stock should move alongwith the ema's!
Long in it!

UPL may sink deeper!!!As long as the stock is between ema100 and ema200, it is in danger!
Even if it closes above the ema200, my stance won't be bullish untill it stays above it for a couple of days!
Will look to short near 650!
