NIFTY is Testing its long term Trend Line.I’ve been keeping an eye on the ‘Watch Out’ area and the trend line that’s being tested. I’ve been following this trend line for a while now, and I’m excited to share some potential scenarios that could unfold in July.
Here are a few things to keep in mind:
1. The 25450 - 25550 range could become a key resistance and support area.
2. If NIFTY successfully retests this trend line and shows some upward movement, the next target could be 26000. In this case, I would recommend buying July 26000 Call options.
3. If NIFTY can’t hold this retest (which is less likely given NSE:NIFTY the current bullish market sentiment), our next watchout zone could be 25000 - 24800.
4. We might even be seeing an all-time high NIFTY soon!
Disclaimer: Please do your own research before investing. This is just my personal opinion, and I don’t force anyone to invest based on my ideas.
Nseindia


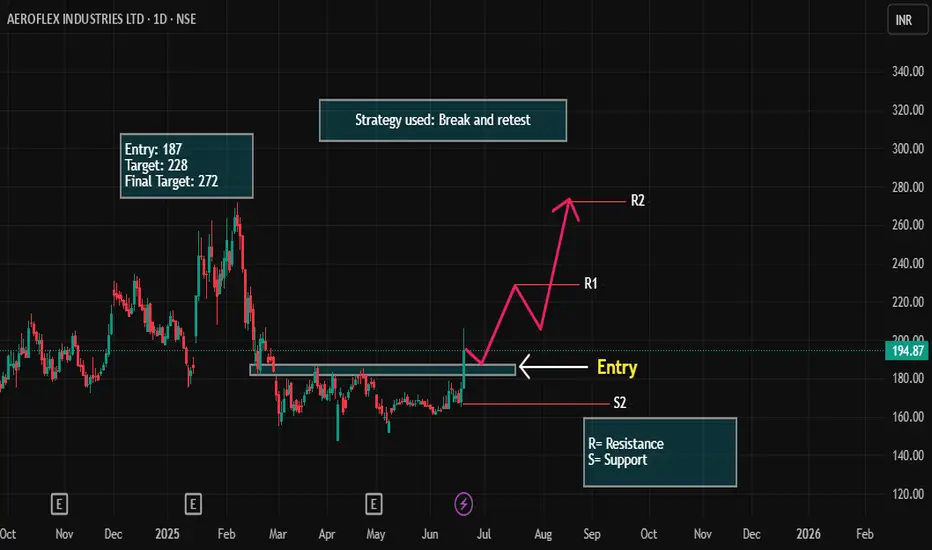
AEROFLEX LONG Setup!Stock: Aerofle (AERF)
Current Market Price (CMP): ₹194
Entry Point: ₹187
Target: ₹228
Final Target: ₹272
Stop Loss (SL): Below Support 2
Trade Setup with Stop Loss:
Entry at ₹187: As mentioned earlier, you plan to enter at ₹187, which is lower than the current market price of ₹194. You're waiting for a pullback to this level, anticipating the stock will rebound from this price and head higher.
Target at ₹228: This is your first price target, where the stock is expected to face resistance. Once the stock hits ₹228, it might experience some pullback or consolidation.
Final Target at ₹272: This is the key level where you're aiming for the stock to reach, assuming the trend continues. ₹272 is your ultimate exit target.
Stop Loss (SL) Below Support 2:
The stop loss is placed below Support 2, which is a lower level of support. By positioning the stop loss here, you're allowing for some price fluctuation, but you’re limiting your downside risk in case the trade doesn’t play out as expected. Support 2 serves as a critical level, and if the price falls below this, it could indicate a reversal or breakdown of the trend.
Why This Setup Works:
Support 2 is your safety net. If the stock breaks below this level, it suggests that the uptrend is invalidating, so exiting with minimal loss is a good risk management strategy.
You're using the break and retest strategy with Support 2 as a critical level to protect against a major downtrend. If the stock holds above ₹187 and moves up to ₹228 and beyond, your risk-to-reward setup is favorable.
KBCGLOBAL Looks bullish!A potential entry is identified at 0.46. The first target is 0.62, representing a +34.78% gain from the entry point. If the upward momentum continues, the long-term target is set at 0.87, offering a total potential gain of +89.13% from the initial entry. This trade presents a strong risk-to-reward profile for both short-term traders and long-term investors. Proper risk management is essential, especially if price action weakens below the entry level.

Trade setup HINDZINCHINDZINC Is approaching a key support level at 440. This level is critical for determining the stock's next move. A breakdown below 440 could signal increased bearish momentum, potentially leading to further downside. On the other hand, if the 440 level holds strong and shows signs of support, it could mark the beginning of a bullish reversal. In that case, there's a significant upside potential, with a possible long-term target around 655. For now, it's important to stay patient and wait for a clear signal—either a breakdown or a bounce from the current level—before making any trading decisions.

Complete trade setup! Kindly follow all key levels and resistance marked on the chart. Be patient — waiting is the key in trading.
STLTECHYeah, the stock’s looking bullish, but don’t jump into a moving train. Let it cool down a bit—around ₹95 looks like a solid entry. That’s when we hop on and ride the move safely.

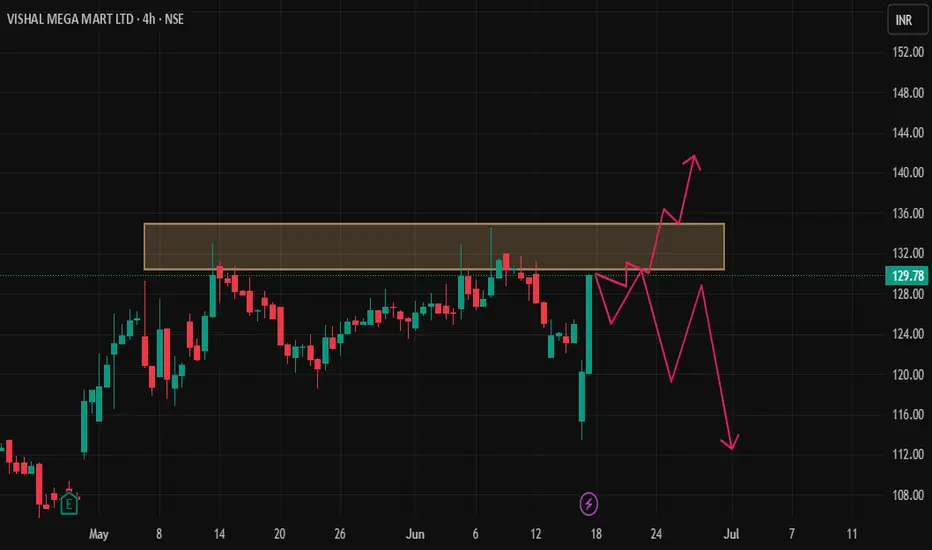
VMM Trade planFor VMM, the market is currently at a crucial zone. There are two possible scenarios: either we break the high key level and continue the bullish momentum, or we drop below the current support, triggering a bearish move. At this point, there’s no clear trade setup. We’ll wait for confirmation in either direction before taking any position to minimize risk and ensure better entry.
IDIA Range Accumulation – Bullish Only With Fundamental TriggerThe stock is currently trading inside a tight range, indicating a phase of consolidation.
📉 Buy Zone: ₹6.38
I’m planning to accumulate if price drops near this zone. From a technical view, it’s a strong demand area. However, for the bullish breakout to sustain, we’ll need strong fundamental support — like earnings, news, or sector momentum.
🔍 If fundamentals align, this could become a long-term multibagger setup.
✅ Strategy:
Wait for ₹6.38 zone
Accumulate small quantities
Hold for long-term with regular news tracking
💬 What do you think?
Would you wait for breakout or buy inside the range?
#TechnicalAnalysis #SwingTrade #LongTermView #SupportZone #BreakoutSetup #StockMarketIndia

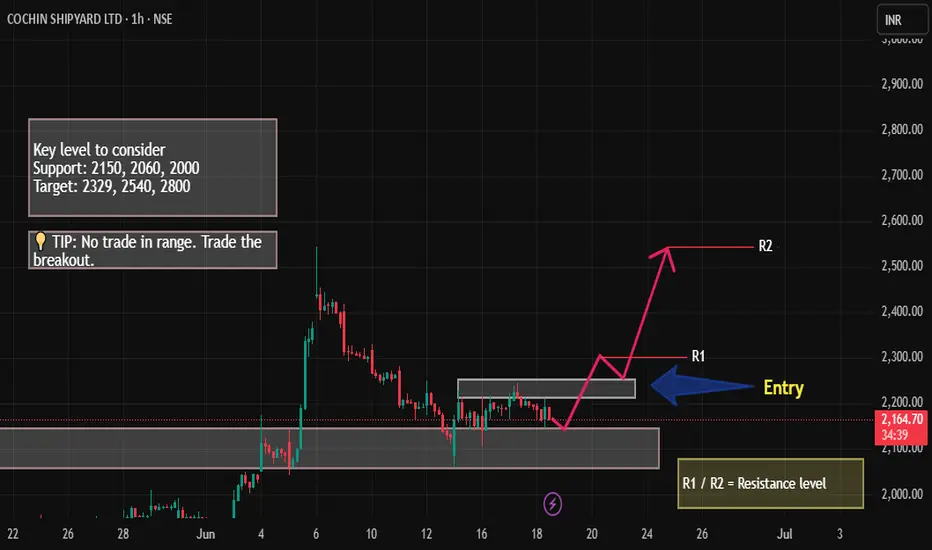
Cochin Shipyard – Key Level Retracement & Long SetupCochin Shipyard is perfectly retracing to a key support zone, showing strength for a possible bounce.
🔹 Entry: ₹2149
🎯 Target 1: ₹2543
📈 Potential Gain: ~18.3%
🕒 Plan: Holding position unless structure shifts
This setup aligns with the current trend — looking for a continuation after healthy retracement. Tight stop-loss recommended for capital protection.
💬 What's your view on this trade?

HDFC Accumulation Breakdown Setup?HDFC seems to be building an accumulation range with:
Range High: ₹1955
Range Low: ₹1908
Currently, price is consolidating within this zone. I'm biased to the sell side for now, expecting a potential breakdown below the ₹1908 level.
⚠️ No confirmation yet — it's a “wait and watch” scenario. A strong close below the range low could trigger momentum selling.
💬 What's your view on this setup?

CHAMBAL FERTILIZERS FOR SWING TRADECHAMBAL FERTILIZERS a good opportunity for swing trade plan, entry and exit point mention, add your watchlist and observe.
This is for Education purpose only...

Trent Ltd: Breakout or Fakeout?Trent Ltd: Breakout or Fakeout? Someone’s positioning — the question is which side.
Trent Ltd remains one of the more resilient players in India’s retail landscape. While broader consumer sentiment remains mixed, the company continues expanding its footprint, especially through its Westside stores and fashion vertical. Recent earnings have been stable, and institutional interest appears to be creeping back in — confirmed by a steady rise in volume.
Technically, we’re at a decision point. Price is testing a major descending trendline drawn from the all-time highs. So far, no breakout — but signs of accumulation are building. All major EMAs (50/100/200) are below the price, putting buyers firmly in control. Volume is rising on bullish candles, with no signs of distribution. RSI is holding above 50, climbing steadily, and showing a healthy impulse without overheating — plenty of room left for upside.
The key setup: wait for a confirmed breakout above the trendline, then a retest, and only after that consider entering. Targets, based on Fibonacci levels, line up cleanly:
tp1: 6337.60 (0.618)
tp2: 7484.65 (1.0)
tp3: 8301.40 (1.272)
Until then — this is a watching game, not a trading one. Momentum is building, the structure is clean — but confirmation is king.


Equity Research Flash – Hexaware Technologies Ltd.CMP: ₹722.35 | Bullish Momentum Post Trend Reversal
HEXT shows a bullish breakout from a falling trendline, with RSI near 60 and strong volume uptick. The price reclaimed the 0.5 Fibonacci level, eyeing next targets at ₹749.85 (0.618) and ₹793.35 (0.786). Fundamentally strong with robust revenue growth, improving ROCE (26.4%), and low debt. A move above ₹750 could trigger further upside. Accumulate on dips with SL at ₹688.
Recommendation: Positive | Buy on Dips Near ₹700
For Education Purpose only

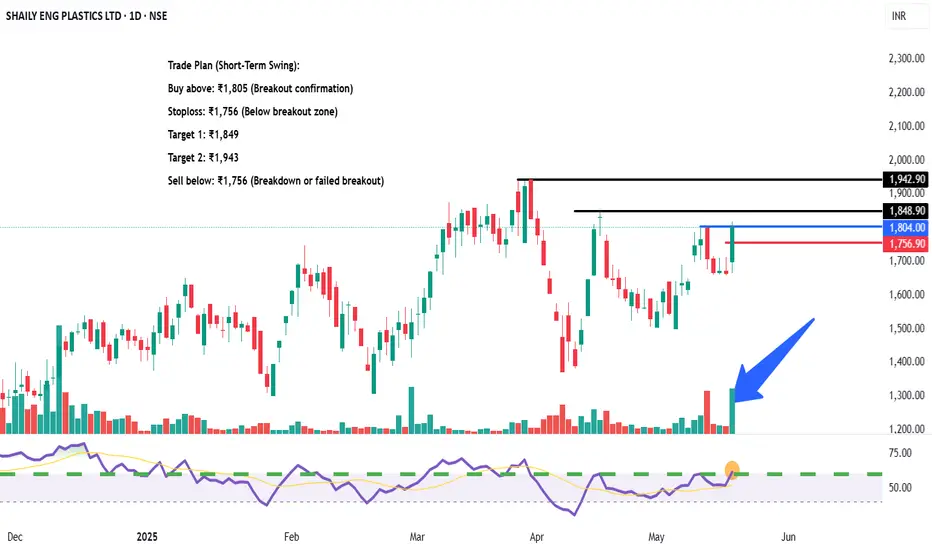
SHAILY ENG PLASTICS LTD – Breakout Watch | High Volume Spike📌 Trade Plan (Short-Term Swing):
Buy above: ₹1,805 (Breakout confirmation)
Stoploss: ₹1,756 (Below breakout zone)
Target 1: ₹1,849
Target 2: ₹1,943
Sell below: ₹1,756 (Breakdown or failed breakout)
🔍 Technical View:
Volume spike with bullish close – institutional interest likely
Breakout zone near ₹1,804 now acting as immediate support
RSI breakout supports momentum entry
Resistance: ₹1,849 and ₹1,943
SYMPHONY LTD CMP -1280 for 700%%Buy Long term 3-5 Years
Symphony Ltd
Cmp - 1277
Target 11000..
** This Post is for educational purpose Only, Please concern your financial advisor before investing in market related investment**

Nifty weekly Walkthrough and Outlook for next week
Expecting a push down on Nifty towards the daily OB and then a massive displacement towards the upside. The draw remains the same. I want all the buyside of 5th December before another meltdown and second stage distribution on the monthly

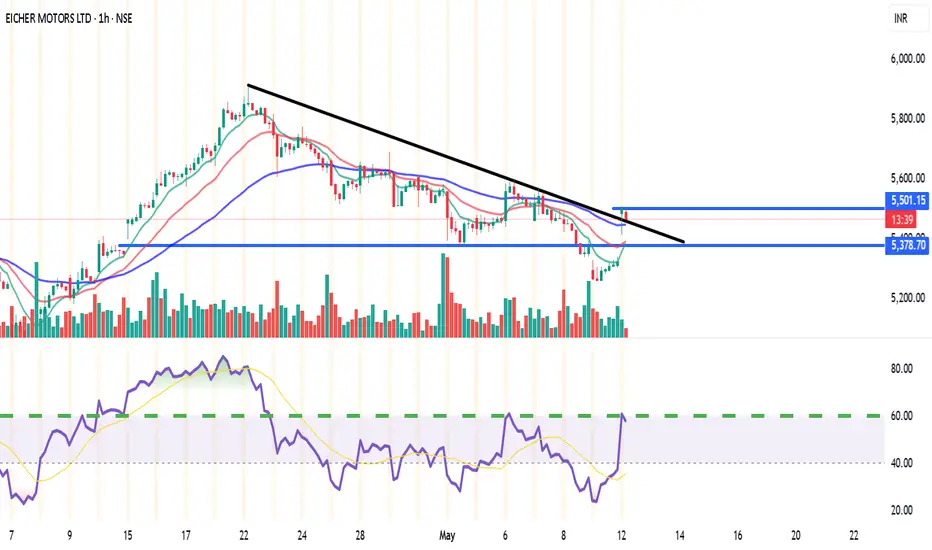
EICHERMOT (NSE) – Bullish Setup on 15min & 1H🔑 Trade Plan:
📥 Buy Above: ₹5485 (above current resistance & candle body highs)
🎯 Targets:
T1: ₹5527 (Pivot R1)
T2: ₹5555
🛡️ Stop Loss: ₹5380 (below 13 EMA & Supertrend support)
📊 Technical Signals:
RSI: 58.08 – Bullish momentum, still room to run
%B (BB): 0.77 – Close to breakout from upper band
EMA Crossover: 9 EMA > 13 EMA – Short-term bullish crossover confirmed
Supertrend: Support at ₹5322, aligning with bullish reversal
Volume: Spike during recent green candles signals strong buying interest
⚙️ Strategy Notes:
Use 15min chart for entry timing post breakout
Tighten SL to cost after T1 hits
Ideal for short-term intraday/swing traders
For Education Purposes Only
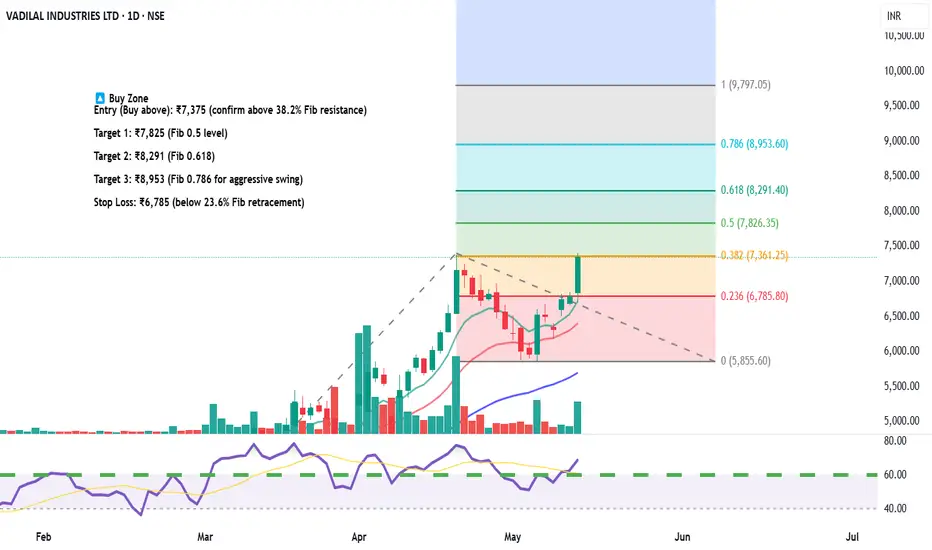
Vadilal Industries – Equity Trade Setup & Research View🟢 Long Trade Setup (Bullish Reversal Play)
Current Price: ₹7,346.50
Fibonacci Level Tested: 38.2% at ₹7,361 — a crucial breakout level
Trendline Breakout: Price has broken above falling trendline with volume confirmation
RSI: Near 60 – bullish momentum building
🔼 Buy Zone
Entry (Buy above): ₹7,375 (confirm above 38.2% Fib resistance)
Target 1: ₹7,825 (Fib 0.5 level)
Target 2: ₹8,291 (Fib 0.618)
Target 3: ₹8,953 (Fib 0.786 for aggressive swing)
Stop Loss: ₹6,785 (below 23.6% Fib retracement)
🔻 Short Trade Setup (if rejection happens)
Sell Below: ₹7,200
Target: ₹6,785
Stoploss: ₹7,375
📅 Timeframe: Daily (1D)
📊 Risk/Reward Ratio: 1:2.5+
🔁 Valid for: Next 2–4 weeks
For Education Purposes Only
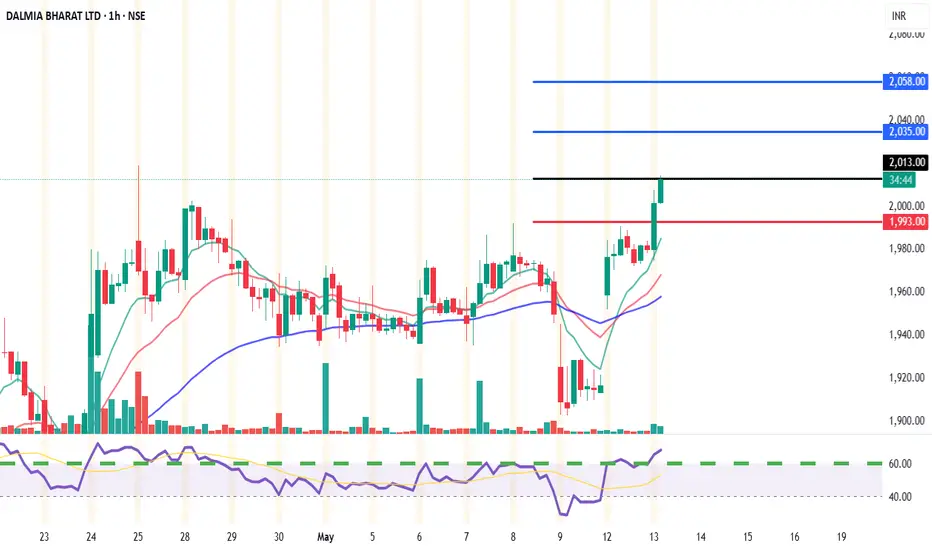
Trade Setup: DALMIA BHARAT (NSE)📊 Chart Summary:
Current Price: ₹2,009
EMA Support: 9 EMA (₹2,003.57) | 26 EMA (₹1,993.31)
Volume: Increasing with bullish candles
Price Action: Sustaining above key pivot and EMA levels
Momentum: Strong with minor consolidation
✅ Intraday Buy Setup (15min & 1h)
Buy Above: ₹2,013.50 (Break of intraday resistance zone)
Targets:
🎯 Target 1: ₹2,035.80 (Pivot R2)
🎯 Target 2: ₹2,058.30 (Pivot R3)
Stop Loss: ₹1,993 (below 26 EMA and pivot zone)
Risk:Reward: ~1:2 or better
For Education Purposes Only
Gabriel India Ltd (GABRIEL) – Weekly Resistance Breakout Setup✅ Trade Idea:
Price has reclaimed the 0.618 retracement at ₹608.25
Breakout above the ₹612 horizontal level (weekly closing basis)
Volume is rising and RSI shows strong uptrend
💰 Buy Zone:
Entry: ₹610 – ₹613
(preferably above ₹612 on strong 15min or 1H candle close)
🎯 Targets:
T1: ₹630 (previous minor supply zone)
T2: ₹646.65 (Fib 0.786 level)
T3: ₹695.55 (Fib 1.0 extension)
T4: ₹836.85 (1.618 extension for swing positional)
🛑 Stop Loss:
Intraday SL: ₹598 (below 9 EMA on 1H)
Swing SL: ₹581 (Fib 0.5 retracement support)
🔁 Strategy:
Wait for confirmation via volume + RSI > 60
Trail SL to ₹610 once ₹630 is hit
Lock partial profit near ₹646 if market sentiment weakens
For Education Purposes Only
