Nseindia


WXY correction After long bear market this stock is making wxy correction with chart pattern in its x wave. 100% projection of wave y is at 18 since it is rising from bottom it can go higher than 100% projection upto 161.8% projection at 24 inside potential green parallel channel.

RSI Bullish Divergence in NSE: TRENT 1D Chart In TRENT, there was a down-trend. Now, down-trend is over and a new trend is getting established.
There is RSI Bullish Divergence in 1D Chart. Stock may come down a bit in short team (like next 1 week).
Overall, if the new trend establishes itself, stock may go up in mid-term.


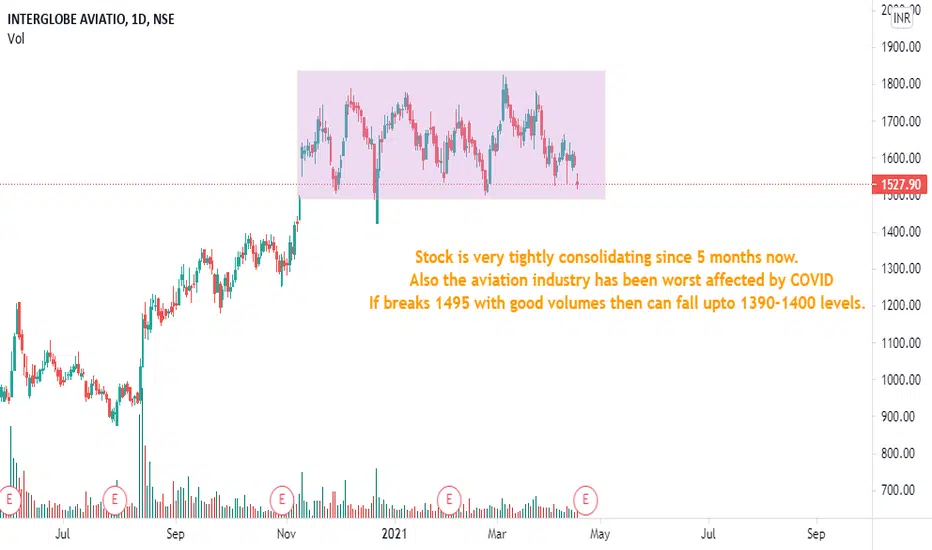
Interglobe Aviation (INDIGO)- Daily Chart.Darvas Box is seen on chart. All levels are mentioned on chart.
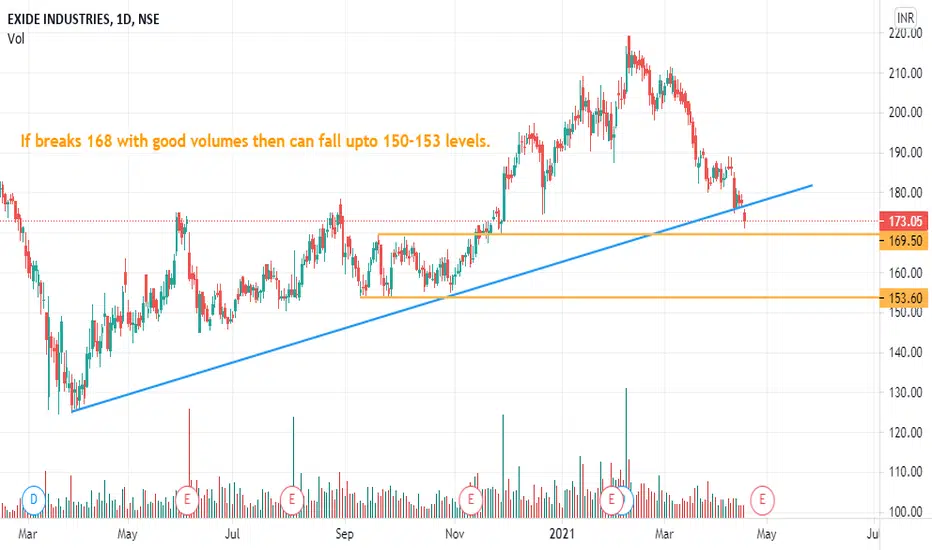
EXIDE INDUSTRIES- Daily ChartStock has been very much under performing recently so keep an eye. All levels are mentioned in the chart.

WIPRO - Wipro LtdLevels -
Buy - 432+
Target - 470
SL - 418
The stock has tended to show a strong up move in the month where earnings are reported. The trend has been consistent over the past year and by looking at the current outset of WFH and COVID-19 second wave, it is most likely to continue. The quarterly and annual results will be announced on April 15, 2021, which might make the stock revisit the levels of 470. In addition to that, post Q3 results the stock has formed a flag pattern on both weekly and daily charts, therefore a breakout cannot be ruled out while an event is planned for the coming week. Once the level of 430 is breached on the upside, which is acting as a resistance, the stock can go up to the levels of 470, an up move of close to 10%.
IT shares in the given circumstances of WFH due to COVID-19 is a safe bet as there has been a significant increase in operating profit of the companies which will continue in coming quarters if the situation stays like this. This can be observed by looking at their quarterly results.
NOTE: These findings and levels are purely based upon the knowledge and understanding of the post publisher. The idea here is to predict the future price movements hence, please do not consider this as stock advice or recommendation.

#Apollo Tubes LONG - High returnsPrice action and trend is solid, daily + weekly! Bought today.
Trade idea inspired from my homie: Akul Bansal
