ONGC Breaks Resistance with Strong VolumeOil & Natural Gas Corporation (ONGC) has broken above key resistance levels with strong volume, confirming a bullish trend. Traders are eyeing a potential target of 320 with a stop loss set at 290. Keep an eye on this stock for potential gains as it continues to show upward momentum.
Nseindia

SWING IDEA - SAFARI IND (INDIA)Consider a compelling swing trade opportunity in Safari Industries , a renowned luggage and travel accessories manufacturer in India.
Reasons are listed below :
Flag and Pole Pattern : Safari Industries displays a flag and pole pattern, indicating a potential continuation of the prior uptrend.
Bullish Marubozu Candle in Weekly Timeframe : The presence of a bullish Marubozu candlestick pattern on the weekly timeframe suggests strong buying momentum and potential upward movement.
50 EMA Support : The stock finds support at the 50 Exponential Moving Average (EMA), reinforcing the bullish bias and indicating potential for upward momentum.
0.382 Fibonacci Support : Safari Industries receives support at the 0.382 Fibonacci level, providing a solid foundation for potential upward movement.
Support at 1700 Level : The stock finds support at the 1700 level, indicating a strong buying interest and potential for a bullish reversal.
Higher Highs : Safari Industries consistently forms higher highs, reflecting a trend of increasing bullish momentum and reinforcing the potential for further gains.
Target - 2320 // 2730
Stoploss - weekly close below 1700
DISCLAIMER -
Decisions to buy, sell, hold or trade in securities, commodities and other investments involve risk and are best made based on the advice of qualified financial professionals. Any trading in securities or other investments involves a risk of substantial losses. The practice of "Day Trading" involves particularly high risks and can cause you to lose substantial sums of money. Before undertaking any trading program, you should consult a qualified financial professional. Please consider carefully whether such trading is suitable for you in light of your financial condition and ability to bear financial risks. Under no circumstances shall we be liable for any loss or damage you or anyone else incurs as a result of any trading or investment activity that you or anyone else engages in based on any information or material you receive through TradingView or our services.
@visionary.growth.insights

SWING IDEA - RALLIS INDIARallis India , a leading player in the agrochemical sector renowned for its innovative solutions and commitment to sustainable agriculture, showcases promising potential for swing trading amidst favorable technical indicators.
Reasons are listed below :
After multiple tests in the 270-290 zone, Rallis India has finally breached the resistance, signaling a significant shift in market sentiment.
A robust bullish candle close on the weekly timeframe, accompanied by massive volumes, underscores strong buying interest and potential for sustained upward momentum.
The price found support at the 0.382 Fibonacci level, adding weight to the bullish thesis and reinforcing the likelihood of continued upward movement.
Breaking free from a consolidation phase lasting over 2.5 years, Rallis India demonstrates potential for a new bullish trend trajectory.
Trading above both the 50 and 200 exponential moving averages (EMA) on the weekly timeframe, with the 50 EMA crossing over the 200 EMA, further bolsters the bullish outlook, suggesting strengthening upward momentum.
Target - 325 // 353 // 392
StopLoss - weekly close below 245
DISCLAIMER -
Decisions to buy, sell, hold or trade in securities, commodities and other investments involve risk and are best made based on the advice of qualified financial professionals. Any trading in securities or other investments involves a risk of substantial losses. The practice of "Day Trading" involves particularly high risks and can cause you to lose substantial sums of money. Before undertaking any trading program, you should consult a qualified financial professional. Please consider carefully whether such trading is suitable for you in light of your financial condition and ability to bear financial risks. Under no circumstances shall we be liable for any loss or damage you or anyone else incurs as a result of any trading or investment activity that you or anyone else engages in based on any information or material you receive through TradingView or our services.
@visionary.growth.insights

NSEI:TIMETECHNO - Short term uptrend or big trend???👇NSE:TIMETECHNO
Time Technoplast Limited, together with its subsidiaries, engages in manufacture and sale of a range of technology-based polymer and composite products in India and internationally. It operates in two segments, Polymer and Composite. The company offers industrial packaging products, including drums and containers, such as narrow mouth polycans/drums, open top drums, XL-rings, medium packing products, and classic open top drums; conipails; and intermediate bulk containers, as well as value added services.
It also provides lifestyle products comprising matting products; bins; and molded furniture, such as sofas, five position reclining chairs, monoblocs, executive and baby chairs, chairs with writing desk, tables, trolleys, and stools for use in homes, hotels, restaurants, hospitals, clubs, airlines, auditoriums and tent houses, and various other institutes; and automotive components, such as 3S rain flaps, deaeration tanks/radiator tanks, fuel tanks, and air ducts. In addition, the company offers material handling products consisting of plastic returnable transit packaging and material handling solutions, crates, flat plates, eco plates, and smart leaf plates, and export pallets to retail, automotive, agriculture, processed food, apparel, pharmaceutical, FMCG, consumer durables, and logistics sectors. Further, it provides composite cylinders; and infrastructure products, including HDPE and DWC pipes, and energy storage devices, as well as techpaulin bags, raincoats, bike covers, and cross laminated films; and kavach face shield. The company was incorporated in 1989 and is based in Mumbai, India.
disc: Invested

ICICI Prudential: Breakout on Strong VolumeICICI Prudential has successfully broken through a key resistance level with strong volume, indicating potential for further upward movement. The stock shows significant bullish momentum, supported by high trading volume, confirming the reliability of this breakout. Traders should watch for continued strength in the coming sessions. Proper risk management is essential, with attention to support levels below the breakout.

SWING IDEA - V GUARD INDUSTRIESThe technical analysis of V-Guard Industries suggests a compelling swing buying opportunity.
The reasons are listed below :
The stock has successfully breached a significant resistance zone at 270-280, showcasing potential for an upward trend continuation.
The presence of a robust bullish engulfing candle on the weekly timeframe, coupled with the stock finding support at the 50 EMA, enhances the bullish outlook.
Following a prolonged consolidation period exceeding six years, the stock is poised for a potential breakout, indicating the likelihood of substantial price movement.
The formation of higher highs further reinforces the bullish sentiment and suggests an established uptrend.
A notable increase in trading volumes during the breakout phase supports the authenticity of the upward movement.
Target - 360 // 424
Stoploss - weekly close below 282
DISCLAIMER -
Decisions to buy, sell, hold or trade in securities, commodities and other investments involve risk and are best made based on the advice of qualified financial professionals. Any trading in securities or other investments involves a risk of substantial losses. The practice of "Day Trading" involves particularly high risks and can cause you to lose substantial sums of money. Before undertaking any trading program, you should consult a qualified financial professional. Please consider carefully whether such trading is suitable for you in light of your financial condition and ability to bear financial risks. Under no circumstances shall we be liable for any loss or damage you or anyone else incurs as a result of any trading or investment activity that you or anyone else engages in based on any information or material you receive through TradingView or our services.
@visionary.growth.insights

Paras Defence And Space Tech LONG TERM VIEWParas Defence is forming a Symmetrical Triangle On Weekly Timeframe. The Entry and Stoploss would be considered on Candle Closing Basis.
Entry - Above 800
Stoploss- Below 576
Targets - 1001,1260,1550 and 1760 (These Targets would be achieved in 2.5 years max from the date of entry).
NOTE :- This View is purely based on Technical Analysis and is for educational purposes only. Please consult your financial advisor before taking any trade.

TATACONSUM Weekly Chart Analysis: Bullish caseTATACONSUM Weekly Chart Analysis: Bullish case
1.Breakout from Bullish falling wedge
2. Long signal on Parabolic SAR
3. MACD about to cross up
4. Price staying above 9/21 EMA

APOLLOHOSP Weekly Chart Analysis: Bullish caseAPOLLOHOSP Weekly Chart Analysis: Bullish case
1. 9/21 EMA cross on weekly timeframe
2. Parabolic SAR showing Long signal.
3. MACD about to cross up.
4. Breakout from Bullish falling wedge pattern.

KOTAKBANK Weekly Chart Analysis: Bullish caseKOTAKBANK Weekly Chart Analysis: Bullish case
1.9/21 EMA cross on weekly timeframe(bullish)
2.Price above 200EMA(Bullish)
3.MACD Signal line above zero line(Bullish)
4.Parabolic SAR(parabolic stop and reverse) also showing reversal and Long signal.

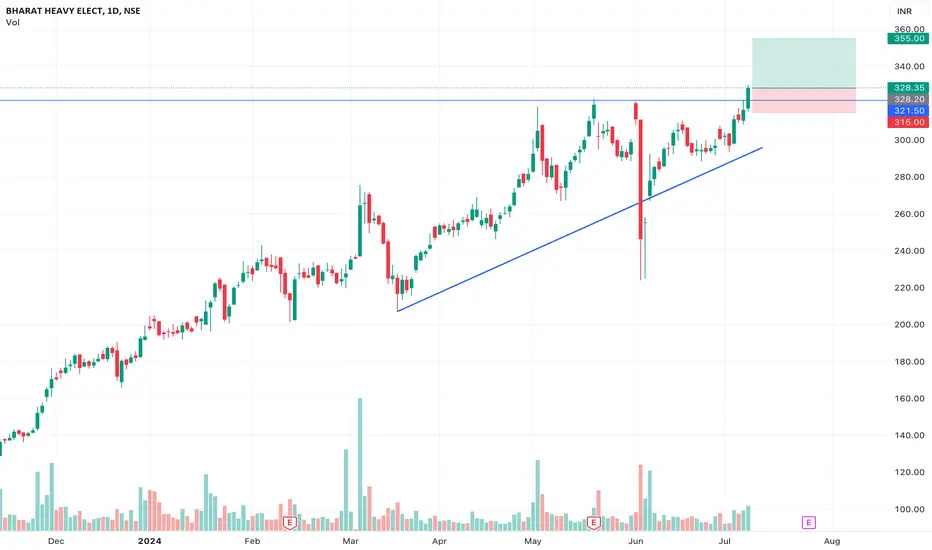
BHEL Breaks Resistance with Ascending Trend LineBharat Heavy Electricals Limited (BHEL) has broken out of resistance with strong volume, confirming a bullish momentum. The stock is following an ascending trend line. Traders should watch for a target price of 355 with a stop loss set at 315. Keep an eye on this stock for potential gains.
FMCG SECTOR: ITCrefer chart for details. can give excellent returns. the consumer sector going to provide good returns. can watch Sept or Aug call options.

Cummins India: Breakout Above Resistance Fuels Bullish ContinuatCummins India has followed a dynamic path, initially riding an ascending trend line, entering a phase of consolidation, and now breaking above key resistance to continue its upward trajectory. This breakout is a significant bullish signal, indicating strong buyer interest and potential for further gains. Traders should monitor for stability above this new resistance-turned-support level, which could pave the way for continued bullish momentum.

SWING IDEA - VARROC ENGINEERING Varroc Engineering presents a compelling case for a potential swing trade, backed by several key indicators.
Reasons are listed below :
After multiple tests, Varroc Engineering broke through the crucial 500 level and is now retesting it, indicating a potential shift in market sentiment.
A doji candlestick formation on the weekly timeframe and a bullish marubozu candle on the daily timeframe suggest indecision followed by strong bullish momentum, respectively.
Varroc Engineering demonstrates a clear uptrend, marked by a series of constant higher highs, indicating bullish momentum in the stock.
Finding support at the 0.382 Fibonacci retracement level suggests a healthy correction within the broader uptrend, providing a favorable entry point for traders.
The stock price is currently trading above both the 50 and 200 Exponential Moving Averages (EMA) on the weekly timeframe, reinforcing the bullish bias.
Varroc Engineering has recently broken out of a consolidation phase lasting over four years, signaling a potential continuation of the uptrend.
Target - 620 // 655 // 830
StopLoss - weekly close below 455
DISCLAIMER -
Decisions to buy, sell, hold or trade in securities, commodities and other investments involve risk and are best made based on the advice of qualified financial professionals. Any trading in securities or other investments involves a risk of substantial losses. The practice of "Day Trading" involves particularly high risks and can cause you to lose substantial sums of money. Before undertaking any trading program, you should consult a qualified financial professional. Please consider carefully whether such trading is suitable for you in light of your financial condition and ability to bear financial risks. Under no circumstances shall we be liable for any loss or damage you or anyone else incurs as a result of any trading or investment activity that you or anyone else engages in based on any information or material you receive through TradingView or our services.
@visionary.growth.insights

SOLARA ACTIVE PHARMA LONG TERM VIEWSolara Active Pharma is forming a rounding bottom formation or W pattern on Monthly TimeFrame.
The Entry and Stoploss would be considered on Candle Closing Basis.
Entry - Above 470
Stoploss - Below 273
Target - 1509
( This Target would be achieved in 2 years max from the date of entry).
NOTE:- This view is purely based on Technical Analysis and is for educational purposes only. Please consult your financial advisor before taking any trade

Hinduni bullish for 27/06/2024Hi fellow traders,
Check out this Hindustan Unilever chart. It has taken its sweet time to retrace making a slingshot pattern (Don't know official name). I am bullish on this chart for intraday as well as for a week where my entry point will be 2450 and SL will be 2420. So, for intraday my profit is 2500. And for weekly trading it is 2700.
Let me know what you feel. You too will be updated about my thoughts throughout tomorrow's trading session.
Disclaimer : This is my analysis and I does not responsibility of any profit or loss executing this suggestion. Even though I will be taking the same trade tomorrow, do your own analysis.
Stay tuned for such daily chart analysis.

JSW STEEL Short term view.JSW STEEL is sustaing above is important resistance
indicating bullishness for short-term. Possible targets are 950,965,975,980.

SWING IDEA - MAPMYINDIA (C.E. INFO SYSTEMS)MapmyIndia (CE Info Systems) presents a compelling prospect for swing traders. Combining innovative technology with mapping solutions, MapmyIndia has established itself as a leader in the navigation and location-based services industry.
Reasons are listed below :
The 1600-1700 range, once a challenging barrier, has now transformed into a strong support level.
A Dragonfly Doji on the weekly timeframe hints at a possible reversal, underlining changing market dynamics.
The presence of a Bullish Marubozu candle on the daily chart signals sustained upward momentum, offering clear direction.
Supported by the 0.5 Fibonacci retracement level and the 50-period Exponential Moving Average (EMA) on the weekly chart, indicating a robust technical setup.
Stock has been consistently making higher highs, reflecting a trend of increasing bullish momentum.
A notable increase in trading volumes validates growing market interest, strengthening the bullish case.
Target - 2042 // 2250
Stoploss - weekly close below 1600
DISCLAIMER -
Decisions to buy, sell, hold or trade in securities, commodities and other investments involve risk and are best made based on the advice of qualified financial professionals. Any trading in securities or other investments involves a risk of substantial losses. The practice of "Day Trading" involves particularly high risks and can cause you to lose substantial sums of money. Before undertaking any trading program, you should consult a qualified financial professional. Please consider carefully whether such trading is suitable for you in light of your financial condition and ability to bear financial risks. Under no circumstances shall we be liable for any loss or damage you or anyone else incurs as a result of any trading or investment activity that you or anyone else engages in based on any information or material you receive through TradingView or our services.
@visionary.growth.insights

SWING IDEA - UNO MINDAUno Minda , a leading automotive components manufacturer, stands out as a compelling candidate for investors.
Reasons are listed below :
Multiple tests on the 600-630 levels followed by a breakout, now undergoing retesting, indicating a significant market shift.
Identification of a bullish "morning star" on the daily timeframe and a bullish "hammer" on the weekly timeframe, signaling potential upward momentum.
Strong support from the 50 EMA on the weekly and the 200 EMA on the daily timeframe, bolstering Uno Minda's price action.
Support from the golden Fibonacci zone reinforces the importance of current price levels, adding confidence to potential trades.
Consistent establishment of higher highs reflects a sustained bullish trend, aligning with swing trading strategies seeking upward movement.
A notable increase in trading volumes underscores growing investor interest and suggests the potential for sustained momentum.
Target - 720 // 765
StopLoss - weekly close below 604
DISCLAIMER -
Decisions to buy, sell, hold or trade in securities, commodities and other investments involve risk and are best made based on the advice of qualified financial professionals. Any trading in securities or other investments involves a risk of substantial losses. The practice of "Day Trading" involves particularly high risks and can cause you to lose substantial sums of money. Before undertaking any trading program, you should consult a qualified financial professional. Please consider carefully whether such trading is suitable for you in light of your financial condition and ability to bear financial risks. Under no circumstances shall we be liable for any loss or damage you or anyone else incurs as a result of any trading or investment activity that you or anyone else engages in based on any information or material you receive through TradingView or our services.
@visionary.growth.insights

BANK NIFTY INTRADAY LEVELS FOR 20/06/2024BUY ABOVE - 51600
SL - 51200
TARGETS - 51960,52200,52500
SELL BELOW - 51200
SL - 51600
TARGETS - 50950,50730,50550
NO TRADE ZONE - 51200 to 51600
Previous Day High - 51960
Previous Day Low - 50400
Based on price action major support & resistance's are here, the red lines acts as resistances, the green lines acts as supports. If the price breaks the support/resistance, it will move to the next support/resistance line. White lines indicates previous day high & low, high acts as a resistance & low acts as a support for next day.
Trendlines are also significant to price action. If the price is above/below the trendlines, can expect an UP/DOWN with aggressive move.
Please NOTE: this levels are for intraday trading only.
Disclaimer - All information on this page is for educational purposes only,
we are not SEBI Registered, Please consult a SEBI registered financial advisor for your financial matters before investing And taking any decision. We are not responsible for any profit/loss you made.
Request your support and engagement by liking and commenting & follow to provide encouragement
HAPPY TRADING 👍


SWING IDEA - CONCORContainer Corporation stands out as a promising prospect, supported by compelling technical indicators, inviting closer scrutiny.
Reasons are listed below :
Container Corporation has exhibited resilience at the 815 level, undergoing multiple tests before breaking through. The ongoing retest of this level signals a potential paradigm shift in the stock's trajectory.
A bullish marubozu candle on the weekly timeframe serves as a strong bullish signal. Its significance is magnified by its engulfing of the preceding six weekly candles, indicating a decisive shift in market sentiment towards the positive.
The stock's current trading at all-time high levels reflects a robust bullish sentiment. This not only signifies positive market perception but also suggests untapped potential for further upward movement.
Container Corporation's breakout from a period of robust consolidation is a key indicator of unleashed momentum. Such breakouts often mark the initiation of sustained upward trends.
Trading above both the 50 and 200 Exponential Moving Averages (EMA) provides additional technical confirmation, reinforcing the stock's bullish stance and indicating the strength of the prevailing uptrend.
Target - 1030 // 1140
StopLoss - weekly close below 813
DISCLAIMER -
Decisions to buy, sell, hold or trade in securities, commodities and other investments involve risk and are best made based on the advice of qualified financial professionals. Any trading in securities or other investments involves a risk of substantial losses. The practice of "Day Trading" involves particularly high risks and can cause you to lose substantial sums of money. Before undertaking any trading program, you should consult a qualified financial professional. Please consider carefully whether such trading is suitable for you in light of your financial condition and ability to bear financial risks. Under no circumstances shall we be liable for any loss or damage you or anyone else incurs as a result of any trading or investment activity that you or anyone else engages in based on any information or material you receive through TradingView or our services.
@visionary.growth.insights

NSE:GODFRYPHLP - 🚬 ➕🏪➕🍭 can it create a magicThis evergreen stock from the FMCG Sector listed in India is not just on the verge of a breakout after seven years but also building optionalities that can surprise us on the upside.
👍
✅ Weekly Closing close to 52-Week High
✅ Stock up close to 40% in the last couple of weeks
✅ Verge of the multi-year breakout
✅ FMCG sector
🤞~ Every green sector
🤞- Optionalities - Cloud kitchen (ready to eat)
🤞- Optionalities - Convenience store's growth
👎 💣
❎Promoter's credibility
❎ Sin Stocks
❎ Not in explosive growth
BSE:GODFRYPHLP
