Nsestocks

BLUESTARCO IT STOCK HAS LOW ADX VALUE INDICATING A REVERSAL OF ADX. THIS CAN LEAD TO A HUGE MOMENTUM IN EITHER UP OR DOWN
. AS THE SCENERIO IS LOOKING BULLISH, THERE IS HIGH PROBABILITY THAT IT CAN GO HIGH ATLEAST 5-8 PERCENT FROM NOW.


GABIEL - Looking for Target 150+Gabriel -- Above 50/100/200 EMA's
Good volumes on daily basis
Add to watch list - any reversal in CNXAUTO -- will see from 120 to 150 in short period .
Gabriel is on of the leader for supplying shock absorbers to majority of 2 wheeler manufacturers.
It has good market share.
And also recently Promoters increasing their holding from 52 to 55%
QoQ - increase in sales 36%
Past 3Q -- increasing Revenue
Company with Low Debt
-- Please do own research before investing.


SMA Strategy on Intellect Design ( NSE) Based on my analysis of the SMA 34 these are the key points.
Alert Candle - 14th May
Entry @735.75 (0.1% above )
SL - 685.30
Ratio- 50.45
T1 - 786.2
T2 = 836.65
T3 - wait for another altert candle

9.3 years Box/Channel breakout NMDC ( Swing/Intra )Look at the beauty of Price Action.
It was consolidating for 9.5 years.
It gave breakout of 7 year trendline breakout.
Please Try to take position above daily candle close of 206.6.
Safe players play above closing of 207 of weekly candle close.
Look at the Volume marked below.


RSI Bullish Divergence in NSE: TRENT 1D Chart In TRENT, there was a down-trend. Now, down-trend is over and a new trend is getting established.
There is RSI Bullish Divergence in 1D Chart. Stock may come down a bit in short team (like next 1 week).
Overall, if the new trend establishes itself, stock may go up in mid-term.

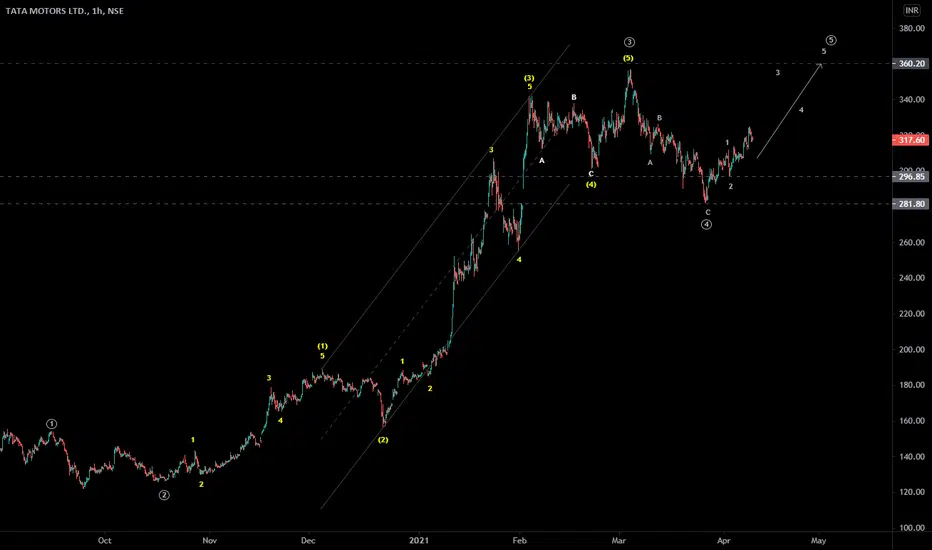
TATAMOTORS - Elliott wave analysis - 5th wave up It is in 3rd of 5th wave up of larger degree cycle. The stop loss level is 296.85 and target level will be above 360.
LT - Elliott wave analysis - 5th wave up It is in 2nd of 5th wave up and the stop loss for the set up is 1359.25. It will go above 1600 to finish the cycle.

JSWSTEEL - Elliott wave analysis - 5th wave up It is in 5th wave of larger degree. The internal 4th of 3rd wave is in progress and will go up once it finished sideways correction.

Hindalco - Elliott wave analysis It completed 5th wave of impulse cycle of larger degree from major bottom and therefore it should correcting down. But wait for impulse down wave to confirm the down sequence.
If it is moving in sideways then it is probably extend the 5th wave up and go higher much more.

Coalindia - Elliott wave analysis - 5th wave It is in 5th wave down and will drop up to 124-121 level.

Bhartiartl - Elliott wave analysis - ABC zigzag It is in abc zigzag move as B wave of ABC zigzag down, which is about to end. Then C wave down will start unless B wave will form complex sideways correction. If the drop will impulse down, then there is a chance of C wave down.

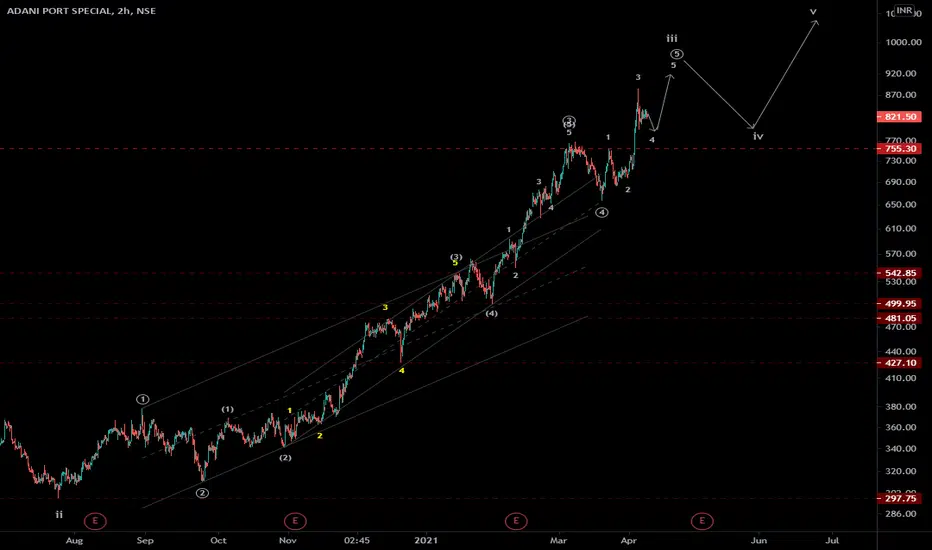
Adaniport - Elliott wave analysis - 5th waveIt is in 4th of 5th of 3rd wave of larger degree. The sideways pull back is a long opportunity for 5th wave up in 30 min time frame for target around 900 or higher. The stop loss is below 755.30.

TECHM - Elliott wave analysis - ABC zigzag down It is in wxy double zigzag correction down after completing impulse up cycle at last high. The last drop is impulse A wave and is under progress. So wait for B wave bounce to trade for C wave in double zigzag down.

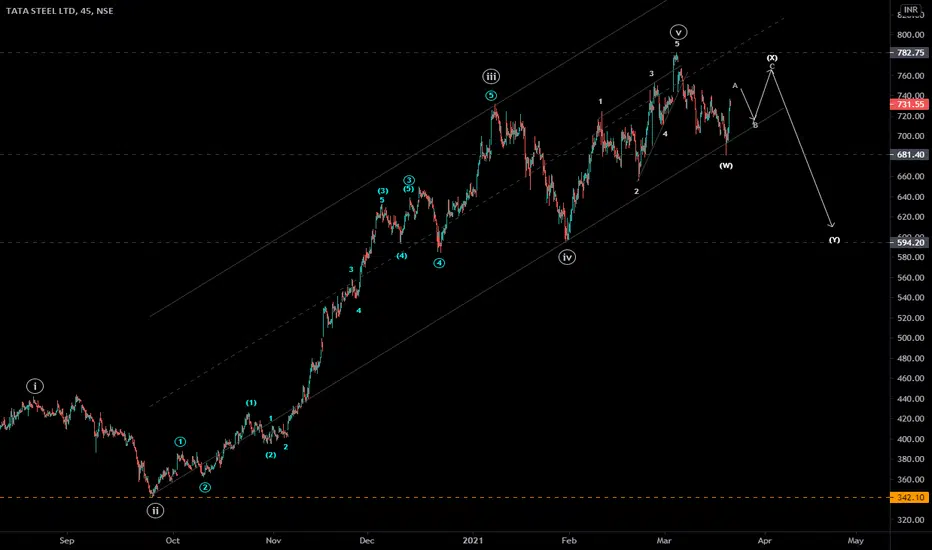
TATASteel - Elliott wave analysis - Correction It completed impulse at last top and 5th wave was ending diagonal. The down move was choppy so expecting sideways correction. It can bounce up to 750 before it starts going down below 650.