HDFC Bank: Navigating Bearish Momentum Amid Key LevelsNSE:HDFCBANK : Navigating Bearish Momentum Amid Key Levels
NSE:HDFCBANK : is currently facing bearish momentum, encountering significant downward pressure as it tests key support levels. As traders, it’s crucial to analyze the following resistance and support zones to gauge potential market movements:
Resistance Levels:
1726 / 1716: These levels are pivotal resistance points. A failure to breach these zones may trigger sell-offs, reinforcing bearish sentiment in the stock.
Support Levels:
1676 / 1636 / 1596: The stock is attempting to establish support near 1636. A break below this critical level could accelerate downward momentum, signaling further weakness and inviting additional selling pressure.
Upcoming Catalysts:
HDFC Bank will announce its Q2 earnings report on October 18. This upcoming event is likely to introduce volatility, potentially influencing price action significantly.
Market Outlook:
Despite efforts to maintain support at 1636, HDFC Bank's overall trend appears weak. Traders should closely monitor price action around these key levels to anticipate potential shifts in momentum.
Disclaimer: I am not a SEBI Registered Research Analyst (RA). This analysis is for educational purposes only and should not be considered as investment advice. Please conduct your own research or consult a financial advisor before making any trading decisions.
If you found this analysis helpful, please consider sharing, following, or boosting this idea! Your support is greatly appreciated!
Nsestocks

BEL : Key Support & Resistance Levels at Current Price of 286.90NSE:BEL : Key Support & Resistance Levels at Current Price of 286.90
As NSE:BEL trades around 286.90, it shows signs of weakness, and it's essential to focus on the following support and resistance levels for potential trading strategies:
Resistance Levels:
Immediate Resistance: 295 – This level may act as a barrier for upward movement.
Psychological Resistance: 300 – A significant psychological level that traders watch; a breakout above this could attract more buying interest.
Key Resistance: 307 – A crucial level for confirming bullish momentum; a strong close above here may indicate a sustained upward trend.
Support Levels:
Crucial Support: 285 – This key level may provide buying interest. A break below this could lead to further downside.
Stronger Support: 275 – Acts as backup support, offering a safety net for traders.
Lower Support: 267 – If tested, it would indicate significant selling pressure, warranting close attention.
Outlook: BEL appears to be weak at the moment. Holding below the 285 support could lead to further declines, potentially testing 275 and 267. A bounce back above 285 may provide a chance for a retest of 295, but caution is advised given the current weakness.
Disclaimer: I am not a SEBI Registered Research Analyst (RA). This analysis is for educational purposes only and should not be considered as investment advice. Please conduct your own research or consult a financial advisor before making any trading decisions.
If you found this analysis helpful, please consider sharing, following, or boosting this idea! Your support is greatly appreciated!

Swing Long Trade good for GUJGAS
Source Demand formed which has the potential to move the Price until the next Fresh opposite Supply which can become the Destination of this Uptrend which is about to emerge.
Here's the Demand and Supply Equilibrium for this Script, here we clearly understand where is low and where is High and as Traders we know when we buy low we have higher reward to risk ratios and same when we short when the prices are high so now we have the curve divided into 5 parts and when we trade we see the position of the Price in the curve.
This is a Demand formed after Price has reacted to the Source Demand now this has maximum probability in the Upward direction as its the 1st 4H Demand formed since Price reacted the Source Demand. Now let's check the Reward it has to offer and against what risk?
Here's the answer we need
TradeType : Swing Trade
Entry : Rs. 607.30
Stoploss. : Rs. 597.00
TakeProfit : Rs. 659.15
Reward. : Rs. 52.15
Risk : Rs. 10.00
Ratio : 5 / 1
For FUTURES

Planned Positional Long Trade in DALBHARAT
In the picture above we have drawn Trendlines to understand the direction of the Price. We see that Price has come down violating the Demand areas and respecting the Supply areas forming Lower Lows, hence was in a clear downtrend
Now most of the times before changing the trend price goes sideways
Here we see Price clearly going sideways. So we know there will be a change in Trend from Down to Sideways to UP Let's see how
An Uptrend has a Source from where the Trend starts and there is a point which we have called as a Destination of the Trend where it is trying to reach. So we have the Start point and End point of this upcoming Buy Trend.
Let's Understand the Demand and Supply Curve wrt to Price here
This tells us where is low, middle and high, course as traders we gotta buy low and sell high and avoid the middle area. This clearly tells us where is low and where is high.
After reacting to the Weekly Source Demand, in the Daily chart we see that Price has formed a Daily Demand which has violated its previous High which confirms Buying Momentum.
Now we have two possibilities for outcome of this Trade either it will take the SL or it will take the Target.
As a Trader we have to ensure our Reward to Risk ratio is favourable enough making the Risk practically worth taking.
Trade Type : Position Swing Trade
Entry : 1861.35
SL : 1794.25
Target : 2220.35
Reward : 359
Risk : 67.10
Ratio : 5.35/1

POTENTIAL INVESTMENT TARDE FOR VODAFONE IDEA
Here we look at the Quarterly chart since 2008, We see price was rallying up violating Resistances and respecting the Support areas, until it starts doing the opposite.
Now recently Price has violated a Supply area which indicates that the Buyers have just won over the sellers and now Price has given a Pullback in a 6 Months Demand.
Now we have a 6 Months Demand; So understanding the timeframe role into this Trade as the Demand in which we buy this a 6 months Demand hence we will have to consider a minimum of 1 to 2 years considering at least 2 to 4 candles of 6 months each to achieve the Target.
Here we have the following to consider before entering the Trade
Trade Type : Investment Trade
Entry : 10.10
SL : 5.70
TGT : 39.74
Risk : Rs. 4.4
Reward : Rs. 29.64
Ratio for Reward to Risk : 6.7/1

LTIM LONG BUY TRADE IDEALTIM long trade idea
buy signal/call
1. stock have completed a cup & handle kind of pattern
2. consolidation of considerable time period happend at this breakout level
3. us fed cut will benefit this stock
4. strong fundamentals
5. big investors with healthy holdings
buy @ 6450 SL @ 6200-6300 target 1 - @7000 target 2nd @7500 target 3 @ 8000 target 4 @ 8500
time period - around coming 3-9 months
NSE:LTIM

Bharat Dynamics BDL Short Setup on 1D Daily TF on RisologialBharat Dynamics BDL Short Setup on 1D Daily TF on Risologial
After 125% upside rally, BDL has given signs of a possible SHORT trade.
The BDL price is crossing under the Risological trend line, and if we see a red candle today, it is a sign of a good short trade.
Once the trade is confirmed, the Risological swing trading indicator will set the Entry, stoploss and profit targets for this trade.
I will update on this trade post 3:30 closing.
Take care.
Namaste!

MedPlus (MEDPLUS) - Long-Term Bullish Breakout Opportunity🔍 Analysis:
MedPlus has been in a prolonged downtrend, forming a clear descending trendline. However, recent price action suggests a potential breakout, offering an exciting opportunity for long-term investors.
📊 Key Points:
1. Down Trendline Breakout: Price has recently broken above the long-term descending trendline, signaling a possible trend reversal.
2. Volume Confirmation: Look for increasing volume to confirm the breakout's strength.
3. Support Levels: Previous resistance levels may now act as support, providing potential entry points on pullbacks.
🎯 Long-Term Outlook:
This breakout could indicate the beginning of a new uptrend, making it attractive for patient investors with a long-term horizon.
⏳ Time Frame: Long-term (1-3 years)
🛠 Strategy:
- Entry: Consider entering on a successful retest of the broken trendline or at key support levels.
- Stop Loss: Place below recent swing lows or the broken trendline.
- Take Profit: Set multiple targets based on previous highs and Fibonacci extensions.
⚠️ Risks:
- False breakout possibility
- Overall market conditions
- Company-specific fundamental factors
👀 Watch for:
- Breakout confirmation
- Increased trading volume
- Positive fundamental catalysts
Remember to conduct your own due diligence and consider your risk tolerance before making any investment decisions. Good luck and happy trading! 📈

IPCALAB Cup with handle pattern breakoutIPCA LABS a leading pharma company with good fundamentals have been moving to make a cup-with-handle pattern. As shown in the idea the pattern has given a breakout and might move to the target of the pattern. Good stock to learn about cup-with-handle pattern.

Raj Rayon : {"Potential for Best investment for 2024";}
We are at the Biggest Picture available as per the data;
Price has formed a Wave 1 which is an Impulse Wave In the Upward direction;
Wave 2 is a downward 3-Wave-Simple-Correction Structure, retracing Wave 1 by less than a 100% which suffices the Laws of Wave as per the Elliott Wave Theory and now.
======================================================================
Let's talk about the most interesting part The Most Awaited Wave 3 is expected to come out, showing the move which is the reason why we trade,
According to the Elliot Wave Theory the Projection of Wave 3 is at least 161.80% of the Wave 1.
Let's see on the charts the Extension Levels as per the Best Leading Indicactor Fibonacci Extension;
Yo !!!!
Now Last Month that's in August 24, Price has closed above the EMA and hence I see a Buying Momentum in the Monthly chart,
Looking at the Promotor Holding of this company which is more than 90% only confirms my belief in the future growth of the company.
So we have an Overall Target Projection of Rs. 158.03 {Derived as per Fibonacci Extension}
Now Let's look at the other side the {downside/ stop loss/ risk against the reward}

LLTS LONGLLTS has formed a cup with handle technical pattern which indicates a target of 50%. Must wait for breakout and retest and then you can plan your entry.

NAUKRI rounding bottomAn IT stock, named Info-edge stock symbol NAUKRI has made a rounding bottom pattern, which is now near it's resistance. Must break the resistance and retest it!

$NSE:ELECTCAST READY TO CAST NEW HIGHNSE:ELECTCAST is getting casted to cast new high's. As you all can see and observe the charts, The charts have formed double bottom along with ascending triangle pattern.
While writing this price has already broken out through ascending triangle and checking for volumes they have been good since last three months. Since this stock has already given 2x from march to till date it is risky buy here for me.
But still seeing the stocks technical and fundamentals this stock is so good to be true. We could see institutional buying and the chart is also showing bullishness with strong technical volume data.
Note:- Set Stop loss according to your apatite.
As indicated the new target for this stock with CMP:- 210 would be
1. Short term Targets
225
230
2. Mid Term Targets
240
255
3. Long Term Target
269
280
299
If all goes well soon Electro steel cast will cast new highs.
If you like my analysis do give a follow and boost to bring you more analysis.
Disclaimer
The above analysis posted is only for my reference. And it is not investment advice. These post are for educational purpose only. Please DYOR before investing you hard earned money. I am not responsible either for you profit or losses you make out of my analysis.

NATIONALUM: Range-Bound but Ready for a Breakout
Price Action: Trading within a range for the past few days
Potential Move: Awaiting a breakout in either direction
Breakout Alert: Stay tuned for a breakout soon

Indian Oil Corporation Ltd (IOC) - Breakout WatchAwaiting Breakout Opportunity: Monitoring for a potential breakout.
Good Volume Support: Healthy trading volume backing the move.

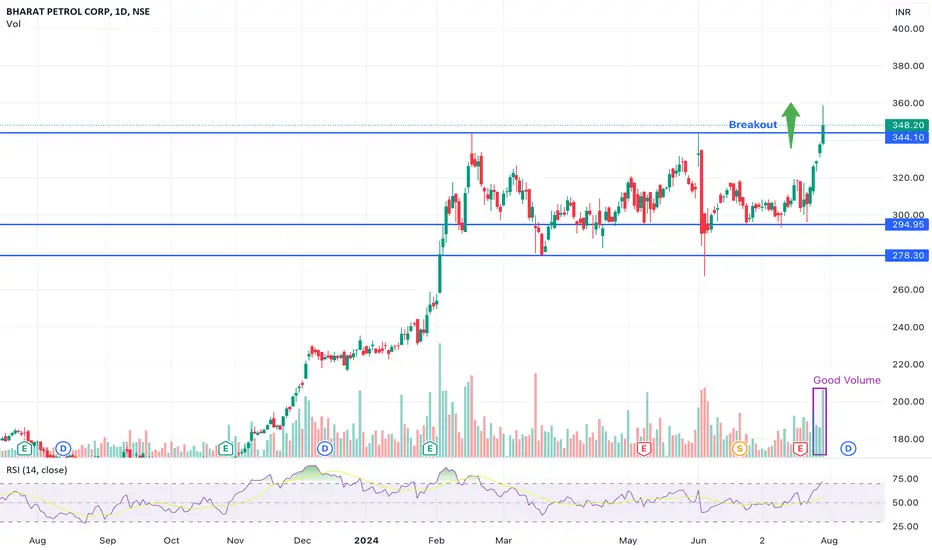
BPCL Breaks Out: Strong VolumeGood volume
Was in a range from February
Breakout resistance
Break resistance from February range
TATASTEEL Bullish Divergence & Reversal from SupportBullish Divergence in RSI
Reversal from Support
Next earning and revenue report on 31 july

VETO Bullish breakout with Good VolumeBullish Breakout
Good Volume
Next Resistance at 172 from July 21

TORNTPHARM: Breaking Resistance with Ascending Trend LineTORNTPHARM is breaking through resistance levels, supported by a strong ascending trend line and increased trading volume. This bullish momentum suggests potential for further upside.

INFY Breakout: Riding the Strong UptrendJoining the uptrend wave as NYSE:INFY breaks out of its February 2024 range. Time to capitalize on this momentum!

INDUSTOWER Breakout: Time to JoinINDUSTOWER has shown a strong uptrend since January 2024, recently consolidated, and has now broken out again. This renewed momentum suggests it's an opportune time to join the trend.

Federal Bank's Breakout Alert!Federal Bank (NSE) has broken out of its consolidation phase in a strong uptrend. This could be the perfect opportunity to join the trend and capitalize on potential gains. #Trading #StockMarket #NSE #FederalBank #Investing

ICICI Prudential: Breakout on Strong VolumeICICI Prudential has successfully broken through a key resistance level with strong volume, indicating potential for further upward movement. The stock shows significant bullish momentum, supported by high trading volume, confirming the reliability of this breakout. Traders should watch for continued strength in the coming sessions. Proper risk management is essential, with attention to support levels below the breakout.
