#cleanscience&techGoing to long position on this stock #cleanscience&tech....I marked the target & reversal zones
Nsestocks


BCG READY TO SHOOT!!!
Price has completed Wave 1 and Wave 2 also,
Wave 2 has retraced Wave 1 by less than 100 % which suffices the retracement rule of Wave 2 as per the Elliott Wave Theory,
As per Elliott Wave Theory Wave 3 extends by 161.80% of Wave 1 accordingly the Upward projection for this stock is 206.40 measured as per Fibo Extension.
Currently Price has formed a first Monthly Fresh Demand and has given a closing above the EMA which also confirms gain in Buying Power.
We have the Risk defined as per the Monthly Demand and Target derived as per the Wave 3 Fib Extension.

IOB Good Investment Opportunity !!!
As per the Annual chart, Wave 1 is a 3 Wave Sequence structure,
Wave 2 has retraced Wave 1 by less than 100% which suffices the Rule of the Wave 2, Now Wave 3 is forming now according to the fibonacci extension levels Wave 3 extends to 161.80% of the Wave 1 that way the Target for IOB is 367.20

PETRONET AMAZING OPPORTUNITY !!!
These are the Source and Destinations of the Uptrend.
The Demand and Supply Equilibrium showing us the Areas on the equilibrium.
Long Trade with an Amazing Reward to Risk ratio.
ENJOY THE RIDE ! ! !

JSWENERGY will break 700 days resistance 🤥Will it break high level support 📌 to reach new high in powe sector
Or it get rejected to white 🐻❄️ line 📌 below box 😂 huge crash
Let's watch 👀 stay with me 😉 i will update it 😜
Boost 🚀 post so u get updated on post when I am updating everything

Alembic ltd buy callEntry point :- 88
Stop lose :- 74
Target 1 :- 102
Target 2 :- 116
Target 3 :- 130

GRAPHITE INDIA ready for breakout and bull runGRAPHITE INDIA ,can be now a multi bagger stock if breakout sustains and investors looking for good investment oppurtunity can enter here as safe entry point.
those who are looking for 1-2 years of investment and good returns can enter in a SIP manner to avoid risk of major loss as volume increases investment amount can be increased.
NOTE: Enter only if strong breakup volumes are found

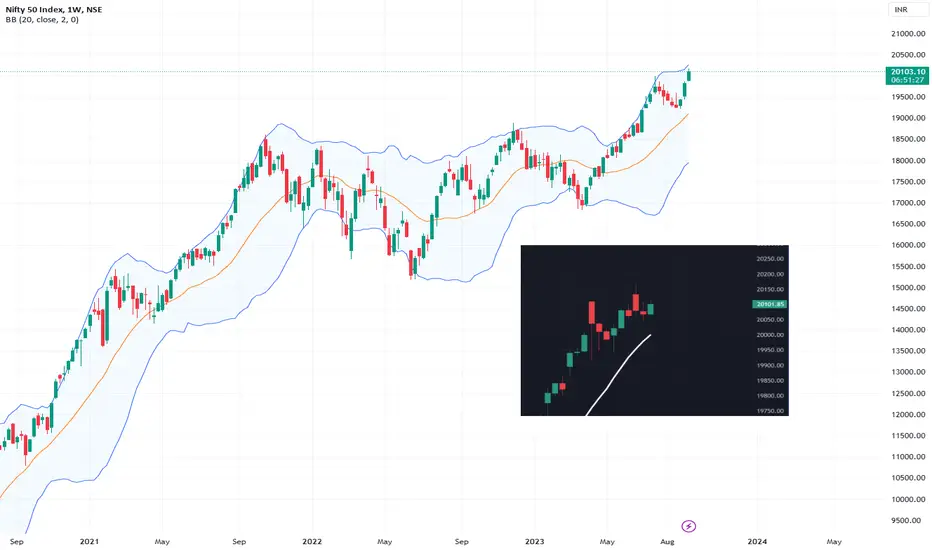
NIFTY - Rural and Retail Retail has been supporting the economies world over, yesterday US Retails sales demonstrates one more time. With Services continuing to print robust numbers, the inflation story is not fading away. The markets cheer with stronger data, but stable rate look. Pause is no hike, is a cut. This assumption continues, despite receding liquidity. Wealth effect continues to play bigger part than the scare of liquidity. Leaders in sweet spot, inflation financing as well as growth trajectory, welcome to world of stagflation. Clearly own the assets, thus own the equity remains the path to tread. Reports of Rural inflation continuing to surpass the Urban inflation is cause for worry for FMCG, no wonder markets are ahead in treating them with underweight. Small and Midcaps more or less will print outside week pattern. They have gone up near 40% in six months, annualised 80%. There select profit taking to continue. On the other sector IT, Sugar, Services, Metals, PSU remain stronger in addition to the Mighty Banks. Chines CRR cuts, ECB rate hike (last one is the assumption?) pushes risk assets higher, that includes the Crude Oil. Clearly markets are stretching to spaces of discomfort. Central Bankers will remain higher for longer. WPI comes softer, that is another point of comfort. The weekly graph Advance Block ideally today to move further high, with no lower wick and no upper wick, ask me if it is bullish or bearish at your own ignorance. The PIP clearly shows much easier support around the 20060 to push higher towards the 20180-20230.
For the day, buying with stops 20060 for move towards 20230-250 remains, also the RR is favourable to carry over the weekend. Keep in mind the trick is large caps than small caps.
NDTV - DAILY TIME FRAMEThe Structure looks good to us, waiting for this instrument to correct and then give us these opportunities as shown on this instrument (Price Chart).
Note: Its my view only and its for educational purpose only. Only who has got knowledge about this strategy, will understand what to be done on this setup. its purely based on my technical analysis only (strategies). we don't focus on the short term moves, we look for only for Bullish or Bearish Impulsive moves on the setups after a good price action is formed as per the strategy. we never get into corrective moves. because it will test our patience and also it will be a bullish or a bearish trap. and try trade the big moves.
we do not get into bullish or bearish traps. We anticipate and get into only big bullish or bearish moves (Impulsive Moves). Just ride the Bullish or Bearish Impulsive Move. Learn & Know the Complete Market Cycle.
Buy Low and Sell High Concept. Buy at Cheaper Price and Sell at Expensive Price.
Keep it simple, keep it Unique.
please keep your comments useful & respectful.
Thanks for your support....
Tradelikemee Academy

#JPPOWER TRADE IDEA SETUP Greetings Folks,
today i have prepared a setup on JPPOWER on NSE
the analysis is as follows
- past few days this stock has been performing well
- following a dynamic support trendline
- currently testing a static resistance which is about to break
- if tomorrow opens gap up, wait for a retest for entry
dont play with fire, always use predefined stoploss

NAZARA stock bullish reversal setup analysisnazara showing strong bullish momentum.
sell at 1st resistace at 1300...

NSE NIFTY hits all-time high I am thrilled to inform you that the NSE Nifty has achieved a remarkable milestone. It hit a new all-time closing high on Friday, driven by heavy buying in IT counters and fresh foreign fund inflows. Isn't that fantastic? The market is buzzing with positivity and optimism, and there couldn't be a better time to consider taking a long position on the NSE Nifty.
With the IT sector showing strong growth and foreign funds pouring in, the Nifty has been on an upward trajectory. This presents an incredible opportunity for traders like you to capitalize on this momentum and potentially reap significant rewards. By going long on the NSE Nifty, you stand a chance to benefit from the continued bullish sentiment and its positive impact on your portfolio.
So, why wait? Seize this moment and consider taking a long position on the NSE Nifty. With the market's current upbeat tone, it's an ideal time to ride the wave of success and potentially maximize your profits. Don't let this opportunity slip away - take action now and position yourself for success.

NSE HEROMOTOCO: Are Bulls Strong Enough to Sustain Impulse?Timeframe: 30 min
Brief analysis:
HEROMOTOCO has started a five-wave impulse cycle from the low of 2745.5. Price has accomplished wave Y of wave (4) and started impulsive wave (5). Buyers will have an opportunity with a captivating risk reward to ride the trend after confirmation for the following targets: 3167 – 3210 – 3260+ .
In-depth analysis:
NSE HEROMOTOCO has formed an impulsive cycle after an extreme low. In this case, the security is trading above the 20,50, 100, and 200 EMAs, which indicates that the bulls are in control. The formation of wave two was a running flat which retraced 0.618% of wave (1) at 2795. The third wave was an extensive wave that extended 3.618% of wave 1.
Wave 4 has formed a double zigzag formation with wave W-X-Y, in which wave W was a zigzag, and wave Y is an expanding triangle. The retracement of wave (4) is 0.382 of wave 3. Currently, the price has broken out and traded above wave d, which signals that the big move is about to unfold.
Corrective structure always holds by either wave X or B-D trendline in expanding triangle. The price can take a retracement if the demand is growing with low volume. If the price breaks out at 3131, traders can initiate a long position for the following targets: 3167 – 3210 – 3260+ . The setup will be invalid after the breakdown of wave e.
Target measurements:
100% Reverse Fibonacci of the 4th wave at 3208, and 38.2% extension of wave 1 through the 3rd wave at 3212.
50% Fibonacci extension of wave 1 through 3rd wave at 3261.
Nearby high of wave B at 3167.
We will update further information soon.


DCMSHRIRAM Breaks Key Resistance Level with High Volume
🔍 Overview 🔍
DCMSHRIRAM, has been facing strong resistance at the 910-920 level since November 2022. Interestingly, the 910 level has been acting as both support and resistance since June 2021. Today, we witnessed a breakthrough of the 910-920 level with a significant surge in volume. This breakout occurred on the weekly and daily charts, making it a crucial development to consider.
📊 Technical Analysis 📈
Plan buy trade near closing of market if breakout sustains above resistance
DCMSHRIRAM has been consolidating within the 910-920 range for several months, indicating a period of indecision and lack of clear direction in the stock's price movement.
The 910 level has proved to be a significant support and resistance zone in the past, highlighting its importance in determining the stock's future trajectory.
Today, we observed a breakout above the 910-920 range with an extraordinary surge in volume, suggesting strong buying interest and a potential shift in market sentiment.
The breakout on both the weekly and daily charts strengthens the bullish case for DCMSHRIRAM, as it indicates a potential trend reversal and the beginning of a new upward movement.
📊 Technical Terms 📈
Before delving further into the analysis, let's clarify some technical terms for those new to trading:
1. Resistance Level: A price level at which selling pressure is historically strong, causing the stock's price to struggle to rise above it.
2. Support Level: A price level at which buying interest is historically strong, preventing the stock's price from falling below it.
3. Breakout: The movement of a stock's price above a significant resistance level or below a significant support level, indicating a potential change in the stock's trend.
4. Volume: The number of shares or contracts traded in a security or market during a given period. High volume often indicates increased market activity and can confirm the strength of a price move.
👍📝 Like, Comment, and Follow 👍📝
If you found this analysis helpful, don't forget to give it a thumbs up! Feel free to share your observations in the comments section below. Your feedback and engagement are highly appreciated as they keep me motivated to consistently provide educational content.
Thank you for your support, likes, follows, and comments. It means a lot to me! If you want to stay updated with more articles and trade setups, make sure to follow me on TradingView: in.tradingview.com
💪🚀 Trading is not just about making money; it's a journey of self-discovery and personal growth. Embrace the challenges and keep pushing forward! 💪🚀
Remember, this analysis is for educational purposes only, and I am not a SEBI registered analyst. Always conduct thorough research and consult with a certified professional before making any investment decisions. Happy trading!

VEDL BUY NOW
Price has reacted to a Weekly Demand and has confirmed an Uptrend as per the Daily chart,
Yesterday Price gave a pullback into a Daily Demand with an amazing reward for the risk.
ENJOY THE RIDE ! ! !

CUPID, the much needed stock!!!The stock is consolidating in a rectangular structure!
Can look to enter at the base with a sl of 5-6% targeting 20% returns!

OBEROIRLTY SHORT 4:1
Price has reacted to a Strong Daily Supply which has formed after reacting t the Weekly Supply, Hence till 850 its Short
ENJOY THE RIDE ! ! !

OBEROIRLTY LONG
Price has a pullback in Upward Direction before it continues the DownTrend in the Higher timeframes Daily Demand to Daily Supply, Confirmation and Trade in 4H
Reward to Risk is favourable hence Long
ENJOY THE RIDE ! ! !

OBEROIRLTY BUY
Source : Daily Demand
Destination : Daily Supply
Confirmation : 4H
Trade : Long
Entry : 931.80
SL : 917.45
TP : 981.10
RISK : 14.35
REWARD : 49.30
RATIO : 3.4

{JK CEMENTS}:{RISE OF 3% ALMOST THE END OF BUYING}.
Price has formed Wave 1, 2 and 3 and now is in Wave 4 as Wave 2 has retraced Wave 1 by 38.20% hence we are expecting Wave 4 (To be a A Complex Correction due to the Principle of Alternationa nd Wave 2 being a Simple Coeection).
Now Wave 4 is in formation and there is a Quarterly Supply which starts @ Rs. 3130.40
A small Buy Trade as per the Daily chart till the Quarterly Supply.
ENJOY THE RIDE ! ! !

{ZYDUS}:{DETAILED ANALYSIS USING ELLIOT WAVE NOMENCLATURE}
Wave 1 is complete, Here the Wave 1 is a Leading Diagonal which tells us the Wave 3 will be way stronger than what we come accross generally;
Wave 2 has retraced Wave 1 by 61.80% which is a Golden Ratio and Fibonacci goes perfectly with the Waves logic,
Now Wave 3 is forming
According to the Fibo Ext tool we have the 1.618 Golden Level giving us the Target for ZYDUS on the Long Run.
This Analysis is done in the Higher Timeframes so consider the time accordingly only,
