$NSE:NTPC : A Powerhouse with Multibagger Potential?I’ve been reviewing NTPC Ltd ( NSE:NTPC ), India’s largest power generation company, and I see promising long-term potential as the company pivots towards cleaner energy and expands capacity to support India’s growing energy needs.
Why I See Multibagger Potential
Green energy pivot: NTPC is transforming from a thermal-heavy player to a clean energy leader — the transition opens huge long-term value.
Undemanding valuation: Despite the growth visibility, NTPC trades at reasonable PE and PB multiples, offering valuation comfort.
Policy tailwinds: Strong government focus on energy security, renewables, and electrification will continue to favor NTPC.
Execution strength: NTPC has a long history of successfully executing large-scale projects on time and within budget.
Just Accumulate near it best support Green AREA !
oNLY IN cASH
tHANKS
NTPC

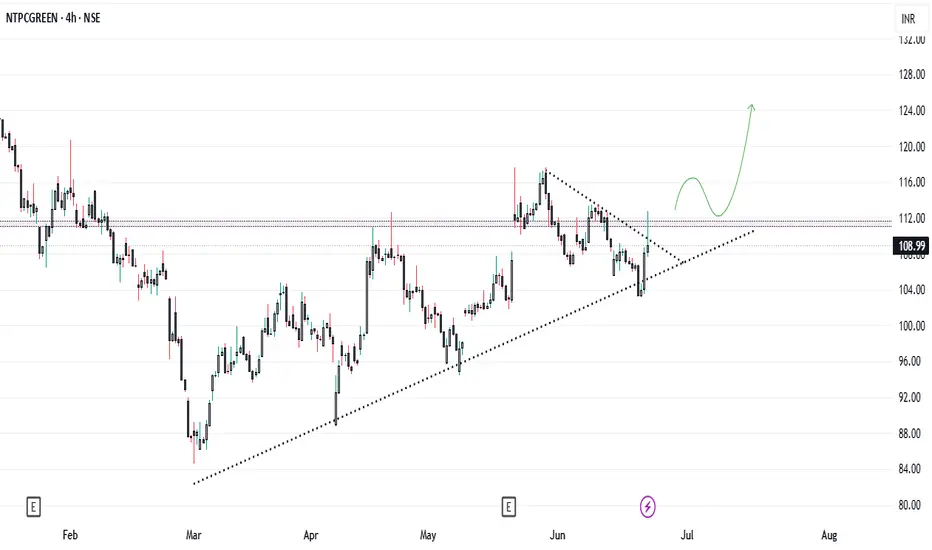
What’s the Next Move for NTPC Green...?NTPC GREEN is currently in a symmetrical pattern and is encountering resistance at the crucial level of 112. If it breaks through this resistance and the triangle while sustaining above 112, we will likely see a significant price increase.
NTPC One can make an entry in NTPC after breakout from cup and handle pattern.
If you find this helpful and want more FREE forecasts in TradingView, Hit the 'BOOST' button
Drop some feedback in the comments below! (e.g., What did you find most useful?
How can we improve?)
Your support is appreciated!
Now, it's your turn!
Be sure to leave a comment; let us know how you see this opportunity and forecast.
Have a successful week
DISCLAIMER: I am NOT a SEBI registered advisor or a financial adviser. All the views are for educational purpose only

fist videos 🟢 **Support Levels**
Key Support**: Around **₹325.70** (marked as a potential bounce zone).
The recent price action indicates a double-bottom or rounding-bottom pattern 📉➡️📈. This is a bullish reversal signal.
📈 **Resistance Levels**
Immediate Resistance**: ₹343.70
The stock needs to break this level convincingly for further upward movement.
Next Major Resistance**: ₹446.35 (52-week high).
If momentum sustains, this is the next target for bulls 🚀.
🔵 **Volume Analysis**
Rising green volume bars recently suggest increasing buying interest at the support level 🔊.
A breakout above ₹343.70 with high volume would confirm the bullish trend 💪.
🛑 **Risk Factors**
Failing to hold above ₹325.70 may lead to further downside, potentially testing lower levels.
The broader trend (decline from October highs) suggests caution until key levels are crossed 🔺.
### 🧭 **Outlook**
The chart suggests a potential upward move if the stock stays above ₹343.70 and gains momentum 📊.
**Summary with Emojis**
📉➡️📈: Reversal in progress.
- 🔊: Buying interest is increasing.
🚀: Potential breakout above ₹343.70.
⚠️: Risk if ₹325.70 breaks.
no recommendation for buy and sell

NTPC NSE:NTPC
NTPC (National Thermal Power Corporation) Ltd and its affiliated companies are mainly responsible for producing and distributing large amounts of electricity to state power utilities. The group also offers consultation, project management and supervision, energy trading, and exploration of oil and gas as well as coal mining.
The company's power plants portfolio as of June 2020 consists of approximately 63,000 MW from 70 power plants. Coal plants contribute around 83% of the total capacity, followed by gas/liquid fuel plants at 10%, hydro at 5%, and renewables at 2%. The company owns 17% of the total installed capacity in India, with a 22% share in electricity generation in the country. The company has a well-diversified allocated capacity across different regions, with no single region contributing more than 40% of the total allocated capacity as of April 2021.
The company has been operating at a higher PLF from its thermal power stations than the All India thermal PLF for the last 5 years. In FY20, it achieved a PLF of approximately 68%, while the All India Thermal PLF was only about 56% for the same year.
In terms of under-construction assets, as of June 2020, the company has approximately 20,500 MW of power projects under various construction phases. The majority of the under-construction capacity, around 76%, is from coal projects, followed by hydro at 13% and renewable energy (wind, solar) at 11%.
🔰
Sharing my weekly chart analysis for peaceful investing that I am following
disc: Invested for PWI - LAB portfolio , always focus on each trade to be a hero trade for long term.
do you own research no recommendation

NTPC BUY BULLISH "NTPC bullish," it seems that the overall sentiment is positive, with many analysts and technical indicators suggesting a potential increase in the stock price

NTPC Buy 26 Jun 2024Hey guys,
Check out this NTPC chart for tomorrow. It is showing support at 357 and it has started bullish move yesterday. I see potential till 371.
So, to summarize, Entry at 361, SL 357 and profit 371. See you tomorrow NTPC.
For such analysis, stay tuned.

Crossover Trade - NTPC📊 Script: NTPC
📊 Sector: Power Generation & Distribution
📊 Industry: Power Generation And Supply
Key highlights: 💡⚡
📈 Script is trading near upper band of BB.
📈 Already crossover MACD.
📈 Double Moving Averages are on urge of crossover.
📈 Right now RSI is around 64.
📈 One can go for Swing Trade.
⏱️ C.M.P 📑💰- 351
🟢 Target 🎯🏆 - 374
⚠️ Stoploss ☠️🚫 - 343
⚠️ Important: Always maintain your Risk & Reward Ratio.
✅Like and follow to never miss a new idea!✅
Disclaimer: I am not SEBI Registered Advisor. My posts are purely for training and educational purposes.
Eat🍜 Sleep😴 TradingView📈 Repeat 🔁
Happy learning with trading. Cheers!🥂

#SWANENERGY 291 Tgt 30% Upside Recommended BUY - Rachit Sethia$NSE:SWANENERFY
#SWANENERGY 291
TGT 375
SL 270
TF < 6M
RR > 4
RETURN 30%
Factors: BULLISH WEDGE BREAKOUT Trend Following Rising Volume with rising Prices. Flag pattern breakout. Pennant Pattern Breakout with Bullish Candle. Retest Successful. Higher Highs & Higher Lows. Broken above RESISTANCE levels Trading at SUPPORT levels Earnings are strong. Bullish Wedge Breakout Risk Return Ratio is healthy. And Rising from Double Bottom Pattern to Flag Pattern forming. If you like my work KINDLY LIKE SHARE & FOLLOW this page for free Stock Recommendations. With 💚 from Rachit Sethia


NTPCNSE:NTPC
One Can Enter Now ! Or Wait for Retest of the Trendline (BO) Or wait For better R:R ratio
Note :
1.One Can Go long with a Strict SL below the Trendline or Swing Low of Daily Candle.
2. Close, should be good and Clean.
3. R:R ratio should be 1 :2 minimum
4. Plan as per your RISK appetite
Disclaimer : You are responsible for your Profits and loss, Shared for Educational purpose

#GMRP_UI GMRP&UI 23 target 35+
GMRP_UI GMRP&UI
CMP 23
Target 35
SL 18
RR >2.5
Factors: BULLISH WEDGE BREAKOUT Trend Following Rising Volume with rising Prices. Flag pattern breakout. Pennant Pattern Breakout with Bullish Candle. Retest Successful. Higher Highs & Higher Lows. Broken above RESISTANCE levels Trading at SUPPORT levels Earnings are strong. Bullish Wedge Breakout Risk Return Ratio is healthy. And Rising from Double Bottom Pattern to Flag Pattern forming. If you like my work KINDLY LIKE SHARE & FOLLOW this page for free Stock Recommendations. With 💚 from Rachit Sethia

#EVEREADY 419 Tgt 519++ Buy - Rachit SethiaEVEREADY
CMP 419
TGT 519 ++
SL 360
Return ~ 24%
TF 6months
RR ~2
NSE:EVEREADY
#EVEREADY
Factors: BULLISH WEDGE BREAKOUT Trend Following Rising Volume with rising Prices. Flag pattern breakout. Pennant Pattern Breakout with Bullish Candle. Retest Successful. Higher Highs & Higher Lows. Broken above RESISTANCE levels Trading at SUPPORT levels Earnings are strong. Bullish Wedge Breakout Risk Return Ratio is healthy. And Rising from Double Bottom Pattern to Flag Pattern forming. If you like my work KINDLY LIKE SHARE & FOLLOW this page for free Stock Recommendations. With 💚 from Rachit Sethia

NTPC Breakout or Breakdown Risk Reward 1 to 3 Trades
In this approach, Once Breakout or Breakdown levels are breached, we initiate Long or Short positions accordingly with Proper stop loss as mentioned in the chart. Since the Risk Reward is 1:3, we can take a maximum of 3 trades.
If we follow this approach, over the long run, money is gained.
A trader is advised not to treat these setups as lottery tickets. Since only I know why these work (while others may not), only I have the conviction to trade them in real market. So kindly treat them as educational trades only.
Happy Trading!


NTPC: Looks StrongNTPC has formed a cup and handle type structure and its price action looks strong for upmove.
Fundamentals are good for NTPC.
You can keep this stock in your watchlist.
A target of 200 is likely in near future.

NTPC-- Channel Breakdown Range??observations::
After a strong fall from 178 range price is slowly approching the supply area....
slowly moving upwards in a channel.
we have a demand zone @ 169-170 range...
we have Resistance @180 range as well...
if suddenly price is breaks the supply area.. look for sell @180 range.
keep track this levels.

NTPC possbile breakoutIf NTPC manages to close above 175, then long and accumulate NTPC on dips.
Stoploss - 161
Target - 195 (In the next 3 months)

forming an U, keep in radarThe stock has formed an U pattern on daily chart and we can see a good move upon breakout. Keep the scrip in radar

NTPCwait for the support at the trendline and breakout the upper trendline. Follow and give a comment or like ..

NTPC - Consolidation BreakoutNSE: NTPC is closing with a consolidation breakout candle supported with volumes.
Today's volumes and candlestick formation indicates strong demand and stock should move to previous swing highs in the coming days.
The stock has been moving along the trendline support for the past few days which is indicating demand.
One can look for a 8% to 12% gain on deployed capital in this swing trade.
The view is to be discarded in the event of the stock breaking previous swing low.
#NSEindia #Trading #StockMarketindia #Tradingview #SwingTrade
Disclaimer:
This is for educational purposes only.

Trendline Breakout in Ntpc Limited...Chart is self explanatory.
Disclaimer: This is for demonstration and educational purpose only. This is not buying or selling recommendations. I am not SEBI registered. Please consult your financial advisor before taking any trade.

NTPC Buy for intraday tradingNTPC Buy for intraday trading if stock break the given resistence level............
