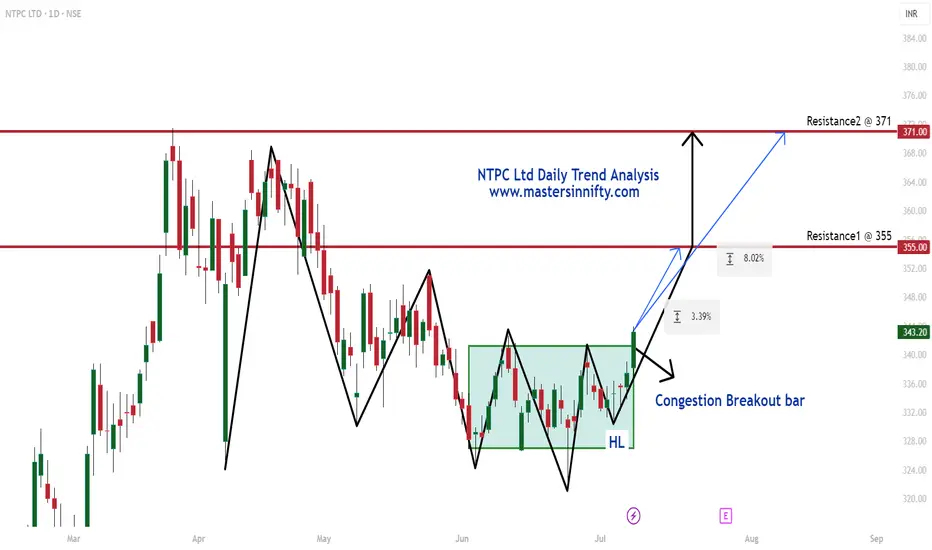
NTPC Daily Trend AnalysisNTPC Ltd has broken out of a 24-bar range, formed a new higher low, and closed above the range today.
This breakout signals a potential bullish trend over the next 7 trading sessions, with an initial target of ₹355. If the price sustains above ₹355, it may advance toward the next key resistance level at ₹371.
This is my personal view and not a buy or sell recommendation. Traders are encouraged to perform their own technical analysis before taking any trading decisions.
Ntpcanalysis
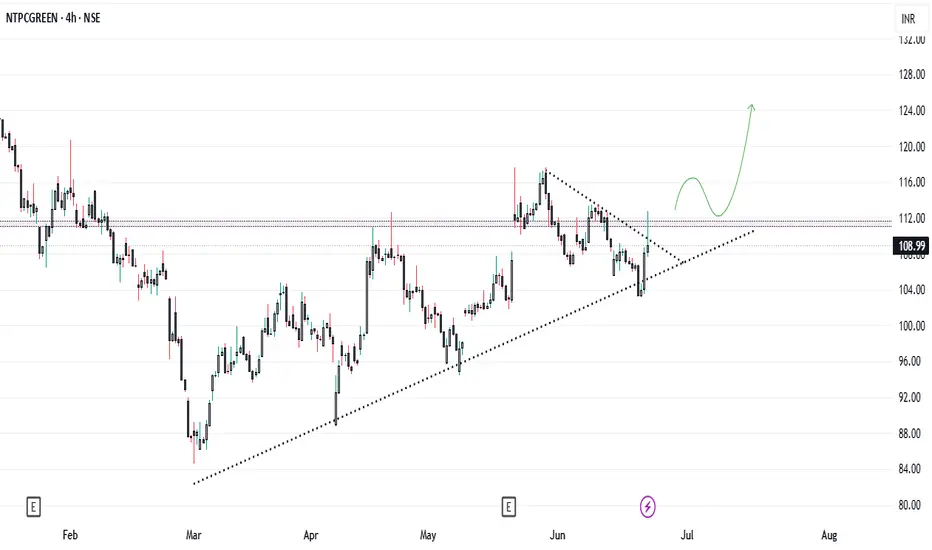
What’s the Next Move for NTPC Green...?NTPC GREEN is currently in a symmetrical pattern and is encountering resistance at the crucial level of 112. If it breaks through this resistance and the triangle while sustaining above 112, we will likely see a significant price increase.
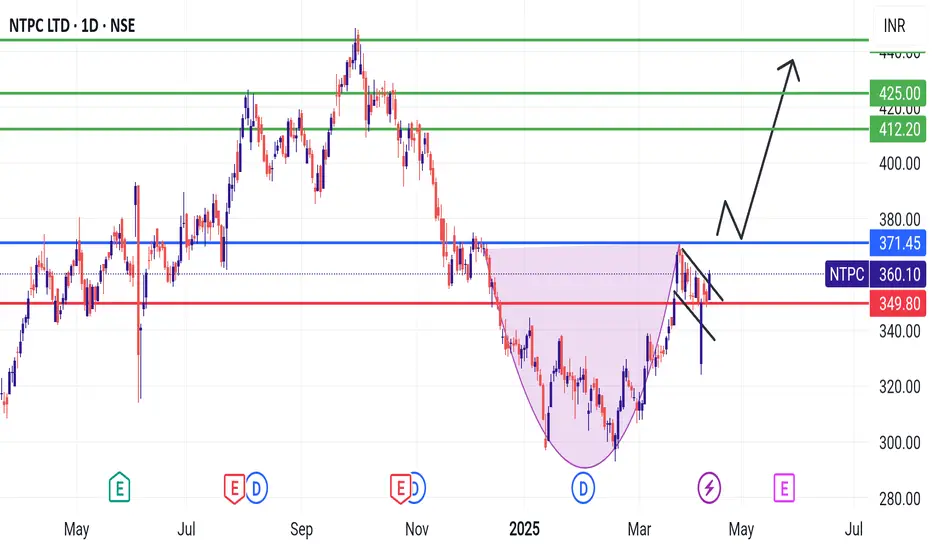
NTPC One can make an entry in NTPC after breakout from cup and handle pattern.
If you find this helpful and want more FREE forecasts in TradingView, Hit the 'BOOST' button
Drop some feedback in the comments below! (e.g., What did you find most useful?
How can we improve?)
Your support is appreciated!
Now, it's your turn!
Be sure to leave a comment; let us know how you see this opportunity and forecast.
Have a successful week
DISCLAIMER: I am NOT a SEBI registered advisor or a financial adviser. All the views are for educational purpose only

NTPC cup and handle pattern•CMP: ₹375 Stop Loss: ₹350 Target:*410/425/440
DISCLAIMER: I am NOT a SEBI registered advisor or a financial adviser. All the views are for educational purpose only.
fist videos 🟢 **Support Levels**
Key Support**: Around **₹325.70** (marked as a potential bounce zone).
The recent price action indicates a double-bottom or rounding-bottom pattern 📉➡️📈. This is a bullish reversal signal.
📈 **Resistance Levels**
Immediate Resistance**: ₹343.70
The stock needs to break this level convincingly for further upward movement.
Next Major Resistance**: ₹446.35 (52-week high).
If momentum sustains, this is the next target for bulls 🚀.
🔵 **Volume Analysis**
Rising green volume bars recently suggest increasing buying interest at the support level 🔊.
A breakout above ₹343.70 with high volume would confirm the bullish trend 💪.
🛑 **Risk Factors**
Failing to hold above ₹325.70 may lead to further downside, potentially testing lower levels.
The broader trend (decline from October highs) suggests caution until key levels are crossed 🔺.
### 🧭 **Outlook**
The chart suggests a potential upward move if the stock stays above ₹343.70 and gains momentum 📊.
**Summary with Emojis**
📉➡️📈: Reversal in progress.
- 🔊: Buying interest is increasing.
🚀: Potential breakout above ₹343.70.
⚠️: Risk if ₹325.70 breaks.
no recommendation for buy and sell

NTPC NSE:NTPC
NTPC (National Thermal Power Corporation) Ltd and its affiliated companies are mainly responsible for producing and distributing large amounts of electricity to state power utilities. The group also offers consultation, project management and supervision, energy trading, and exploration of oil and gas as well as coal mining.
The company's power plants portfolio as of June 2020 consists of approximately 63,000 MW from 70 power plants. Coal plants contribute around 83% of the total capacity, followed by gas/liquid fuel plants at 10%, hydro at 5%, and renewables at 2%. The company owns 17% of the total installed capacity in India, with a 22% share in electricity generation in the country. The company has a well-diversified allocated capacity across different regions, with no single region contributing more than 40% of the total allocated capacity as of April 2021.
The company has been operating at a higher PLF from its thermal power stations than the All India thermal PLF for the last 5 years. In FY20, it achieved a PLF of approximately 68%, while the All India Thermal PLF was only about 56% for the same year.
In terms of under-construction assets, as of June 2020, the company has approximately 20,500 MW of power projects under various construction phases. The majority of the under-construction capacity, around 76%, is from coal projects, followed by hydro at 13% and renewable energy (wind, solar) at 11%.
🔰
Sharing my weekly chart analysis for peaceful investing that I am following
disc: Invested for PWI - LAB portfolio , always focus on each trade to be a hero trade for long term.
do you own research no recommendation

NTPC Breakout or Breakdown Risk Reward 1 to 3 Trades
In this approach, Once Breakout or Breakdown levels are breached, we initiate Long or Short positions accordingly with Proper stop loss as mentioned in the chart. Since the Risk Reward is 1:3, we can take a maximum of 3 trades.
If we follow this approach, over the long run, money is gained.
A trader is advised not to treat these setups as lottery tickets. Since only I know why these work (while others may not), only I have the conviction to trade them in real market. So kindly treat them as educational trades only.
Happy Trading!

NTPC-- Channel Breakdown Range??observations::
After a strong fall from 178 range price is slowly approching the supply area....
slowly moving upwards in a channel.
we have a demand zone @ 169-170 range...
we have Resistance @180 range as well...
if suddenly price is breaks the supply area.. look for sell @180 range.
keep track this levels.

forming an U, keep in radarThe stock has formed an U pattern on daily chart and we can see a good move upon breakout. Keep the scrip in radar

#NTPC Looks good - 08 MAR 23#NTPC...
Intraday as well as swing trade
All levels given in charts
IF good potential seen then we work in options also
if activate then possible a huge movement Keep eye on this
We take trade only when it activates...

NTPC Ltd Rounding Bottom formation Swing High Break*NTPC Ltd*
Time Frame: Daily
Observation:
* Rounding Bottom formation
* Swing High Break
* Mean (EMA) Diversion
Resistance/Target: 193 212 229 240
Support 165 153; Dynamic Support at 200 EMA.

NTPC - Bullish SetupStrong Buy Above 150, T1 - 170, T2 - 185, T3 - 201, T4 - 218, T5 - 233, T6 - 242.......... STRICT STOP LOSS below 137.
PLEASE NOTE : If it makes new all time high then keep trailing SL from 240.


NTPC Ltd. Buy target 170 Doubt Call 6375211468NTPC Looking good it gives breakout the 154 level there after the volume in the share is also good. Because of this the trade become more reliable and profitable 10% profit expect . A
Any issue or doubt, learning Call 6375211468

Good move expected from NTPC."NTPC" has given a channel breakout along with channel breakout of "CNXENERGY", So it's highly bullish and can give a good return. Any suggestion is always welcomed. NSE:NTPC .

NTPC IS MAKING RISING THREE METHODS The Stock is currently on the way of making a Rising Three Methods Pattern on Monthly Chart, if the Stock Price Closes above 144.2 this month.
It is a Bullish Continuation pattern, can be hold for couple of months if formed.
I am learning, any critics or comments are welcome.
Happy Investing :)

NTPC looks good to buy for multiple reasonsReasons to buy-
1-taking support and reversing from 200 EMA
2-lower trendline support
3-triangle pattern breakout
4-good R:R from current level.

NTPC NTPC has given breakout with very good intensity of volume and also can do breakout 13 years resistance trendline, which is located near 135 zones, all parameters are pretty good for long buyers. all the key levels are mentioned in chart with Stop-loss and targets.
Key Levels
Volume intensity is good in Breakout candle
Macd in daily positive crossover and Uptick and also above zero line
Rsi in daily above 60 uptick
Dmi adx also positive
Upper Bollinger Challenged by price
Price near 13 years Resistance Trend line
Disclaimer
I am not sebi registered analyst
My studies are Educational purpose only
Consult with your Financial advisor before trading or investing

ENTER after the Breakout or Buy and HoldPositional and Intraday traders: Enter after the breakout or buy and trail your stoploss.

Looking good in upcoming few days for short termBuy @NTPC
Target 1 : 100.45 , Target 2 : 107.45 , Target 3 : 122

NTPC LongNTPC took support from 97 range (blue line), marching towards 108(first target)
Orange lines - Targets
Blue Lines - Support zone


ntpc will fall down or not i am a new trader pls some one confirm that my analysis is correct or not
1.its forming an wedge pattern and moving down words
2. it have taken a resistance at 108.15 and start to fall down
3.the wedge patter is supporting both day and week chart time frame
4. And RSI touched 80 over brought zone
NSE:NTPC
