Don’t miss this Move on LTBRLTBR forming a classic cup and handle with confluence in the timing of recent institutional exposure.
The chart speaks for itself
Nuclear

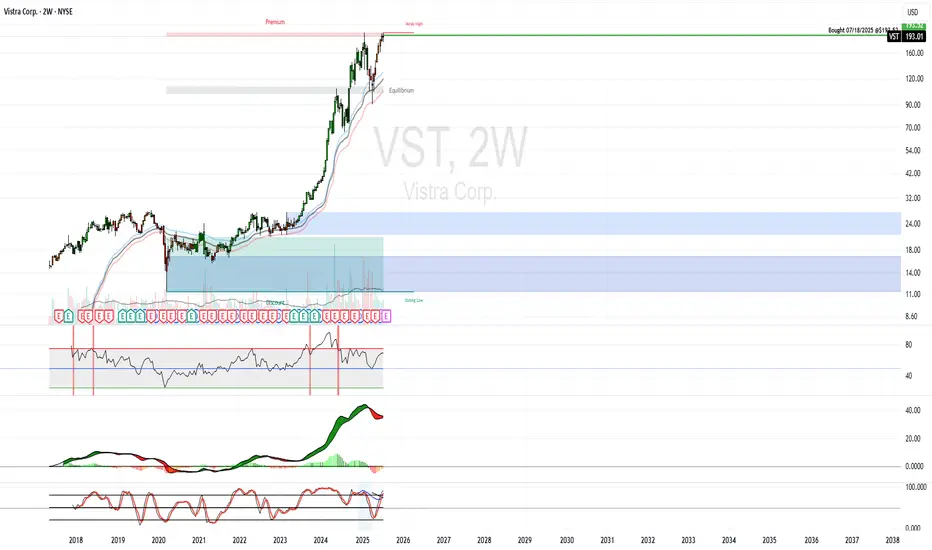
VST Purchase - Nuclear ThemeVistra Corp. (VST) – Cash Flow Machine
$4.09B TTM operating cash flow, highest among peers 2.
Strong nuclear and renewables mix, with AI data center exposure.
Thesis: Balanced growth and income play with upside from AI-driven demand.
Purchased CEG earlier. AI megatrend is tied to nuclear.
Not stoked about the purchase price, but long term growth should overcome any short term volatility. Also, not excited about the GreenBlue rank, we will see if it continues to improve.
Other Nuclear stocks on my radar:
VST
CEG
GEV
TLN
SMR
GreenBlue Rank: 1055 / 2500
GreenRed Rank: 143 / 3147
USA bombs IRAN - Bitcoin Falling!Operation Midnight Hammer was a major U.S. military strike carried out on June 21, 2025, targeting three of Iran’s key nuclear facilities: Fordow, Natanz, and Isfahan.
The operation involved seven B-2 Spirit bombers, each flying an 18-hour mission from Missouri, supported by over 125 aircraft, including refueling planes, fighter escorts, and surveillance assets.
To maintain the element of surprise, the U.S. used deception tactics, such as sending decoy aircraft westward over the Pacific while the actual strike force flew east toward Iran with minimal communications.
The bombers dropped Massive Ordnance Penetrators (MOPs)—30,000-pound bunker-busting bombs—on the fortified nuclear sites. Cruise missiles launched from a U.S. submarine struck additional infrastructure targets.
The Pentagon described the mission as the largest B-2 operational strike in U.S. history and the first known combat use of the MOP. Officials emphasized that the operation was aimed solely at nuclear infrastructure and not at Iranian civilians or military personnel

Uranium The Epic Explosion!Global uranium demand is up to rise about 28% by 2030, driven by clean-energy pushes, nuclear restarts (e.g., Japan), and advanced modular reactors
Kazakhstan’s largest producer, Kazatomprom, cut its 2025 production forecast by ~17% due to logistical hurdles and resource constraints
Iran signaled openness to discussions with European counterparts aimed at curbing its uranium enrichment levels. However, seasoned diplomacy and regional conflict issues complicate prospects for an agreement
Bottom line: Uranium markets are tightening due to production cuts and geopolitical risk, while long-range demand is gaining momentum thanks to nuclear expansion and emerging energy technologies.

This Just Went Nuclear - Explosive Move!Uranium prices have surged due to several key factors:
- Increased demand for nuclear energy – Many countries are expanding nuclear power to meet clean energy goals.
- Geopolitical tensions – Supply disruptions from Russia and Niger have tightened the market.
- Underinvestment in uranium mining – Years of low prices led to reduced production, creating a supply deficit.
- Government policies – The U.S. and other nations are prioritizing domestic uranium production for energy security.
- Rising uranium prices – Spot prices have climbed significantly, boosting mining stocks.
We are near some major resistance and expect some profit taking to occur.
Names Like NYSE:OKLO NYSE:SMR AMEX:URNM AMEX:URA NASDAQ:CEG should be on watch for a strong selloff.

OKLO Daily Cup and HandleStrong pattern formed off a key level that could breakout in August or September. Upper price target of 90 as long as the gap is filled but not too far under

Update on Nuclear Stocks SMR, OKL0 + NEW IDEAS VRT, TSLA OKLO, SMR going through the roof. NNE is trailing today. Sold out most of the RKLB.
Lets go over the SPY, QQQ which are flagging now after holding support.
Liking this VRT and LTBR AND LUNR for potential swings along with HIMS!
Lets dig into the charts and see whats up!

Can Small Reactors Solve Big Energy Problems?Oklo Inc. has recently captured significant attention in the nuclear energy sector, propelled by anticipated executive orders from President Trump to accelerate the development and construction of nuclear facilities. These policy shifts are designed to address the US energy deficit and reduce its reliance on foreign sources for enriched uranium, signaling a renewed national commitment to atomic power. This strategic pivot creates a favorable regulatory and investment environment, positioning companies like Oklo at the forefront of a potential nuclear renaissance.
At the core of Oklo's appeal is its innovative "energy-as-a-service" business model. Unlike traditional reactor manufacturers, Oklo sells power directly to customers through long-term agreements, a strategy lauded by analysts for its potential to generate sustained revenue and mitigate project development complexities. The company specializes in compact, fast, small modular reactors (SMRs) designed to produce 15-50 megawatts of power, ideally suited for powering data centers and small industrial areas. This technology, coupled with high-assay, low-enriched uranium (HALEU), promises enhanced efficiency, extended operational life, and reduced waste, aligning perfectly with the escalating energy demands of the AI revolution and the burgeoning data center industry.
While Oklo remains a pre-revenue company, its substantial market capitalization of approximately $6.8 billion provides a strong foundation for future capital raises with minimal dilution. The company targets the commercial deployment of its first SMR by late 2027 or early 2028, a timeline potentially accelerated by the new executive orders streamlining regulatory approvals. Analysts, including Wedbush, have expressed increasing confidence in Oklo's trajectory, raising price targets and highlighting its competitive edge in a market poised for significant growth.
Oklo represents a high-risk, high-reward investment, with its ultimate success contingent on the successful commercialization of its technology and continued governmental support. However, its unique business model, advanced SMR technology, and strategic alignment with critical national energy and technological demands present a compelling long-term opportunity for investors willing to embrace its speculative nature.

SMR NNE OKLO – Breakout Setup Triggered by Nuclear CatalystNYSE:SMR is lighting up after Trump’s announcement on nuclear energy — and it’s not alone. NYSE:OKLO and NASDAQ:NNE are also setting up, but NYSE:SMR has one of the cleanest breakout structures on the board.
🔹 Catalyst: Trump’s nuclear energy announcement yesterday is putting serious momentum behind the sector.
🔹 Technical Setup: NYSE:SMR is building a textbook breakout formation, with $32 as the key breakout level.
🔹 Volume & sentiment are increasing — early signs that buyers are positioning.
My Trade Plan:
1️⃣ Anticipatory Entry: I’m looking to buy the first dip before the $32 breakout — getting in early with tight risk.
2️⃣ Add on Breakout: Will scale in above $32 if volume confirms.
3️⃣ Stop Loss: Just below the recent base — staying tight on risk.
Why I’m Watching This Closely:
Sector catalyst + technical setup = 🔥
Nuclear names have been under accumulation, and now they’ve got a narrative tailwind.
First dip after a big catalyst is often the best R/R opportunity.

$UUUUTrump’s executive orders to ease Nuclear reactor regulations and improve fuel supply chains, boosting nuclear energy demand.
Before 2025 started, once Trump won the election I was certain he would eventually pass executive order(s) and/or make political deals to ease nuclear reactor regulations and improve fuel supply chains, naturally boosting nuclear energy demand. This does not just affect AMEX:UUUU it also affects most of the Nuclear Energy stocks and Uranium-related stocks, like AMEX:UEC , NASDAQ:CEG , NASDAQ:NNE , NYSE:OKLO etc.
We should see most of these stocks continue to grow in value throughout 2025 at the very least. I don't know yet how they will fair in 2026 though 2025 should continue to be a good year for nuclear energy and uranium stocks :)

Long Uranium and Nuclear via UECMy price targets for UEC. Based on the US Government's newly restored enthusiasm for Nuclear power & their borderline hostility towards dependance on other nations for much of anything, I think this All-American uranium company is ripe for a big run. I believe it will go way past my price targets and I may only trim half of my position if TP 3 hits.

CVVUF-Odds Favor a Resolution to the Upside Barring an imminent or protracted recession, CVVUF looks ready to confirm a close out and above this massive bullish pattern


Get ready to double your honeyAll right, getting ready for 2x 3x my money !!! Luv this dip and the swings. Bubble begins now !!

Giant Ascending Triangle-LTBRLTBR seems to have formed a 4 year bottoming pattern which seems to be imminently broken
You can view this strange bottoming and reversal in the form of the consolation drawn on the chart

LEU(CENTRUS ENERGY) and LTBR (LIGHTBRIDGE) LONG LONG LONGLEU seems to be undergoing a continuation from its prior move months ago, while LTBR seems to have completed a 2 decade reversal pattern and conformation to hold the breakout is key

$NNE longNNE is in a channel right now, but basic support has formed, with a sucessful bounce. Besides the TA, the company in general has quite a bit to offer.

OKLO: mid-term topping potential in nuclear space The swing long set-up from Dec pullback is about to fully realize its potential
From my Dec chart archive:
pbs.twimg.com
And Jan update:
pbs.twimg.com
when I wrote: "It wouldn't not surprise me to see price pulling back bellow Oct's highs slightly and finding support on rising 8/21 emas before continuing its advance. Until price is above 21 ema, next important macro-resistance zone: 33-40"
As for now my operative scenario that price is preparing either to finish its upside momentum extending towards: 46-50 resistance zone or already have finished it and in the process of bouncing before a larger corrective way starts unfolding in the coming weeks.
If we have the mid-term top already in place, then 20-12 macro support zone might be a good place for the larger bottom to start forming before the new larger upside trend beginnes.
The same kind of pattern (bounce and new larger corrective way down) I expect to manifest itself in the coming weeks in other leading energy names (NNE, CLS, VST, GEV)
If price moves above the resistance zone mentioned, the proposed scenario needs to be re-assessed.
Thank you for your attention and wishing you the best trading and investing results in 2025!

$SPROTT Physical Uranium in 2 year coiling triangleAfter a surge of prices in
SRUUF and spot uranium in 2023 - nearly doubling from ,from ~$12 to ~$24 - SRUUF
spent the entirety of 2204 retracing back to around $16-17... forming a triangle pattern that is gettin increasingly tight. At some point in 1Q or 1H this year believe the commodity will start a bullrun that could last years driven by increasing demand
At Goldman
CCJ conf: "The industry is seeing demand the likes have never been seen before"... Pariticularly, in the last half oft 2024, the market has seemed increasingly interested in developing nuclear power solutions to power all the new AI data centers in a green way. New tech is faciliting this. Even if many of the new reactors don't come online for years, firms will be stockpiling have to start stockpiling
Positive technical developments on the montly chart: that suggest
SRUUF
will break to the upside out of this triangle in coming months:
-Recent Positive Divergences in the BBP (bull bear power) and WIliam %R
-Oversold RSI suggest retrace is long in the tooth and the CCI is at the -100 level where its bounces every time since 2022
On top of that we are sitting near the anchored VWAP since inception for the first time in a year and that has been a supportive chart point area ever since. The volume profile suggest that should occur mostly between the range of 16.9 and 20 dollars.
If vwap fails and it breaks out of the triangle to the downside, possibility of a quick move down to the 13 area

Rising Demand for $SRUUF uranium to rise steadily riseAfter a surge of prices in OTC:SRUUF and spot uranium in 2023 - nearly doubling from ,from ~$12 to ~$24 - OTC:SRUUF spent the entirety of 2204 retracing back to around $16-17... forming a triangle pattern that is gettin increasingly tight.
At Goldman NYSE:CCJ conf: "The industry is seeing demand the likes have never been seen before"... Pariticularly, in the last half oft 2024, the market has seemed increasingly interested in developing nuclear power solutions to power all the new AI data centers in a green way. New tech is faciliting this. Even if many of the new reactors don't come online for years, firms will be stockpiling have to start stockpiling
Positive technical developments on the montly chart: that suggest OTC:SRUUF will break to the upside out of this triangle in coming months:
-Recent Positive Divergences in the BBP (bull bear power), WIliam %R
-Oversold RSI suggest retrace is long in the tooth and the CCI is at the -100 level where its bounces every time since 2022
on top of that we are sitting near the anchored VWAP since inception for the firs time in a year and that metric has been a supportive price point in the past,
We be stuck chopping around here a couple months or more but I think the stars are aligned for OTC:SRUUF and physical uranium to outpace other commodities for year, perhaps many, to come

NuScale Power (SMR) - Cup and Handle Breakout, Target $25 - $40Overview:
NuScale Power Corporation (NYSE: SMR) is showing a bullish Cup and Handle pattern, a classic setup that often precedes a significant upward move. The cup has formed over the past few months, and the stock is currently in the handle formation, signaling a potential breakout.
Technical Setup:
Pattern: Cup and Handle
Breakout Level: ~$20.31 (current resistance area)
Target Zone: $25.37, $33.65, and $40.57 (potential targets based on previous resistance levels and measured move)
Handle Formation: The current consolidation in a descending channel within the handle adds to the potential breakout strength.
Price Action:
A breakout above the $20.31 level would confirm the cup and handle pattern, with the first target around $25.37 and higher targets up to $40.57.
The price could continue to consolidate within the handle for the next couple of weeks before making a decisive move, making now a good time to watch for a breakout.
Risk Management:
A drop below the $18 level would negate the setup, suggesting further consolidation or a potential reversal.
Catalysts:
Watch for upcoming earnings and other news that could act as a catalyst for the breakout.

Russian nuclear warning lifts gold Gold extended gains for a second session, climbing to $2,630 as tensions between Russia and Ukraine reignited demand for safe-haven assets.
Russia unveiled an updated nuclear doctrine Tuesday, paving the way for potential use of atomic weapons, just as Ukraine deployed U.S.-manufactured missiles on Russian soil for the first time since the war began.
Russian Foreign Minister Sergey Lavrov called on the U.S. and its allies to take note of Moscow’s revised nuclear policies.
On the technical front, gold’s recovery may have further room to run, with the 4-hour chart signaling potential upside. However, the Average Directional Index (ADX) suggests trend momentum remains muted. Key resistance levels include $2,639 and the 200-day simple moving average at $2,654.

D - Dominion Energy has solid uptrend to play AI energy boom
Reverse H&S formation might pave way to $70s. Stays comfortably above 200dma with strong uptrend.
Amazon recently signed agreement with Dominion Energy to explore energy opportunities with Modular Nuclear Reactors.
Nuclear names getting boost recently with expected energy demand from AI boom.
