99% of people buying $NVDA don't understand this:🚨99% of people buying NASDAQ:NVDA don't understand this:
NASDAQ:GOOGL : “We’re boosting AI capex by $10B.”
Wall Street: “Cool, that’s like $1B or 0.06 per share for $NVDA.”
So from $170.50 at the time of news to $170.56 right?
No.
NASDAQ:NVDA trades at 98× earnings. So that $0.06? Turns into $6.00
Why?
Because people are expecting that to be happening every single year for 98 years and they're paying All of it Today in Full amount.
So NASDAQ:NVDA will get $1B more per year. But NASDAQ:NVDA price per share already increased by $100B in past 2 days 😂
Then it crashes 40% and everyone is wondering why.
NVDA

Nvidia - This is clearly not the end!📐Nvidia ( NASDAQ:NVDA ) will confirm the breakout:
🔎Analysis summary:
Over the past couple of months, Nvidia managed to rally about +100%, reaching top 1 of total market cap. Most of the time such bullish momentum just continues and new all time highs will follow. But in order for that to happen, Nvidia has to confirm the all time high breakout now.
📝Levels to watch:
$150
🙏🏻#LONGTERMVISION
SwingTraderPhil

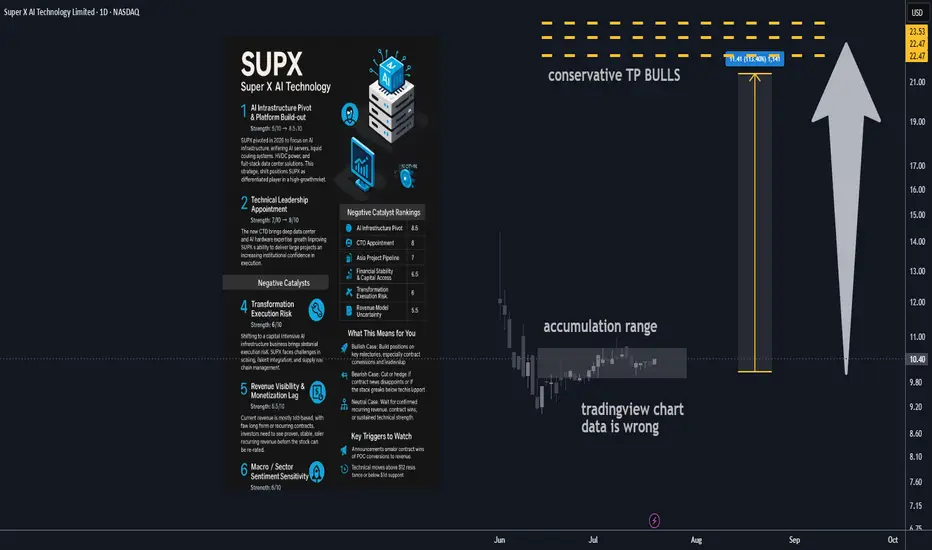
Super X AI Technology Ltd AI Infrastructure Stock 100% upside🔋 1. AI Infrastructure Pivot & Platform Build-out
Strength: 8/10 → 8.5/10
SUPX has made a major pivot in 2025, transitioning from a legacy business into next-gen AI infrastructure. The new focus includes AI servers, liquid cooling systems, HVDC power, and full-stack data center offerings targeting the rapidly growing demand for AI compute in Asia. This shift positions SUPX as a differentiated player in a high-growth market, opening doors to larger contract values and broader verticals.
________________________________________
🤖 2. Technical Leadership Appointment
Strength: 7/10 → 8/10
A major recent step forward is the hiring of a seasoned CTO with deep data center and AI hardware experience. This upgrade significantly enhances SUPX’s execution ability and credibility in enterprise infrastructure. Institutional investors and potential partners will see this as a sign SUPX can deliver on its technical roadmap and close major deals.
________________________________________
📈 3. Asia Institutional Partnerships Pipeline
Strength: 6.5/10 → 7/10
SUPX is developing a solid pipeline of institutional AI infrastructure projects across Asia, especially with established banks and tech companies. While many projects are still in proof-of-concept or pilot stages, these early relationships can drive high-margin, recurring business if successfully converted to long-term contracts.
________________________________________
💰 4. Capital Structure & Financial Health
Strength: 6/10 → 6.5/10
The company’s cash position has improved after new equity raises, giving SUPX a runway for continued R&D and expansion. While the business is still operating at a loss and share dilution remains a factor, debt levels are manageable and financial flexibility should support continued transformation and growth.
________________________________________
________________________________________
⚠️ Negative Catalysts
🛠️ 5. Transformation Execution Risk
Strength: 6/10 → 6/10
Transitioning from a legacy model to a complex, capital-intensive AI infrastructure business brings substantial execution risk. SUPX must navigate operational scale-up, talent integration, and supply chain challenges, with no guarantee of seamless delivery. Any delays or setbacks could erode investor confidence.
________________________________________
🌐 6. Revenue Visibility & Monetization Lag
Strength: 5.5/10 → 5.5/10
Most current revenue is still pilot-based, with few long-term or recurring contracts secured. The business model relies on successful conversion of its pipeline and faster ramp-up in recognized sales. Investors will need to see evidence of stable, recurring revenue before the stock is re-rated.
________________________________________
🔁 7. Macro / Sector Sentiment Sensitivity
Strength: 5/10 → 5/10
As a small-cap AI/infra play, SUPX is highly exposed to swings in broader market sentiment. Any downturn in tech or risk-off moves in global markets could lead to outsized stock volatility, regardless of execution progress.
________________________________________
________________________________________
🚀 Refreshed Catalyst Rankings
Rank Driver Score
1 AI Infrastructure Pivot 8.5
2 CTO Appointment (Execution) 8
3 Asia Project Pipeline 7
4 Financial Stability & Capital Access 6.5
5 Transformation Execution Risk 6
6 Revenue Model Uncertainty 5.5
7 Macro / Sector Volatility 5
________________________________________
📊 Analyst Ratings & Price Outlook
• No major Wall Street coverage; visibility remains driven by news flow and early institutional/retail adoption.
• Technicals: The stock has established higher lows since its business model pivot. Resistance sits near $11.50–12, with support at $9.80–10.00.
• Price target: A $20 target remains plausible if SUPX delivers on growth milestones and secures new capital or contracts, representing a potential doubling from current levels.
________________________________________
🗞️ Recent Developments
• Hired a proven CTO to drive the new AI/data center focus.
• Company rebranded and fully pivoted its business model in 2025, shifting all resources to AI infrastructure.
• Implemented a new equity incentive plan to attract and retain top tech talent.
• Announced a robust pipeline of institutional projects across Asia, although most are not yet recognized as revenue.
________________________________________
🔍 Summary Outlook
SUPX is an emerging transformation play, now fully aligned with surging demand for AI infrastructure. Its success depends on management’s ability to scale, close institutional contracts, and prove out recurring revenue. While the story is compelling and early traction is positive, the company remains high-risk and execution-dependent at this stage.
Bull Case:
If SUPX converts pilots into revenue, delivers operationally, and continues to attract top talent, the stock could re-rate to the $15–20+ range as its business model is validated.
Bear Case:
Stumbles in execution, monetization, or funding could send the stock back to $7–8 support.
Neutral:
Many investors may choose to wait for confirmation of contract wins, recurring revenue, or sustained technical strength before committing.
Technical Levels to Watch:
• Bullish breakout if it clears and holds $11.50–12.00.
• Bearish risk if it fails to hold $9.80–10.00, with possible drop toward $8.
________________________________________
✅ What This Means for You
• Bullish: Build positions into execution milestones, focusing on contract conversions and leadership updates. Upside potential to $20 if catalysts align.
• Bearish: Cut or hedge exposure on failed contract news or technical breakdown.
• Neutral: Stay on the sidelines until more evidence of recurring revenue, confirmed contract wins, or positive sector momentum.
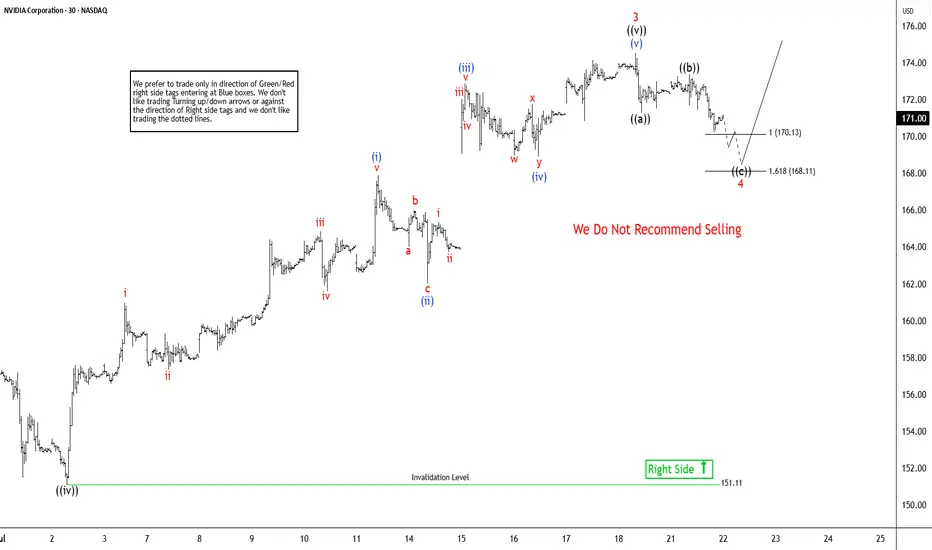
Elliott Wave Sequence In NVDA Suggests Rally From SupportNvidia (NVDA) continues rally to new all-time highs from April-2025 low and reinforcing a robust bullish outlook. In daily, it ended 7 swings pullback at 86.62 low in 4.07.2025 low started from 1.07.2025 high. Above April-2025 low, it confirmed higher high bullish sequence & pullback in 3, 7 or 11 swings should remain supported. Since April-2025 low, it favors rally in (3) of ((1)), while placed (1) at 115.44 high & (2) at 95.04 low in 4.21.2025. Above there, it placed 1 of (3) at 143.84 high, 2 as shallow connector at 132.93 low & 3 at 174.53 high. Wave (3) already extend beyond 2.0 Fibonacci extension of (1) & yet can see more upside. Within 1 of (3), it ended at ((i)) at 111.92 high, ((ii)) at 104.08 low, ((iii)) at 137.40 high, ((iv)) at 127.80 low & ((v)) at 143.84 high. Above 2 low, it placed ((i)) of 3 at 144 high, ((ii)) at 137.88 low, ((iii)) at 159.42 high, ((iv)) at 151.10 low & ((v)) at 174.53 high as 3 of (3).
It already reached the minimum area of 170.04 as inverse extension of connector. But it can see more upside as daily move showing highest momentum from April-2025 low. In 1-hour, above ((iv)) low, it placed (i) of ((v)) at 167.89 high in 5 swings, (ii) at 162.02 low, (iii) at 172.87 high, (iv) at 168.90 low & (v) of ((v)) at 174.53 high ended as 3. Currently, it favors pullback in 4 targeting into 170.13 - 168.11 area before rally in 5 or at least 3 swing bounce. Within 4, it ended ((a)) at 171.26 low, ((b)) at 173.38 high & favors lower in ((c)) of 4. It should find support in extreme area soon to turn higher for two more highs to finish ((1)). The next move in 5 of (3) can extend towards 175.9 or higher, while pullback stays above 168.11 low. The next two highs expect to come with momentum divergence to finish cycle from April-2025 low. Later it should see bigger pullback against April-2025 low in 3, 7 or 11 swings. But if it extends higher & erase momentum divergence, then it can see more upside.
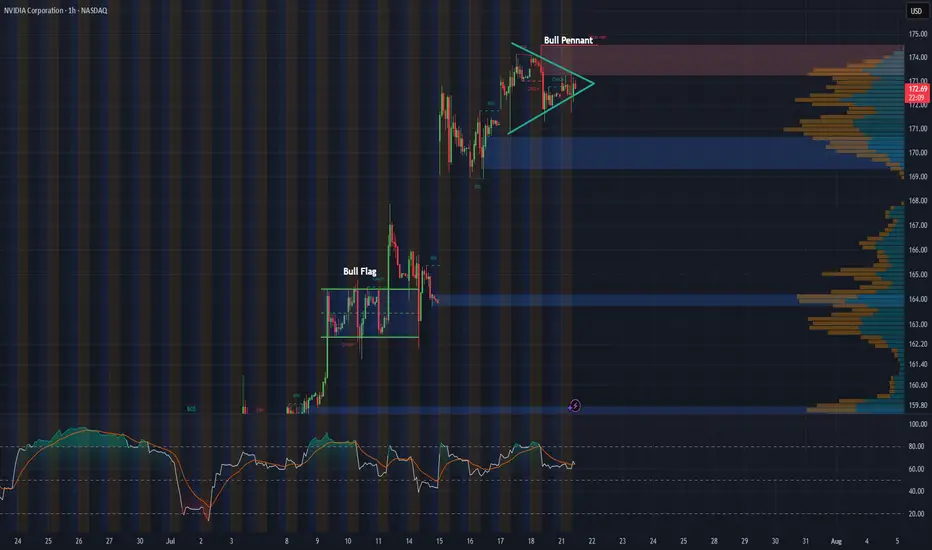
NVDA 1-Hour Chart UpdateHey everyone, just wanted to share a quick update on NVDA’s 1-hour chart. Following last week’s bull flag breakout, the stock appears to be consolidating into what looks like a solid bull pennant formation.
With major tech earnings on the horizon and the recent approval to sell H20 chips to China, this pattern could be setting the stage for another breakout. Will NVDA continue its impressive rally, or is this just a breather before the next move?
$NVDA WEEKLY TRADE IDEA – JULY 21, 2025
💥 NASDAQ:NVDA WEEKLY TRADE IDEA – JULY 21, 2025 💥
🔥 Bullish Options Flow + Weekly RSI Strength = Controlled Momentum Play
⸻
📊 Trade Details
🔹 Type: Long Call
🎯 Strike: $180.00
📆 Expiry: July 25, 2025 (4DTE)
💰 Entry: $0.51
🎯 Target: $1.02 (💯% Gain)
🛑 Stop: $0.20 (~40% Risk)
📈 Confidence: 65%
🕰️ Timing: Monday Open
📦 Size: 1 Contract (Adjust based on risk tolerance)
⸻
📈 Why This Trade?
✅ Call/Put Ratio = 1.48 → Bullish bias confirmed
📈 Weekly RSI = 77.0 → Strong momentum
🔻 Daily RSI = 80.8 (falling) → Short-term pullback risk
📉 Volume = flat (1.0x) → Weak confirmation = tighter risk mgmt
🧠 Strike Clustering: $177.50 & $180 = strong OI zones
🌬️ VIX = 16.7 → Favorable for long premium plays
⸻
⚠️ Risks & Strategy Notes
❗ Daily RSI = caution: short-term exhaustion possible
📉 Weak volume = lack of institutional chase
⏳ Exit before Friday – avoid IV crush and gamma slam
🔐 Set alerts at $178.75 and $179.80 – pre-breakout signals
⸻
🎯 Plan:
• Enter Monday open
• Scale partials if price hits +30–50%
• Full exit by Thursday unless price is breaking through $180 early with strong volume
⸻
🏁 Quick Verdict:
This is a momentum continuation setup, not a fresh breakout.
Play the trend, respect RSI signals, and cut fast if flow dries up.
NASDAQ:NVDA 180C — Risk $0.20 to Target $1.02
Let the call ride… just don’t overstay.
⸻
#NVDA #OptionsTrading #CallOption #WeeklyPlay #MomentumTrade #FlowBasedSetup #TradingViewIdeas #GammaPlay #BullishBias #NVIDIA

$NVDA Tradespoon – Long Entry $172.41Tradespoon model generated long signal for NASDAQ:NVDA . Predicted range: $172.41–$175.21. Trend: +0.65%. NASDAQ:NVDA

US stocks hold near record highs on strong 2Q earnings
Despite elevated valuation pressures, US equities remain near all-time highs. While tariff concerns persist, resilient US economic data continues to support the market's upward momentum.
United Airlines reported a 1.7% YoY increase in 2Q revenue, citing easing geopolitical and macroeconomic uncertainties and a double-digit rebound in corporate demand. Meanwhile, earnings and share performance among mega-cap stocks have also been strong.
Netflix (NFLX) beat market expectations with 2Q revenue of $11.08 billion and EPS of $7.19. At the same time, Nvidia (NVDA) reached a fresh all-time high on renewed optimism over a potential resumption of exports to China.
After testing the support at 6285, US500 rebounded and approached its previous high again. The index holds above EMA21, suggesting the continuation of bullish momentum. If US500 remains above both EMA21 and the support at 6285, the index could breach the 6320 high. Conversely, if the US500 breaks below the support at 6285, the index could retreat further toward 6200.

Stock Market Forecast | TSLA NVDA AAPL AMZN META MSFTStock Market Forecast | CME_MINI:NQ1! CME_MINI:ES1!
Mag 7 Forecast | NASDAQ:TSLA NASDAQ:NVDA AAPL AMZN META MSFT GOOG

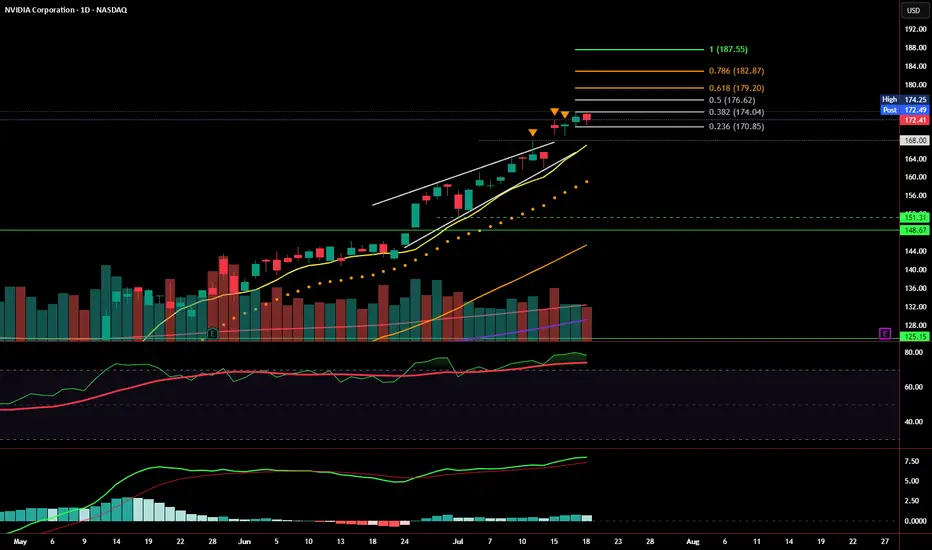
Weekly Close: Still Bullish, But Momentum Is SlowingNVDA closed the week at $172.41, just under short-term resistance and holding well above the prior rising wedge structure. Price action remains technically bullish, with a healthy consolidation forming just below the 0.382 Fibonacci retracement at $174.04.
That said, momentum is beginning to cool, and the next few sessions will be key.
📊 Current Read: Mildly Bullish
Price is holding above key support levels: 9 EMA, $170.85, and prior wedge resistance
No breakdowns — structure remains intact
However, volume is fading, and MACD is flattening, suggesting possible buyer fatigue
RSI remains elevated, not yet signaling reversal, but approaching caution territory
A confirmed breakout above $174.25 sets the stage for Fibonacci targets at:
🔸 $176.62, $179.20, $182.87, and $187.55
A close below $170.85 , and especially $168, would invalidate the current bullish structure and shift bias to bearish — targeting the $151.31–148.67 support zone.
Summary:
📈 Bias: Bullish - but cautious.
Price is consolidating near highs with no signs of breakdown yet. Continuation likely if bulls step in early next week.
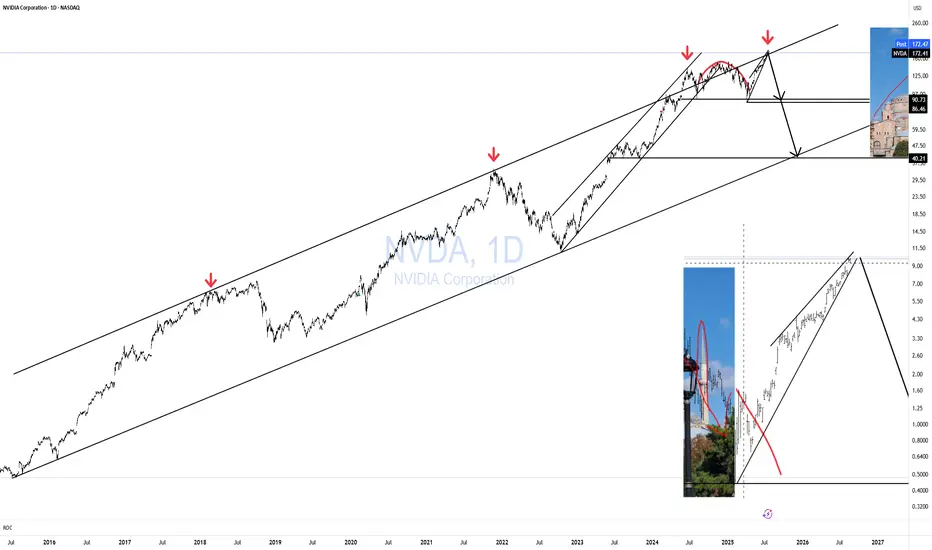
NVDA HAGIA SOPHIA!The Hagia Sophia pattern has now fully formed; it just needs the crack! and the Hook!
No matter what your vague hunches and feelings are about AI, the charts will always win.
You can't "buy the dip" unless you know when to "Sell the Rip"!
If you can't see this resistance area, I don't know what to tell you.
Everyone is bullish at the top of a bubbliotious market without exception!
Click boost, Like, Subscribe! Let's get to 5,000 followers. ))
NVIDIA: Stay heavy on positionsNVDA position size is adjusted in line with US market signals for underweight or overweight allocations. During panic phases, 2x leverage ETFs are on the table
Stay heavy on positions.

NVIDIA Robbery Plan: Bullish Swing Trade to Millions!🔥 NVIDIA (NVDA) Stock Heist Blueprint: Unlock Bullish Profits with Thief Trading Style! 🚀💰
🌟 Greetings, Wealth Warriors! 🌟
Hello, Ciao, Salaam, Bonjour, Hola, and Hallo to all you savvy traders and market masterminds! 🤑💸 Get ready to execute a high-octane trading plan with our Thief Trading Style—a bold fusion of technical precision and fundamental insights designed to crack the NVIDIA (NVDA) stock market vault! 💥📈
📝 The NVIDIA Heist Plan: Swing & Day Trading Mastery 🏆
Based on our proprietary Thief Trading Style, this plan targets NVIDIA (NVDA), currently riding a bullish wave fueled by strong fundamentals and technical setups. Follow the strategy outlined below to navigate the high-risk Red Zone—where overbought conditions, consolidation, and potential trend reversals create opportunities for sharp traders. 💪 Stay alert, as bearish players may set traps at key levels! 🕵️♂️
Entry Strategy: Crack the 🙂Vault! 🏦
Go long with confidence! The market is primed for a bullish breakout. Enter at current prices or set buy limit orders near recent swing lows/highs on the 15-minute or 30-minute timeframe. 📅
Pro Tip: Set price alerts on your chart to catch the optimal entry. Timing is everything in this heist! ⏰
Swing Traders: Look for pullbacks to key support levels for safer entries.
Scalpers: Focus on quick long-side trades with tight stops to maximize gains. 💨
Stop Loss: Protect Your Loot! 🔒
Place your stop loss (SL) below the recent swing low on the 30-minute timeframe (e.g., $162.00 for swing trades).
Adjust your SL based on your risk tolerance, position size, and number of orders. For larger accounts, consider tighter stops to lock in gains early. 🛡️
Scalpers: Use a trailing stop to secure profits while riding short-term momentum.
Take Profit Target: Cash Out Big! 💰
Aim for $191.00 as the primary target, or exit early if momentum slows.
Swing Traders: Hold for the full target if the trend remains strong.
Scalpers: Grab quick profits on smaller price spikes and re-enter on dips.
Pro Move: Use a trailing stop to let profits run while safeguarding gains. 🚀
📌Key Levels & Risk Management
Entry Zone: Market price or swing low – ideal for long positions. 📈
Stop Loss: $162.00 – based on 30m timeframe swing low. 🛑
Take Profit Target: $191.00 – primary target for swing/day trades. 🎯
Risky Red Zone: Overbought levels – watch for consolidation or reversal traps. ⚠️
💡 Why NVIDIA? The Bullish Case 📡
NVIDIA (NVDA) is powering through a bullish phase, driven by:
Fundamentals: Strong demand for AI, gaming, and data center chips. 📊
Macro Factors: Positive market sentiment and tech sector momentum. 🌍
COT Data (Latest Friday Update, UTC+1): Large speculators are increasing bullish positions, signaling confidence in NVDA’s upside (data sourced from reliable platforms). 📅
Geopolitical & News: Monitor upcoming earnings and industry developments for catalysts. 📰
Intermarket Analysis: Tech-heavy indices like the NASDAQ are trending higher, supporting NVDA’s rally. 📈
For a deeper dive, check fundamental reports, COT data, and sentiment analysis to align your trades with the bigger picture. 🔍
⚠️ Trading Alert: Navigate News & Volatility 🗞️
News releases can spark sharp price swings. To protect your capital:
Avoid new trades during major news events (e.g., earnings or Fed announcements). 🚫
Use trailing stops to lock in profits and limit downside risk. 🔐
Stay updated with real-time market developments to adjust your strategy dynamically. 📡
🚀 Boost the Heist! Support the Thief Trading Community 🤝
Love this plan? Hit the Boost Button to amplify our Thief Trading Style and empower our community to conquer the markets! 💥 Every like and share fuels our mission to make money with precision and style. 💪 Join us daily to unlock more high-profit heist plans! 🏴☠️
📌 Important Disclaimer
This analysis is for educational purposes only and not personalized investment advice. Always conduct your own research, assess your risk tolerance, and verify market conditions before trading. Markets move fast—stay sharp and adapt! ⚡
🌟 Stay tuned for the next heist plan, traders! Let’s keep stealing profits together! 🤑🐱👤🎉

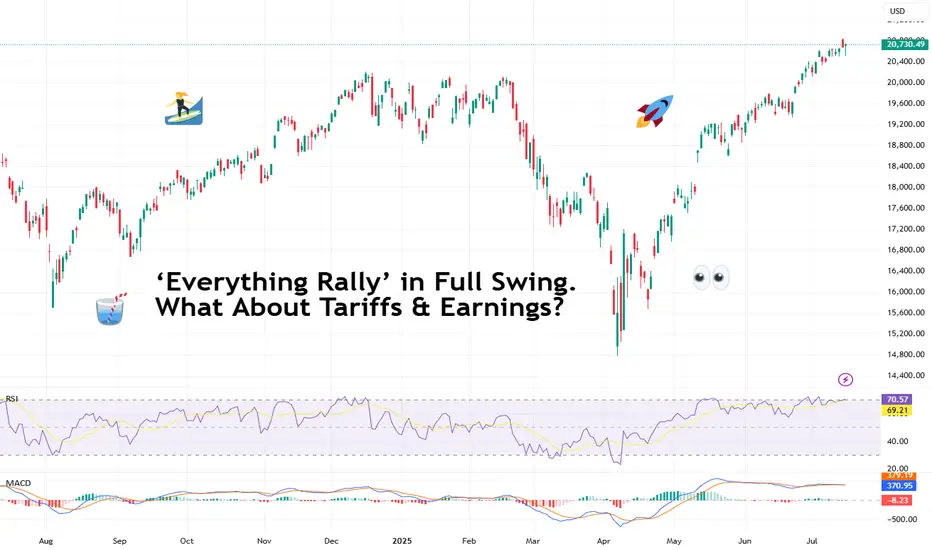
‘Everything Rally’ in Full Swing. What About Tariffs & Earnings?It’s official: we’re witnessing one of those rare, confounding moments when nearly every big risk-on thing is screaming ATH! (All-Time High, for those who haven’t worn out that abbreviation on X this month).
Bitcoin BITSTAMP:BTCUSD blew past $122,000 on Monday — a turbo rally that made anyone who stepped away to brew coffee rethink their life choices.
Meanwhile, Nvidia NASDAQ:NVDA ? It didn’t just approach the $4 trillion milestone — it showed up, took the crown as the world’s most valuable company , and made the Nasdaq Composite NASDAQ:IXIC pop a fresh record close for dessert.
And the S&P 500 SP:SPX ? The broadest slice of US equities did its part too, hitting a record high last week, despite the world’s loudest tariff chatter from Trump 2.0. So, what gives?
💎 Bitcoin: Too Fast to Chart
Let’s start with the fire-breathing dragon. Bitcoin BITSTAMP:BTCUSD rocketed to $122,500 on Monday morning, bruising all those short sellers and juicing up the memes. The OG coin now has a market cap above $2.3 trillion — bigger than most economies, enough to make gold bugs break into cold sweats. (True, it did pare back some of those gains to float at $119,000 Thursday morning.)
What’s fueling it? Institutional FOMO. Forget diamond hands — big money managers, ETF behemoths , and corporates are scooping up every sat they can find.
When you see that, plus macro tailwinds — a weaker dollar, simmering inflation that nudges the Fed toward cuts — the rocket fuel writes itself. But we all know what traders really want to know: is $125,000 next? Short answer: if momentum holds, you bet. Long answer: mind the next Fed move and the tariff chess match.
🎯 Nvidia: From GPUs to GDPs
If you thought Bitcoin’s wild run was the only headline, look again. The real flex this month came from Jensen Huang’s chip juggernaut. Nvidia NASDAQ:NVDA didn’t just break a record — it basically invented a new category for corporate mega-caps.
The world’s biggest semiconductor firm hit the $4 trillion mark — the first company ever to do so. And this isn’t some overnight fad. Back in 2019, Nvidia crossed $100 billion for the first time on the back of crypto mining booms.
Five years later, it’s stacked on 4,000% gains, riding the AI hype like it’s a permanent bull market. Governments, hyperscalers, cloud titans — they’re all shoving billions at Huang’s AI chips.
💻 Nasdaq: AI, Chips, Crypto — Party On
The Nasdaq Composite NASDAQ:IXIC logged yet another record close , up about 7.5% on the year so far.
Just three months ago, this index looked battered — trade war threats, tariff rants, sticky inflation. Who’s doing the heavy lifting? The Magnificent Seven, mostly. But it’s Nvidia’s chart that’s turned this whole index into a de facto AI ETF.
Is it healthy? That depends. As long as earnings season doesn’t break the dream — and there’s no rug-pull from the Fed — traders are letting the momentum do its thing.
🏦 S&P 500: The Record Chaser
What about the S&P 500 SP:SPX — the broadest barometer of America’s corporate muscle? It rose to set its own record high last week before coming down on Friday on renewed tariff jitters.
The Wall Street darling looks less explosive than its tech-packed peer, the Nasdaq. But it’s still up nearly 7% year-to-date — and up 26% from the April dip when tariffs spooked everyone out of their leveraged longs. Now? It’s back in record territory, brushing aside GDP contraction and inflation that won’t quit.
Why? Because the market is forward-looking. Tariffs may sting, but when the Fed hints at cuts and Trump sticks to his MAGA narrative, risk assets catch a bid.
🧨 What About Those Tariffs, Though?
Speaking of tariffs, let’s not pretend they’re not looming. Trump threatened over the weekend to ramp up levies on EU goods to 30% starting August 1 if no new deal emerges. Canada got an earful too: 35% on certain Canadian exports — and Ottawa announced a $21 billion tit-for-tat.
The “pause” on reciprocal tariffs ends in a few weeks. So, is this noise or real risk?
For now, markets are calling the bluff. Investors have tuned out the saber-rattling, choosing to front-run the Fed’s next move instead. If tariffs spark a deeper trade war, stocks may get a reality check. Until then, the melt-up rules.
🔮 What’s Next? Eyes on Earnings
Earnings season is around the corner (be sure to follow the Earnings Calendar ), and you can bet every fund manager is watching Nvidia NASDAQ:NVDA , Microsoft NASDAQ:MSFT , and the rest of the Mag 7 for cracks in the AI gold rush.
If the big names keep printing double-digit revenue growth, investors should be happy. But any hint of deceleration, cautious guidance, or margin pressure could slam the brakes on this record run.
Your turn : Do you see this melt-up stretching into the second half of the year? Or are we due for a rude awakening once the earnings calls roll in? Drop your take below!
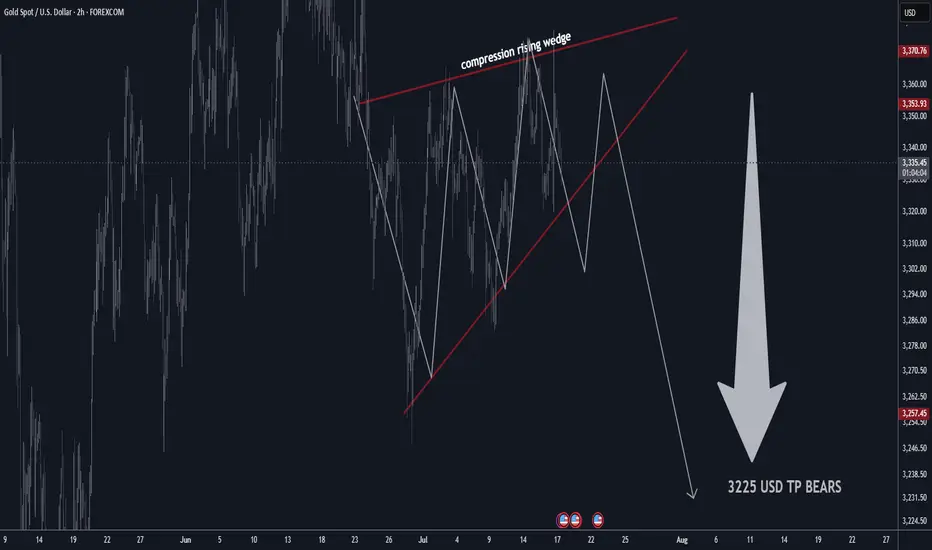
GOLD H2 Rising Wedge Expecting SellOFF TP BEARS 3225 USD📊 Gold Technical Outlook Update – H4 & 2H Chart
📰 Latest Summary Headlines
• Gold stalls near highs as technical compression signals possible breakdown
• Bearish rising wedge on 2-hour chart hints at sharp move lower
• Market volatility stays elevated amid global economic risks
• Short-term sellers targeting $3,225 if wedge pattern breaks
________________________________________
🏆 Market Overview
• Gold remains in a choppy range, struggling to clear key resistance.
• 2H Chart: Bearish rising wedge pattern identified, showing compression—expecting a potential breakdown soon.
• Overhead resistances: $3,410 / $3,460 USD will likely cap further upside.
• Major supports: $3,160 / $3,240 USD.
• If support fails, next key bear target is $3,225 USD.
• Range trading remains favored for now.
• Volatility likely to persist with no major bullish headlines on the horizon.
________________________________________
⭐️ Recommended Trade Strategy
• Bearish Setup (2H): Short sell gold at market on wedge breakdown.
o Stop loss: Above recent highs (set according to your risk tolerance and latest 2H swing high).
o Take profit: Target $3,225 USD.
• Continue to focus on selling near resistance, buying near support.
• Momentum: Watch for sharp moves as wedge resolves—be nimble!
• Always manage risk and adjust stop as price develops.
________________________________________
💡 Gold Market Highlights
• Safe-haven demand still strong due to tariffs, geopolitical tension, and U.S. fiscal concerns.
• Central banks & investors remain net buyers, but jewelry demand slides at high prices.
• Price action is dominated by institutional flows, with banks forecasting potential for gold above $4,000 next year—but short-term correction likely if wedge breaks.
• Current price: ~$3,358 per ounce. Compression suggests a larger move coming soon.
________________________________________
Summary:
Gold is at a crossroads, with a bearish wedge pattern building on the 2-hour chart. A breakdown could see a quick move to $3,225. Short sellers should act on confirmation, while bulls will look to reload at key support. Stay tactical!
NVDA Follow-Up: Breakout Holding, But Still on Thin IceIn yesterday’s post, I highlighted the rising wedge pattern and noted that a breakout above $168 needed strong follow-through to confirm. Today, NVDA managed to hold above that level, closing at $171.37, just beneath the recent high of $172.40.
So far, the breakout attempt is intact — but not yet convincing.
🔹 Volume came in lighter, suggesting buyers aren’t fully committed
🔹 The candle printed a modest gain, but without expanding range or momentum
🔹 Price is still riding above the rising wedge, but hasn’t cleared resistance with authority
As long as NVDA stays above $168, bulls remain in control — but a daily close back below that level would re-enter the wedge and raise the risk of a false breakout, putting $151–148 back on the radar.
Until we see a strong breakout above $172.40 with volume, this remains a cautious breakout, not a confirmed one.

Nvidia (NVDA) Share Price Surges Above $170Nvidia (NVDA) Share Price Surges Above $170
Yesterday, Nvidia’s (NVDA) share price rose by more than 4%, with the following developments:
→ It surpassed the psychological level of $170 per share;
→ Reached another all-time high;
→ Gained more than 9% since the beginning of the month.
The bullish sentiment is driven by Nvidia CEO Jensen Huang’s visit to China shortly after meeting with US President Trump. At the same time:
→ US Secretary of Commerce Howard Lutnick stated that the planned resumption of sales of Nvidia H20 AI chips in China is part of the US negotiations on rare earth metals.
→ The head of Nvidia stated that he was assured licences would be granted very quickly, and that a large number of orders for H20 chip deliveries had already been received from Chinese companies.
Market participants are viewing the situation with strong optimism, and analysts are raising their valuations for NVDA shares:
→ Morningstar analysts raised their fair value estimate for Nvidia shares from $140 to $170.
→ Oppenheimer analysts increased their target price from $170 to $200.
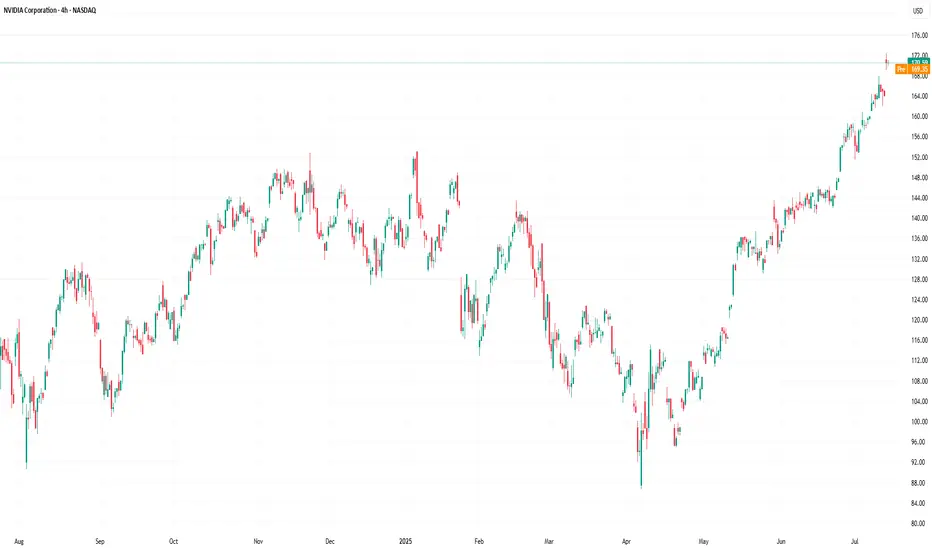
Technical Analysis of the NVDA Chart
The price trajectory of NVDA shares fully reflects the exceptionally strong demand:
→ The price is moving within an ascending channel with a steep growth angle;
→ Since early May, the RSI indicator on the 4-hour chart has not fallen below the 50 level;
→ Yesterday’s trading session opened with a large bullish gap.
The chart also shows the formation of a stable bullish market structure (shown with a purple broken line), expressed through a sequence of higher highs and higher lows.
Given the above, it is difficult to imagine what might cause a sharp shift from positive to negative sentiment. If a correction begins (for example, with a test of the $160 level), traders should watch for signs of its completion — this could present an opportunity to join the emerging rally.
This article represents the opinion of the Companies operating under the FXOpen brand only. It is not to be construed as an offer, solicitation, or recommendation with respect to products and services provided by the Companies operating under the FXOpen brand, nor is it to be considered financial advice.
NVDA Update: Breakout Fading or Wedge Still in Play?In my last post, I highlighted the rising wedge pattern forming at the top of NVDA’s strong rally. Price briefly pushed above the upper wedge resistance and tagged $172.40, but today’s session printed a bearish close at $170.70 — just above the breakout level, but with no real follow-through.
Volume came in higher, but price action failed to extend the breakout, suggesting this could be a stall or even a false breakout in progress. RSI remains overbought, and momentum may be slowing despite the recent push.
If price slips back below $168, we could see the original wedge breakdown scenario come back into play. Watch for support around:
🔹 $151.31–148.67
🔹 Below that: $125 zone
For bulls, continuation above $172.40 with strong volume would invalidate this pattern and confirm breakout strength. Until then, caution is warranted.

NVIDIA -- Major Resistance // Confluence of 3 FactorsHello Traders!
WOW... This chart is quite incredible I must say.
It's amazing how price is currently at an exact point where 2 major trendlines converge which also nearly coincides with the 1.618 Fibonacci extension. Price closed almost to the penny just above the major trendline connecting the prior highs. It will be very interesting to see what price does over the next few days.
What Does These Converging Trendlines Mean?: Think of a trendline like a wall... Depending on how "strong" the trendline is, this wall could be made from wood all the way through to vibranium straight from Captain Americas shield! These two trendlines converging would likely resemble a steel wall and would be extremely hard to penetrate. (Although there are no gurantees in trading)
What To Watch For: I will be watching to see if price can both break and confirm above both resistance trendlines. It will take MEGA buying pressure to accomplish this and would likely mean continuation to the upside. If price cannot break and confirm above then we will likely see a large retrace to support.
Thanks everyone and best of luck on your trading journeys!

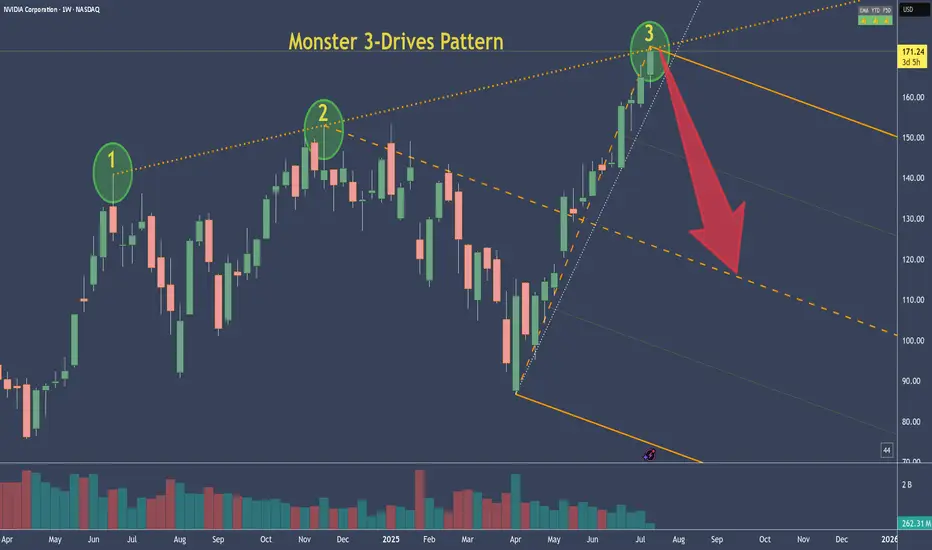
NVDA - NVIDIA's 3-Drive Pattern target if it plays outThis is the weekly chart of NVDA.
We can clearly see a 3-Drives pattern forming.
If this pattern plays out, the centerline would be my target. Of course, it's still too early to short.
But I’ve got my hunting hat on and I'm watching for signals on the daily chart.
One would be a break of the slanted trendline—but there are a couple of other conditions that need to align as well.
Always ask yourself: What if?
How expensive is Nvidia today?How expensive is NASDAQ:NVDA today?
❗ You're paying $40 today for $1 of next year's earnings
That's what Nvidia's forward P/E 40x means at current $172 per share
AI might be the future but you're prepaying for it like it's 2060 🤖

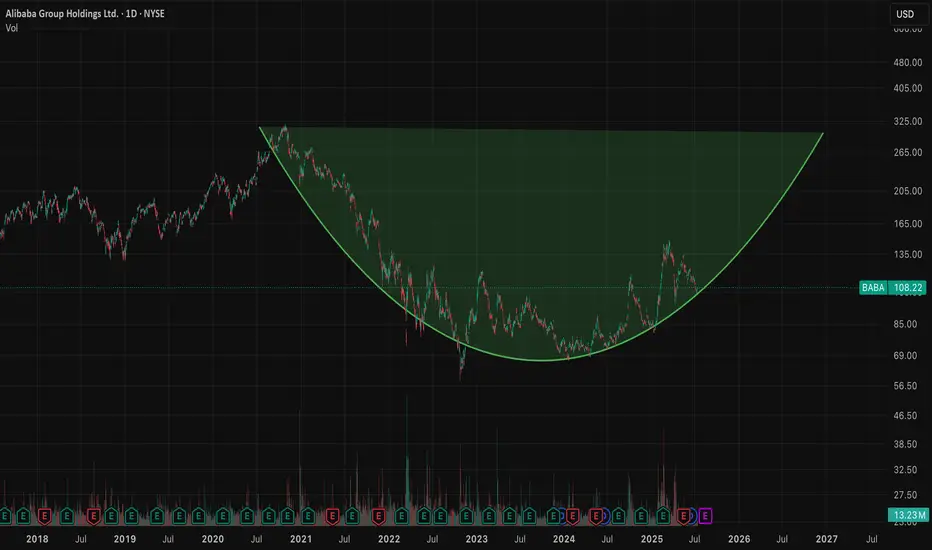
$BABA 160+ before year end looks realistic thanks $NVDA- NASDAQ:NVDA export ban lifted for China will be beneficial for NASDAQ:NVDA for sure but main advantages would be for NYSE:BABA as they can get the shovels from the shop as well so that they can compete in Gold Rush and compete with NASDAQ:GOOGL , NASDAQ:META and other private companies like Open AI and Anthropic.
- There are good universities in China and NYSE:BABA is regional big tech in China which gets great talent. I'm confident that NYSE:BABA would be able to compete with NASDAQ:META & NASDAQ:GOOGL in building LLMs even better with this export ban lift.
- Long NYSE:BABA and short/avoid NASDAQ:META ( overvalued )
Nvidia (NVDA) 2025+ Catalysts & Risks: Analyst Views🚀 Nvidia (NVDA) 2025+ Catalysts & Risks: Analyst Views
🔑 Key Catalysts Driving Nvidia’s Stock Growth (2025+)
1. 🏆 AI Chip Dominance
Nvidia maintains >90% market share in data-center AI chips (Blackwell, Hopper, Rubin). Its CUDA ecosystem and relentless innovation keep it as the “default” supplier for advanced AI, giving NVDA massive pricing power.
2. 🏗️ Surging Data Center Demand
Cloud and enterprise AI spending remains white-hot. Tech giants (Meta, Microsoft, Amazon, Google) are collectively pouring $300B+ into 2025 AI CapEx. Data center revenues are at all-time highs; analysts expect this uptrend to extend through 2026 as “AI infrastructure arms race” persists.
3. 🌐 Mainstream AI Adoption
AI is now integrated in nearly every industry—healthcare, finance, logistics, manufacturing, retail. As companies embed AI at scale, NVDA’s hardware/software sales rise, with “AI everywhere” tailwinds supporting 15–25% annual growth.
4. 🤝 Strategic Partnerships
Big wins: Deals with Snowflake, ServiceNow, and massive sovereign/international AI collaborations (e.g., $B+ Saudi Arabia/“Humain” order for Blackwell superchips; UAE, India, and Southeast Asia ramping up AI infrastructure using Nvidia).
5. 🚗 Automotive/Autonomous Vehicles
NVDA’s automotive AI segment is now its fastest-growing “new” business line, powering next-gen vehicles (Jaguar Land Rover, Mercedes, BYD, NIO, Lucid) and expected to surpass $1B+ annual run rate by late 2025.
6. 🧑💻 Expanding Software Ecosystem
Nvidia’s “full stack” software (CUDA, AI Enterprise, DGX Cloud) is now a sticky, recurring-revenue engine. Over 4M devs are building on Nvidia’s AI SDKs. Enterprise AI subscriptions add high-margin growth on top of hardware.
7. 🌎 Omniverse & Digital Twins
Industrial metaverse and simulation/digital twin momentum is building (major partnerships with Ansys, Siemens, SAP, Schneider Electric). Omniverse becoming the industry standard for 3D AI/simulation, unlocking new GPU/software demand.
8. 🛠️ Relentless Innovation
Blackwell Ultra GPUs debuting in late 2025, “Rubin” architecture in 2026. Fast-paced, aggressive product roadmap sustains Nvidia’s tech lead and triggers constant upgrade cycles for data centers and cloud providers.
9. 📦 Full-Stack Platform Expansion
Grace CPUs, BlueField DPUs, and Spectrum-X networking mean Nvidia is now a “one-stop shop” for AI infrastructure—capturing more value per system and displacing legacy CPU/network vendors.
10. 🌏 Global AI Infrastructure Buildout
Recent US export rule rollbacks are a huge tailwind, opening up new high-volume markets (Middle East, India, LatAm). Nvidia remains the “go-to” AI chip supplier for sovereign and enterprise supercomputers outside the US, supporting continued global growth.
________________________________________
📈 Latest Analyst Recommendations (July 2025)
•Street Consensus: Overwhelmingly bullish—~85% of analysts rate NVDA as “Buy/Overweight” (rest “Hold”), with target prices often in the $140–$165 range (post-split, as applicable).
•Target Price Range: Median 12-month PT: $150–$160 (representing ~20% upside from July 2025 levels).
•Key Bullish Arguments: Unmatched AI chip lead, accelerating enterprise AI adoption, deep software moat, and a robust international/sovereign AI order pipeline.
•Cautious/Bearish Notes: Valuation premium (45–50x P/E), high expectations priced in, geopolitical and supply chain risks.
________________________________________
⚠️ Key Negative Drivers & Risks
1. 🇨🇳 US–China Tech War / Chip Export Restrictions
• US restrictions: While the Biden administration eased some export bans in May 2025 (allowing more AI chip exports to Gulf/Asia partners), China remains subject to severe curbs on advanced NVDA AI chips.
• Workarounds: Nvidia is selling modified “China-compliant” chips (H20, L20, A800/H800), but at lower margins and lower performance.
• Risk: If US tightens controls again (post-election), China sales could fall further. Chinese firms (Huawei, SMIC, Biren) are also racing to build their own AI chips—posing long-term competitive risk.
2. 🏛️ Political/Regulatory Risk
• Election year: A US policy shift (e.g., harder tech stance after Nov 2025 election) could re-restrict exports, limit new markets, or disrupt supply chains (especially TSMC foundry reliance).
3. 🏷️ Valuation Risk
• NVDA trades at a substantial premium to tech/semiconductor peers (45–50x fwd earnings). Any AI “spending pause” or earnings miss could trigger sharp volatility.
4. 🏭 Supply Chain & Capacity Constraints
• As AI chip demand soars, there’s ongoing risk of supply/delivery bottlenecks (memory, HBM, advanced packaging), which could cap near-term revenue upside.
5. 🏁 Competitive Threats
• AMD, Intel, and custom in-house AI chips (by Google, Amazon, Microsoft, Tesla, etc.) are scaling up fast. Loss of a hyperscaler account or a successful open-source software alternative (vs CUDA) could erode Nvidia’s dominance.
6. 💵 Customer Concentration
• A small handful of cloud giants account for >35% of revenue. Delays or pullbacks in their AI spending would materially impact results.
________________________________________
📝 Summary Outlook (July 2025):
Nvidia’s AI chip monopoly, software moat, and global AI arms race create a powerful multi-year growth setup, but the stock’s high valuation and US-China chip tension are real risks. Analyst consensus remains strongly positive, with most seeing more upside as data-center and enterprise AI demand persists—but with increased focus on geopolitical headlines and potential supply chain hiccups.
________________________________________
