Finally happened. Semi’s getting creamed. Semiconductors and all the trappings are finally falling. The bubble has popped for the near term at least.
LONG 3 days ago
AMEX:SOXS is saving my portfolio🙏🏼👍
I’m using a 30 min chart with 10,50,200 sma’s. When the S&P drops below the 50 sma its time to short.
NASDAQ:NVDA was range bound and had dropped below 50sma. Time to short. But NASDAQ:NVDA was leading the way to a reset for all the other Semi underlings.
AMEX:SOXS the answer!!!!
NVDA
NVIDIA The chance to buy for $230 is NOWNVIDIA is forming a Double Bottom on a 1day RSI bullish divergence, same kind it did on the October 31st 2023 low.
The prevailing pattern is a Channel Up and the double bottom could technically kick start the new bullish wave.
The last one almost reached the 5.0 Fibonacci extension before pulling back under the 1day MA50.
Best opportunity to buy in 2025. Target just under the 5.0 Fib at $230.
Follow us, like the idea and leave a comment below!!
$NVDA and NVDA Dominance Fib retracement levelsNASDAQ:NVDA is now already in bear market territory and the next question when this slide in the stock price will stop. Today in our Daily dose of Chart we are looking into NVDA Feb retracement levels in the upward sloping channels and the NVDA Dominance in NASDAQ.
If we plot the upward sloping Fib retracement channel joining the top candles weekly chart within the upward sloping channel and then plot the Fib levels to the lowest levels of 2023 and 2024 then we see that the current price is at the 3.618 Fib level which is at 104 $. The next level is 4.236 and that level lies at approx. 95 USD. So if the sell of continues then the next price target is 95 USD.
In this blog space we have floated the idea of NVDA Dominance ($NVDA.D) which is just the ratio of NASDAQ:NVDA vs NASDAQ QQQ. The dark green line in the chart signifies the NVDA Dominance and it is currently well of its highs. If we simply plot the Fib retracement on the Dominance Line, then we see the next support is @618 which will give us a price of 99 $ on the NASDAQ:NVDA stock. So that means technical speaking we have great support and price memory between 95 $ - 99 $.
Verdict : Accumulate NASDAQ:NVDA here and go extra-long @ 95-99 $
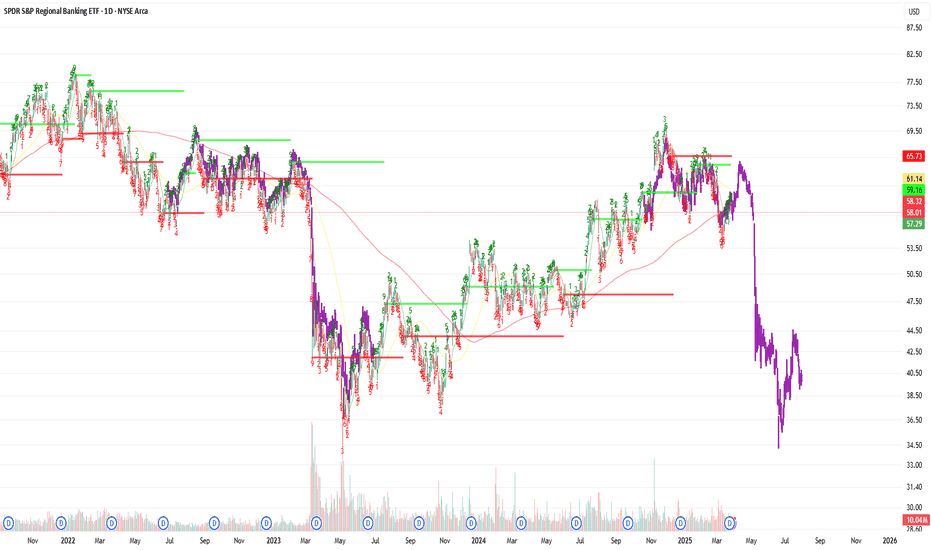
$KRE CRASH COMING ... Not yet tho..we'll find out..Regional Banks seem to be heading on a slippery path identical to the most previous crash pattern back when they needed all the loan Bailouts. Now that all the loans have stopped, I'm sure some banks may be heading towards loan restructuring perhaps, maybe defaults, I'm not sure honestly. I just know that the chart never lies and I've been watching and waiting for a long while. I predicted the first crash back then and I currently have no doubts with the current chart ahead of me. As always, I will do my best to provide the best insight possible into these speculations. Currently we have the Daily breaking trend and the bar count getting close to the previous 141 bars. The only difference is that we bounce off the 100% retracement. If we continue to lose the 1.27, we'll be headed for the 1.61..... updates soon.
NVDA 2 The????NASDAQ:NVDA
Outlook - -GEX and -DEX but +OI This week. NASDAQ:NVDA ’s price action will likely hinge on broader
market sentiment rather than company-specific releases, given no major NVIDIA events are slated.
Weekly -- 2nd consecutive down week with increasing volume
Daily -- Downtrend to next HVL under 106 possible
Hourly -- Consolidating at support zone
10m -- Consolidating
Bias -Monitoring U.S. trade policy updates and technical levels for short-term direction.
Volatility remains high, so caution is warranted.
Pivot - 109.65
Upside Targets:
* 111.47--112.91--113.66--115.01
Downside Targets:
* 109.62--108.45--105.05--104.34
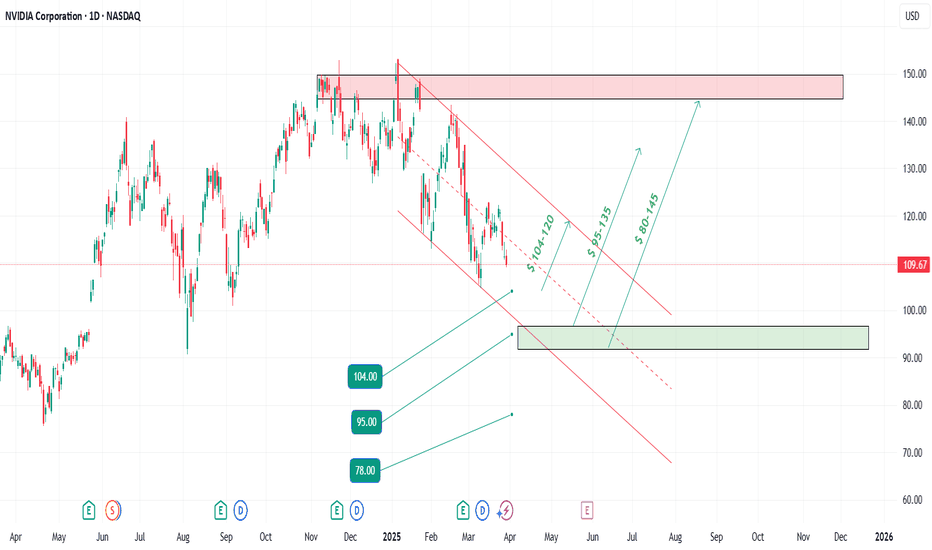
NVDA Trade Setup: Catch the Next Wave Before It BreaksAfter a healthy pullback, NVDA is setting the stage for what could be a powerful rebound—and savvy traders know this is when opportunity knocks.
We’ve identified three key entry points where the risk-reward setup becomes especially attractive:
🔹 104 – A potential bounce zone where early buyers might step in.
🔹 95 – A deeper level with stronger support, ideal for scaling in.
🔹 80 – A high-conviction level where long-term bulls may load up for the ride.
On the upside, here are three profit targets worth watching:
✅ 120 – First take-profit zone, a logical exit as momentum begins to return.
✅ 135 – Mid-level resistance where partial profits can lock in gains.
✅ 145+ – A stretch target for those riding the full recovery wave.
This strategy allows for smart layering of entries and profits, giving flexibility whether the bounce is quick or more gradual. Always stay alert to price action confirmation and use stops that align with your risk tolerance.
Disclaimer: This analysis is for informational purposes only and does not constitute investment advice. Trading in financial markets involves risk, and you should conduct your own research or consult a licensed financial advisor before making any investment decisions.
NVDA NVIDIA Price Target by Year-EndNVIDIA Corporation (NVDA) remains a dominant force in the AI and semiconductor markets, with its forward price-to-earnings (P/E) ratio currently at 19.37—a reasonable valuation considering its growth trajectory and market position.
NVIDIA’s leadership in the AI sector, particularly through its cutting-edge GPUs, has driven strong demand from data centers, cloud providers, and AI developers. The company’s recent product launches, including the Hopper and Blackwell architectures, have further solidified its competitive edge.
Despite recent market volatility, NVIDIA's consistent revenue growth and expanding profit margins support the bullish case. The current P/E of 19.37 reflects a balanced risk-reward profile, suggesting that the stock is not overvalued despite its impressive performance.
A price target of $145 by year-end reflects approximately 15% upside from current levels, driven by sustained AI demand and growing market penetration. Investors should watch for quarterly earnings reports and updates on AI chip demand, as these will likely act as key catalysts for upward momentum.
Nvidia (NVDA) Share Price Continues Bearish TrendNvidia (NVDA) Share Price Continues Bearish Trend
Earlier this month, our analysis of NVDA's share price led us to:
→ Establish a downward channel (marked in red).
→ Suggest that the lower boundary could act as support, which was confirmed (circled).
On 13 March, we anticipated the median line of this channel might serve as resistance, and yesterday’s ~5% drop in NVDA’s share price (marked by a red arrow) aligns with this scenario.
As a result, NVDA’s price has declined by approximately 17% since the start of 2025, despite being a market leader in 2024.
Why Did Nvidia (NVDA) Shares Drop Yesterday?
Market sentiment turned negative amid concerns that the Trump administration may soon impose previously delayed international trade tariffs.
Additionally, the Financial Times reported that Chinese regulators are encouraging firms to adopt data centre chips that meet stringent environmental standards. This raises concerns that Nvidia’s H20 chip, despite complying with U.S. export controls, may not meet China’s environmental regulations. Investors seemingly viewed this as a bearish signal for Nvidia’s future sales in China.
Technical Analysis of Nvidia’s Share Price
Currently, NVDA’s price is encountering resistance at the bullish gap formed on 12 March, around $112.50.
Given the broader market context, this setup could indicate an attempt by bears to resume the downtrend after a temporary rebound from oversold conditions. A consolidation pattern in the form of a narrowing triangle (marked in red) has also emerged.
If market conditions remain challenging, bears may push NVDA’s price towards the psychologically significant $100 level.
This article represents the opinion of the Companies operating under the FXOpen brand only. It is not to be construed as an offer, solicitation, or recommendation with respect to products and services provided by the Companies operating under the FXOpen brand, nor is it to be considered financial advice.
$KRE REGIONAL BANK Crash? Identical Setup to March 23'Identical Setup to 23' Regional Bank Crash. As always, not sure what the trigger will be, but I will do my best to keep everyone updated as usual. Target of $58 from $60s reached. I'll be expecting a bit more come June. Watch for the sideways movement and rally until then.
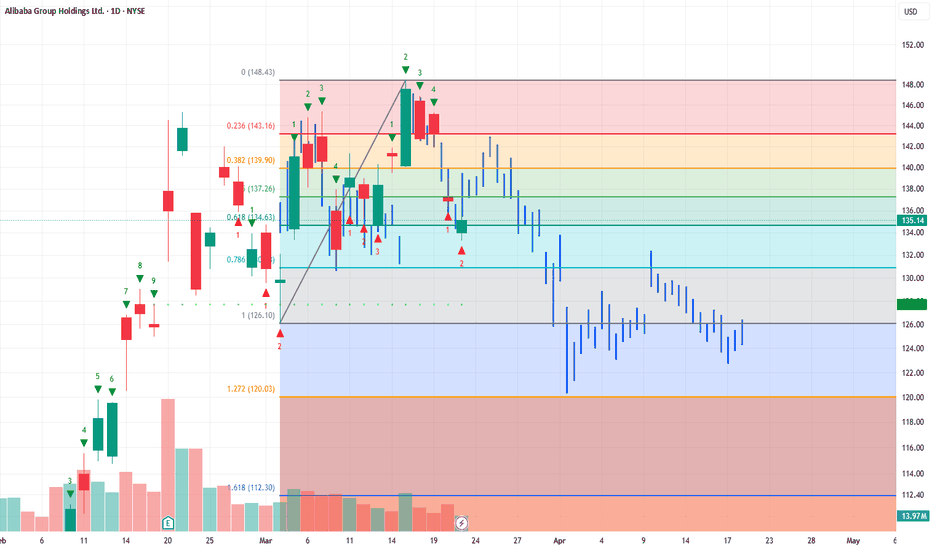
$BABA on its way to $120s into AprilI would honestly be surprised if it doesnt gap down this Monday before the open. The weekly imo, looks like a mess atm and could gap into $120s easy. If it doesn't, I would expect some consolidation for a fall into the First week of April. We're right at the golden pocket retrace at the .618, very common retracement level, if we look at Fibs with a bearish perspective and measure a retrace back to the lower golden pocket at 1.61 fib from highs, $112.30 would be my ultimate target if we can break $126. $126 opens the flood gates to our ultimate target at $112.
$NVDA H&S on Monthly...Linking previous short of NVDA. The right shoulder is technically not finished forming. However that trendline was tested not long ago.... will it hold? Who knows.
First target would be ~$100. If this plays out there will likely be a larger mark down phase consisting of retail panic selling. This will push toward $80 with a possible shakeout near the low/mid $70s before a long term accumulation process begins by big money.
Just because I am short on the stock does not mean I don't believe in the company or stock longer term. Have money on the sidelines to buy incase this plays out.
Can RGTI go for a new ATH?The stock reclaimed the IPO VWAP (purple line) every time sellers tried to press the stock, signaling strong buyer interest and establishing a new base. The ATH VWAP (black line) remains overhead, but immediate resistance is now at $11.95.
A clean break above $12 could ignite a momentum squeeze, with minor resistance at $12.97 before a potential run toward $15. The stock’s resilience above IPO VWAP suggests bullish control; watch for volume confirmation on a move through $12.
A Stop Loss level is set at $10.33.
With the NVDA event, the news can quickly become highly volatile, so it’s advisable to trade with caution.
Microsoft (MSFT): The "Can’t Go Wrong" Stock... Until It DoesAh, Microsoft—the tech titan that could probably survive a meteor impact. 🌍☄️ With a market cap so large it could buy entire countries and still have spare change for a few yachts, MSFT is the stock that everyone loves... even when it’s overvalued. But hey, let’s take a look at the "genius" behind the current price action. 🔍💰
📊 The Almighty Stock Performance (Because Fundamentals Don’t Matter Anymore?)
📉 Price: $385.76 (up a whole 0.00584%! Call the champagne guy! 🍾)
📊 Intraday High: $387.88
📉 Intraday Low: $383.27 (because even Microsoft has bad days, right? 😅)
🔮 200-day moving average: $423.98 (oh look, it's trading below that... bearish much? 🐻)
So, let me get this straight. MSFT is 7.80% down year-to-date, but analysts are still screaming “BUY! 🚀.” Sure, because blindly trusting price targets has always worked out well for retail investors. 🤑
💰 Valuation: Overpriced? Who Cares, It’s Microsoft!
📢 Intrinsic Value Estimate: $316.34
😬 Current Price: $385.76
💰 Overvaluation? About 18%
But let’s be honest—does valuation even matter anymore? If people are throwing money at meme coins, why not pay a premium for MSFT? 🤷♂️ It’s basically a subscription service at this point—you pay every month, and the stock just keeps draining your wallet. 💸
🤖 AI Goldmine or Just Another Buzzword?
Microsoft has been riding the AI hype train harder than a teenager with ChatGPT. 🚂💨 Their enterprise AI growth is over 100%, and they’re pulling in a $13 billion annual run rate from AI services. But sure, let’s pretend that no one remembers the last time “the next big thing” crashed and burned. (cough dot-com bubble cough). 💀💾
Evercore analysts claim MSFT will dominate AI for enterprises. Well, duh. If you’re an enterprise and don’t buy Microsoft AI services, Satya Nadella himself might show up at your office and force you to install Windows 11. 🏢💻
📉 Risk Factors? No Way! MSFT is Invincible... Right?
🦅 Hawkish Fed = Potential Market Sell-Off (But don’t worry, just HODL, right? 🤡)
🚀 Tech Bubble Concerns (Microsoft will totally be the exception… like every overhyped stock before it. 😬)
🧐 Overvaluation? Pfft, who cares? (People said the same about Tesla at $400. Look how that turned out. 🪦)
📢 Analyst Hot Takes (Because They’re Always Right 😂)
📊 D.A. Davidson: Upgraded to Buy with a price target of $450. (Ah yes, let’s just throw numbers out there. Why not $500? $600? 🚀)
🔮 UBS: Predicts $3,200 for gold, but Microsoft will somehow go even higher. (Probably. Because… reasons. 🤷♂️)
🎭 Final Thoughts: Buy? Sell? Just Panic?
Microsoft is basically the “safe” tech stock everyone clings to while pretending that the market isn’t built on dreams and overleveraged hedge funds. 🏦💰 If you believe in the power of monopolies, overpriced AI services, and analysts pulling price targets out of thin air, then MSFT is your golden ticket. 🎟️💎
Otherwise, maybe—just maybe—waiting for a dip below fair value isn’t the worst idea in the world. But what do I know? I’m just some guy on the internet. 🤷♂️
🚀💸 Good luck, traders. You’ll need it. 😈📉
💬 What do you think? Drop your thoughts below! 👇🔥
BUBBLE RUN of global marketsTheory! I just like to visualize similar global market events.
NASDAQ:NVDA now vs. Cisco from 1991-2002 — it looks almost identical.
The years 2026-27 could mark the final stage of the current “bubble run”:
> an enormous number of crypto ETFs (even for worthless shitcoins)
> overleveraged funds, from small players to industry leaders
> AI projects with minimal revenue but insanely high infrastructure costs
> soaring Gold prices alongside a decade-long decline in the U.S. manufacturing index, all while the stock market remains expensive
> OpenAI, crypto exchanges, and AI companies with no real revenue planning IPOs in 2026+
I believe we are currently in a Bubble Run!
This could be great for Bitcoin, because historically, Gold (over the past 100 years) has reached all-time highs during the final phase of a stock market bubble and continued rising until the market’s final dip. Then, smart money starts a new bull cycle — selling gold to buy cheap stocks.
10D Chart shows Falling 3 , Pullback to 3/18!! $SPYAMEX:SPY shows 10D trend very clear. It is my hidden gem. We, by my charting, Should pullback until 3/18 ... not sure how far but I have plenty of targets on the way down to my ultimate target at 5200... I think we could flush to $560.. Good Luck yall. Gems I tell ya... sorry I'm so bad at explaining things..
$QQQ Dead Cat to 10 WMA, then lower. Buy $496, Sell $514 What I see here is a double top on the weekly just like 2022. I can see our last 9 count in 2022 produced a 30% rally to the top. After the rally several months of sideways movement until we break trend. If we are Indeed Repeating the 2022 TOP. Then we have a harsh year ahead of us. As I said in previous posts, we should close February at the low of January. I have KRE falling out next week so I'm skeptical about what's going on. We've got DOGE checks and what not, who knows. I'm extremely bearish and I do believe we will bounce into a rejection this next week, then fall even further the week of 3/14. I will update day by day. For now, $496 will be my Buy. and $514 will be the Sell. Take Care Yall.


