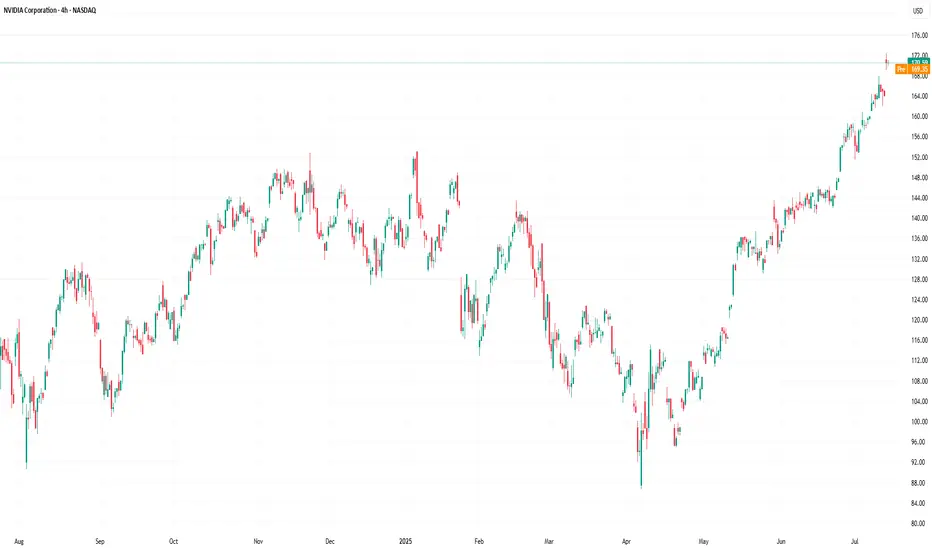
NVDA Follow-Up: Breakout Holding, But Still on Thin IceIn yesterday’s post, I highlighted the rising wedge pattern and noted that a breakout above $168 needed strong follow-through to confirm. Today, NVDA managed to hold above that level, closing at $171.37, just beneath the recent high of $172.40.
So far, the breakout attempt is intact — but not yet convincing.
🔹 Volume came in lighter, suggesting buyers aren’t fully committed
🔹 The candle printed a modest gain, but without expanding range or momentum
🔹 Price is still riding above the rising wedge, but hasn’t cleared resistance with authority
As long as NVDA stays above $168, bulls remain in control — but a daily close back below that level would re-enter the wedge and raise the risk of a false breakout, putting $151–148 back on the radar.
Until we see a strong breakout above $172.40 with volume, this remains a cautious breakout, not a confirmed one.
NVDA

Nvidia (NVDA) Share Price Surges Above $170Nvidia (NVDA) Share Price Surges Above $170
Yesterday, Nvidia’s (NVDA) share price rose by more than 4%, with the following developments:
→ It surpassed the psychological level of $170 per share;
→ Reached another all-time high;
→ Gained more than 9% since the beginning of the month.
The bullish sentiment is driven by Nvidia CEO Jensen Huang’s visit to China shortly after meeting with US President Trump. At the same time:
→ US Secretary of Commerce Howard Lutnick stated that the planned resumption of sales of Nvidia H20 AI chips in China is part of the US negotiations on rare earth metals.
→ The head of Nvidia stated that he was assured licences would be granted very quickly, and that a large number of orders for H20 chip deliveries had already been received from Chinese companies.
Market participants are viewing the situation with strong optimism, and analysts are raising their valuations for NVDA shares:
→ Morningstar analysts raised their fair value estimate for Nvidia shares from $140 to $170.
→ Oppenheimer analysts increased their target price from $170 to $200.
Technical Analysis of the NVDA Chart
The price trajectory of NVDA shares fully reflects the exceptionally strong demand:
→ The price is moving within an ascending channel with a steep growth angle;
→ Since early May, the RSI indicator on the 4-hour chart has not fallen below the 50 level;
→ Yesterday’s trading session opened with a large bullish gap.
The chart also shows the formation of a stable bullish market structure (shown with a purple broken line), expressed through a sequence of higher highs and higher lows.
Given the above, it is difficult to imagine what might cause a sharp shift from positive to negative sentiment. If a correction begins (for example, with a test of the $160 level), traders should watch for signs of its completion — this could present an opportunity to join the emerging rally.
This article represents the opinion of the Companies operating under the FXOpen brand only. It is not to be construed as an offer, solicitation, or recommendation with respect to products and services provided by the Companies operating under the FXOpen brand, nor is it to be considered financial advice.
NVDA Update: Breakout Fading or Wedge Still in Play?In my last post, I highlighted the rising wedge pattern forming at the top of NVDA’s strong rally. Price briefly pushed above the upper wedge resistance and tagged $172.40, but today’s session printed a bearish close at $170.70 — just above the breakout level, but with no real follow-through.
Volume came in higher, but price action failed to extend the breakout, suggesting this could be a stall or even a false breakout in progress. RSI remains overbought, and momentum may be slowing despite the recent push.
If price slips back below $168, we could see the original wedge breakdown scenario come back into play. Watch for support around:
🔹 $151.31–148.67
🔹 Below that: $125 zone
For bulls, continuation above $172.40 with strong volume would invalidate this pattern and confirm breakout strength. Until then, caution is warranted.

NVIDIA -- Major Resistance // Confluence of 3 FactorsHello Traders!
WOW... This chart is quite incredible I must say.
It's amazing how price is currently at an exact point where 2 major trendlines converge which also nearly coincides with the 1.618 Fibonacci extension. Price closed almost to the penny just above the major trendline connecting the prior highs. It will be very interesting to see what price does over the next few days.
What Does These Converging Trendlines Mean?: Think of a trendline like a wall... Depending on how "strong" the trendline is, this wall could be made from wood all the way through to vibranium straight from Captain Americas shield! These two trendlines converging would likely resemble a steel wall and would be extremely hard to penetrate. (Although there are no gurantees in trading)
What To Watch For: I will be watching to see if price can both break and confirm above both resistance trendlines. It will take MEGA buying pressure to accomplish this and would likely mean continuation to the upside. If price cannot break and confirm above then we will likely see a large retrace to support.
Thanks everyone and best of luck on your trading journeys!

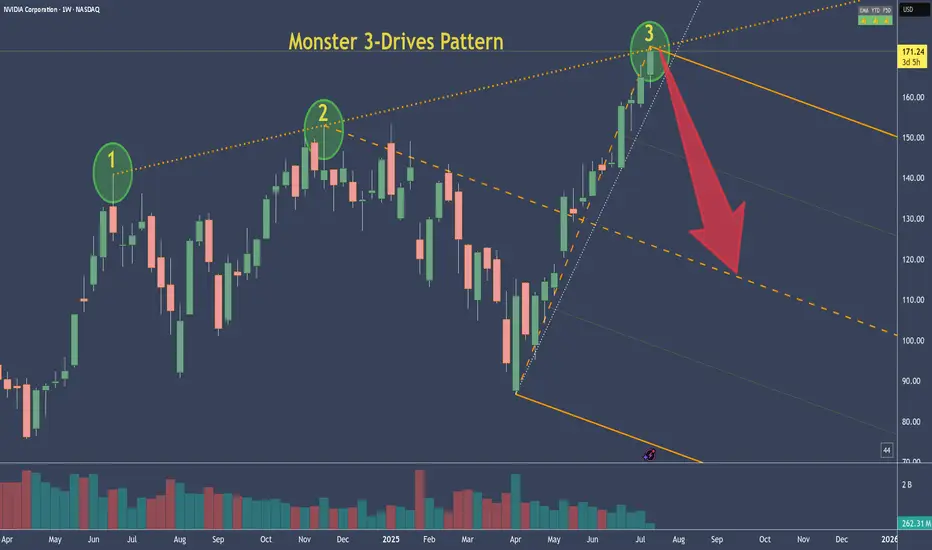
NVDA - NVIDIA's 3-Drive Pattern target if it plays outThis is the weekly chart of NVDA.
We can clearly see a 3-Drives pattern forming.
If this pattern plays out, the centerline would be my target. Of course, it's still too early to short.
But I’ve got my hunting hat on and I'm watching for signals on the daily chart.
One would be a break of the slanted trendline—but there are a couple of other conditions that need to align as well.
Always ask yourself: What if?
How expensive is Nvidia today?How expensive is NASDAQ:NVDA today?
❗ You're paying $40 today for $1 of next year's earnings
That's what Nvidia's forward P/E 40x means at current $172 per share
AI might be the future but you're prepaying for it like it's 2060 🤖

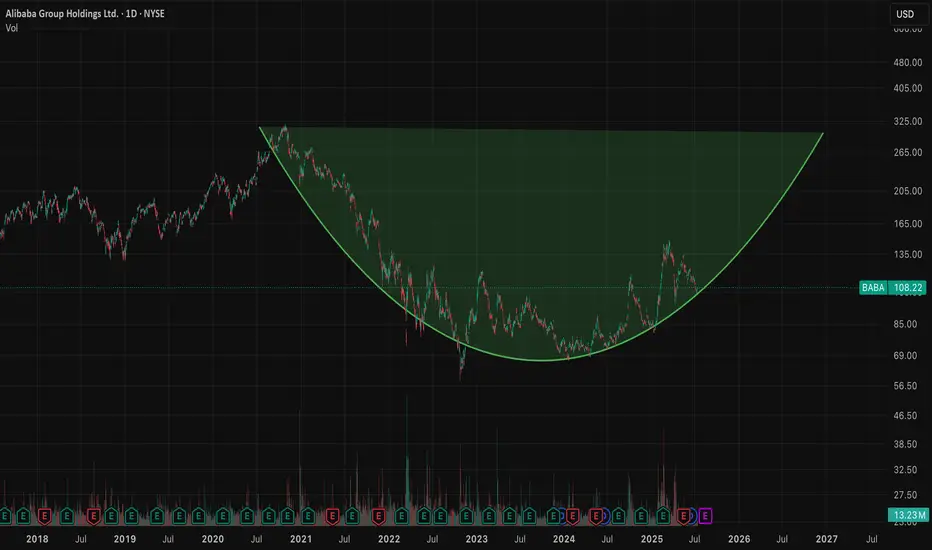
$BABA 160+ before year end looks realistic thanks $NVDA- NASDAQ:NVDA export ban lifted for China will be beneficial for NASDAQ:NVDA for sure but main advantages would be for NYSE:BABA as they can get the shovels from the shop as well so that they can compete in Gold Rush and compete with NASDAQ:GOOGL , NASDAQ:META and other private companies like Open AI and Anthropic.
- There are good universities in China and NYSE:BABA is regional big tech in China which gets great talent. I'm confident that NYSE:BABA would be able to compete with NASDAQ:META & NASDAQ:GOOGL in building LLMs even better with this export ban lift.
- Long NYSE:BABA and short/avoid NASDAQ:META ( overvalued )
Nvidia (NVDA) 2025+ Catalysts & Risks: Analyst Views🚀 Nvidia (NVDA) 2025+ Catalysts & Risks: Analyst Views
🔑 Key Catalysts Driving Nvidia’s Stock Growth (2025+)
1. 🏆 AI Chip Dominance
Nvidia maintains >90% market share in data-center AI chips (Blackwell, Hopper, Rubin). Its CUDA ecosystem and relentless innovation keep it as the “default” supplier for advanced AI, giving NVDA massive pricing power.
2. 🏗️ Surging Data Center Demand
Cloud and enterprise AI spending remains white-hot. Tech giants (Meta, Microsoft, Amazon, Google) are collectively pouring $300B+ into 2025 AI CapEx. Data center revenues are at all-time highs; analysts expect this uptrend to extend through 2026 as “AI infrastructure arms race” persists.
3. 🌐 Mainstream AI Adoption
AI is now integrated in nearly every industry—healthcare, finance, logistics, manufacturing, retail. As companies embed AI at scale, NVDA’s hardware/software sales rise, with “AI everywhere” tailwinds supporting 15–25% annual growth.
4. 🤝 Strategic Partnerships
Big wins: Deals with Snowflake, ServiceNow, and massive sovereign/international AI collaborations (e.g., $B+ Saudi Arabia/“Humain” order for Blackwell superchips; UAE, India, and Southeast Asia ramping up AI infrastructure using Nvidia).
5. 🚗 Automotive/Autonomous Vehicles
NVDA’s automotive AI segment is now its fastest-growing “new” business line, powering next-gen vehicles (Jaguar Land Rover, Mercedes, BYD, NIO, Lucid) and expected to surpass $1B+ annual run rate by late 2025.
6. 🧑💻 Expanding Software Ecosystem
Nvidia’s “full stack” software (CUDA, AI Enterprise, DGX Cloud) is now a sticky, recurring-revenue engine. Over 4M devs are building on Nvidia’s AI SDKs. Enterprise AI subscriptions add high-margin growth on top of hardware.
7. 🌎 Omniverse & Digital Twins
Industrial metaverse and simulation/digital twin momentum is building (major partnerships with Ansys, Siemens, SAP, Schneider Electric). Omniverse becoming the industry standard for 3D AI/simulation, unlocking new GPU/software demand.
8. 🛠️ Relentless Innovation
Blackwell Ultra GPUs debuting in late 2025, “Rubin” architecture in 2026. Fast-paced, aggressive product roadmap sustains Nvidia’s tech lead and triggers constant upgrade cycles for data centers and cloud providers.
9. 📦 Full-Stack Platform Expansion
Grace CPUs, BlueField DPUs, and Spectrum-X networking mean Nvidia is now a “one-stop shop” for AI infrastructure—capturing more value per system and displacing legacy CPU/network vendors.
10. 🌏 Global AI Infrastructure Buildout
Recent US export rule rollbacks are a huge tailwind, opening up new high-volume markets (Middle East, India, LatAm). Nvidia remains the “go-to” AI chip supplier for sovereign and enterprise supercomputers outside the US, supporting continued global growth.
________________________________________
📈 Latest Analyst Recommendations (July 2025)
•Street Consensus: Overwhelmingly bullish—~85% of analysts rate NVDA as “Buy/Overweight” (rest “Hold”), with target prices often in the $140–$165 range (post-split, as applicable).
•Target Price Range: Median 12-month PT: $150–$160 (representing ~20% upside from July 2025 levels).
•Key Bullish Arguments: Unmatched AI chip lead, accelerating enterprise AI adoption, deep software moat, and a robust international/sovereign AI order pipeline.
•Cautious/Bearish Notes: Valuation premium (45–50x P/E), high expectations priced in, geopolitical and supply chain risks.
________________________________________
⚠️ Key Negative Drivers & Risks
1. 🇨🇳 US–China Tech War / Chip Export Restrictions
• US restrictions: While the Biden administration eased some export bans in May 2025 (allowing more AI chip exports to Gulf/Asia partners), China remains subject to severe curbs on advanced NVDA AI chips.
• Workarounds: Nvidia is selling modified “China-compliant” chips (H20, L20, A800/H800), but at lower margins and lower performance.
• Risk: If US tightens controls again (post-election), China sales could fall further. Chinese firms (Huawei, SMIC, Biren) are also racing to build their own AI chips—posing long-term competitive risk.
2. 🏛️ Political/Regulatory Risk
• Election year: A US policy shift (e.g., harder tech stance after Nov 2025 election) could re-restrict exports, limit new markets, or disrupt supply chains (especially TSMC foundry reliance).
3. 🏷️ Valuation Risk
• NVDA trades at a substantial premium to tech/semiconductor peers (45–50x fwd earnings). Any AI “spending pause” or earnings miss could trigger sharp volatility.
4. 🏭 Supply Chain & Capacity Constraints
• As AI chip demand soars, there’s ongoing risk of supply/delivery bottlenecks (memory, HBM, advanced packaging), which could cap near-term revenue upside.
5. 🏁 Competitive Threats
• AMD, Intel, and custom in-house AI chips (by Google, Amazon, Microsoft, Tesla, etc.) are scaling up fast. Loss of a hyperscaler account or a successful open-source software alternative (vs CUDA) could erode Nvidia’s dominance.
6. 💵 Customer Concentration
• A small handful of cloud giants account for >35% of revenue. Delays or pullbacks in their AI spending would materially impact results.
________________________________________
📝 Summary Outlook (July 2025):
Nvidia’s AI chip monopoly, software moat, and global AI arms race create a powerful multi-year growth setup, but the stock’s high valuation and US-China chip tension are real risks. Analyst consensus remains strongly positive, with most seeing more upside as data-center and enterprise AI demand persists—but with increased focus on geopolitical headlines and potential supply chain hiccups.
________________________________________

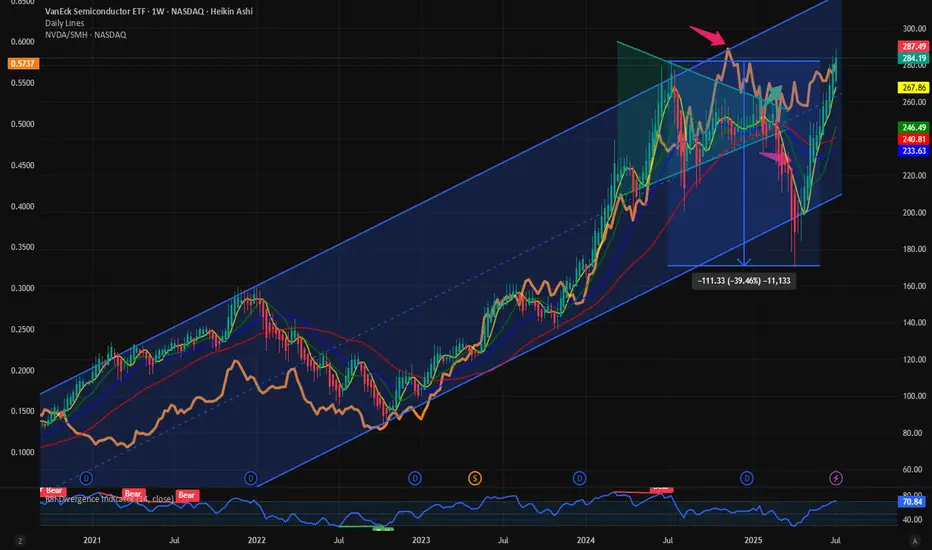
$SMH and $NVDA Dominance: Some more room to run for bothWith NASDAQ:NVDA and NASDAQ:SMH above their respective ATH the focus returns to the fact how far we can expect for both to outperform and make new highs. In this Blog we floated the idea of NASDAQ:NVDA dominance. This indicates the % of return / price movement in NASDAQ:SMH contributed by NASDAQ:NVDA as it is a cap weighted index. It captures the outperformance of the high momentum stocks like NASDAQ:NVDA and $AVGO.
On May 12 I predicated that NASDAQ:NVDA will reach 170$ before end of summer. And we are very close to our price target.
NASDAQ:NVDA : Full on Bull mode. 170 $ before end of Summer for NASDAQ:NVDA by RabishankarBiswal — TradingView
On May 30 we also favoured NASDAQ:SMH over AMEX:HACK and said that the momentum will continue and NASDAQ:SMH will touch new ATH. And here we are with NASDAQ:SMH above 280$.
NASDAQ:SMH vs AMEX:HACK : Recent good correlation with breakout potential for AMEX:HACK by RabishankarBiswal — TradingView
Now the question comes , how far these 2 can go and the bigger question is will NASDAQ:NVDA claim its Dominance in NASDAQ:SMH ? As you can see in the chart below the NASDAQ:NVDA Dominace in NASDAQ:SMH peaked at 0.6 or 60% on Nov 11. Currently we are @ 57% and still below its ATH. My estimate is NASDAQ:NVDA will claim its Dominance and go to the highs of 65% before SMH also completes it highs in this upward slopping channel with 315$ as my price target on $SMH.
Verdict: NVDA Dominance in NASDAQ:SMH can reach 65%. NASDAQ:SMH Target 315 $. NVDA Price target remains 170$ and above.
Inevitable Pull Back Coming Soon? | NVDA TSLA AAPL AMZN META MSFStock Market Forecast | CME_MINI:ES1! CME_MINI:NQ1! SPY QQQ
Mag 7 Forecast | NASDAQ:NVDA NASDAQ:TSLA AAPL AMZN META MSFT July 2025 Forecast

Ethereum’s Next Fair Value Gap is $3.8K — And the Road to $26K 🚀 Ethereum’s Next Fair Value Gap is $3.8K — And the Road to $26K Remains On Track
Ethereum ( CRYPTOCAP:ETH ) just reclaimed key structure — and despite a temporary pullback, all signals remain aligned for a parabolic breakout toward $26,000 this cycle.
Here’s why the next Fair Value Gap (FVG) sits near $3.8K, and why the Schiff Pitchfork structure still implies Ethereum is coiling for exponential upside in the coming months.
🔹 The $3.8K FVG: ETH’s Next Magnet
Looking at the daily chart:
The $3.8K zone is a clear untapped FVG (Fair Value Gap) from late 2021, created by a sharp breakdown candle that never got properly filled.
ETH is currently consolidating just below the $3.1K resistance band, and once that breaks, liquidity will naturally gravitate toward the next inefficiency — at $3,800–3,900.
This gap aligns with a previous supply zone and intersects with the upper resistance trendline from late 2021, creating a powerful magnet for price once momentum returns.
🔹 All-Time Schiff Pitchfork Still Intact
The Schiff Pitchfork structure drawn from Ethereum’s 2018 low through its COVID crash low and 2021 all-time high paints a highly disciplined range:
ETH is respecting the midline of the lower channel and recently bounced off the support of the median zone, with price now grinding higher within the ascending structure.
The upper band of the pitchfork intersects with price in late 2025 near the $26,000–28,000 zone, forming a natural cycle top target.
Historically, Ethereum has respected this long-term structure remarkably well — and this current move is no different.
🔹 Moving Averages & Bullish Market Structure
ETH recently flashed a Golden Cross — the 50-day SMA crossing above the 200-day SMA — which historically front-runs explosive upside in post-halving years.
All major SMAs (20/50/100/200) are now curling upward, creating a supportive launchpad.
Price is breaking out of the consolidation wedge that defined Q2 2025 — and has room to run toward $3.8K before meeting major overhead resistance.
🔹 Post-Halving Explosiveness
Let’s not forget: we’re in a post-halving year — and ETH has a consistent pattern of multiplying 5x–10x in the 9–12 months following Bitcoin halving events:
In 2017 (after 2016 halving): ETH went from ~$8 to $1,400 — nearly 175x.
In 2021 (after 2020 halving): ETH went from ~$120 to $4,800 — roughly 40x.
A move from the current ~$3K level to $26,000 is just an 8.5x — well within historical precedent.
🔹 Macro Tailwinds: ETH ETFs & Institutional Flows
BlackRock, Fidelity, and other asset managers are positioning Ethereum ETFs for approval, which would unlock billions in institutional inflows.
A staking ETF would dramatically compress supply — Ethereum already has over 27% of its supply locked — amplifying upside through supply-demand squeeze.
Meanwhile, stablecoin settlement volume is growing faster than Visa — all powered by Ethereum infrastructure.
🔹 Timing the Move: August to December Explosion?
The verticals on your chart highlight key windows:
A breakout window between early August and mid-September coincides with both macro liquidity injections and historical altseason patterns.
If ETH hits $3.8K by August, the runway to $8K–$14K opens by October, with $26K still well within reach by December 2025, in line with your pitchfork’s top boundary.
🟣 Summary: Ethereum’s Next Stop Is $3.8K — Then Moon
✅ Untapped FVG magnet at $3.8K
✅ Schiff Pitchfork upper boundary intersects near $26K
✅ Post-halving year + Golden Cross = Explosive setup
✅ ETH ETF narrative just beginning
✅ Structural breakout from consolidation wedge
Ethereum is no longer just the base layer of DeFi — it’s becoming the base layer of global financial infrastructure. And price hasn’t yet priced that in.
"If the internet had a price, it would be Ethereum."
Don’t fade this breakout. We’re still early.

$NVDA - $270 PT in BULL ChannelThe stock is currently bouncing off of the lower channel line of the rising Bull Channel. Price action has created a Cup and Handle. The projected Price Objective sits at around $270. Remember, the height of the cup is the project target which from current stock price extends to around $270.

NVIDIA ($NVDA) Elliott Wave Outlook: Larger Pullback on the HoriNvidia (NVDA) continues its remarkable ascent, consistently reaching new all-time highs and reinforcing a robust bullish outlook. The ongoing rally, which began from a significant low on April 7, 2025, remains structured as an impulsive wave pattern, indicative of strong upward momentum. However, despite the potential for further short-term gains, the cycle appears mature. This suggests a larger-degree pullback could be imminent. Investors should exercise caution when considering chasing this rally in shorter time frames, as the risk of a corrective move grows.
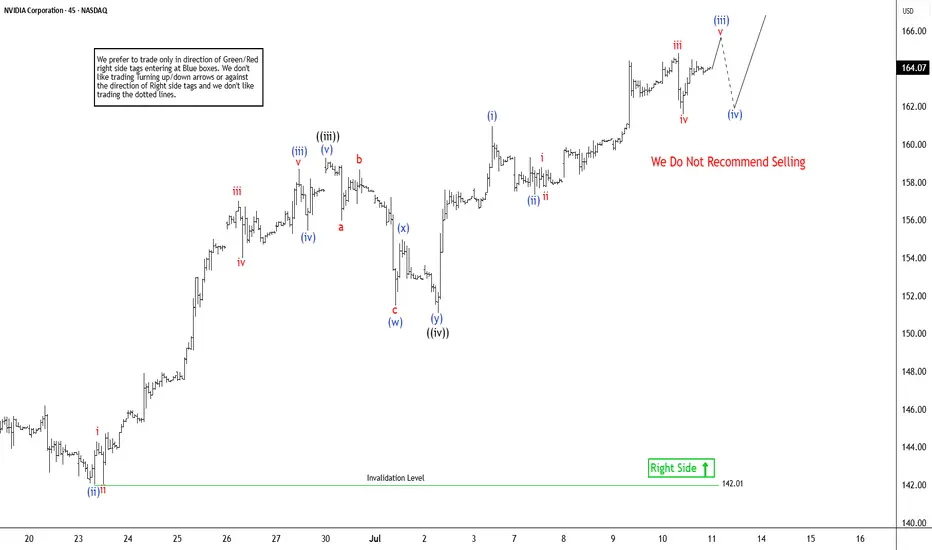
In the short term, the cycle initiated from the June 2 low is progressing as a lower-degree impulse. From this low, wave ((i)) peaked at $144, followed by a corrective pullback in wave ((ii)) that concluded at $137.88. The stock then surged in wave ((iii)) to $159.42. The subsequent wave ((iv)) correction unfolded as a double-three structure, with wave (w) ending at $151.49, wave (x) at $154.98, and wave (y) completing at $151.10, finalizing wave ((iv)). Currently, Nvidia is advancing in wave ((v)), exhibiting a five-wave subdivision. Within this, wave (i) of ((v)) reached $160.98, with a minor pullback in wave (ii) concluding at $157.34. As long as the pivotal low at $142.01 holds, any near-term pullbacks are likely to attract buyers in a 3, 7, or 11-swing pattern, supporting further upside potential. This technical setup underscores Nvidia’s strength but highlights the need for prudent risk management.
July 10th Market Outlook –Charted Waters & Uncertain Momentum🗓️📊 July 10th Market Outlook – Charted Waters & Uncertain Momentum 🌊⚠️
Today’s breakdown is a reality check for traders navigating a market full of setups but short on clarity. Resistance is stacking across the board, but that doesn’t mean we can’t break through — it just means we need to stay sharp and keep our charts close.
🔎 Highlights from the 19-minute video:
Bitcoin is approaching a third and crucial resistance test. A breakout could trigger ultra-FOMO, but failure here could send us lower.
Ethereum is in a pressure zone — the "Symplegades" setup from Greek mythology reflects today’s narrow trading path.
Bitcoin Dominance is clinging to support — if it breaks, altseason could be on. If it holds, alts may stay sidelined.
NASDAQ & Nvidia have delivered massive runs, but signs of exhaustion and reversal risk are showing.
Dollar Index (DXY) showing a Golden Cross, but unresolved rate expectations could catch markets off guard.
💬 I also speak candidly about market manipulation, being someone else’s exit liquidity, and why we might be heading toward a formative trap before any true breakout.
🎥 Watch the full video to catch all the details — from long-term setups to real-time chart reactions.
📌 Stay tuned for detailed updates today on Bitcoin, Ethereum, Bitcoin Dominance, NASDAQ and more.
One Love,
The FXPROFESSOR 💙
Disclosure: I am happy to be part of the Trade Nation's Influencer program and receive a monthly fee for using their TradingView charts in my analysis. Awesome broker, where the trader really comes first! 🌟🤝📈

A bit of profit taking on NVDA and then up again?NASDAQ:NVDA is the most talked about and everyone is capitalizing on that. Let's take a look.
NASDAQ:NVDA
Let us know what you think in the comments below.
Thank you.
75.2% of retail investor accounts lose money when trading CFDs with this provider. You should consider whether you understand how CFDs work and whether you can afford to take the high risk of losing your money. Past performance is not necessarily indicative of future results. The value of investments may fall as well as rise and the investor may not get back the amount initially invested. This content is not intended for nor applicable to residents of the UK. Cryptocurrency CFDs and spread bets are restricted in the UK for all retail clients.

USNAS100 Bullish Ahead of NVIDIA Milestone – 23010 in SightUSNAS100 – Outlook
The index continues its bullish momentum, supported by strong tech performance — notably NVIDIA surpassing a $4 trillion market cap.
As long as the price holds above 22880, the trend remains bullish toward:
23010 Then extended targets near 23170
However, a 1H close below 22815 would signal weakness, potentially opening the way for a retracement toward: 22705 And 22615, especially if tariff tensions escalate.
Resistance: 23010, 23170
Support: 22815, 22705, 22615

Nvidia Market Capitalisation Reaches $4 TrillionNvidia Market Capitalisation Reaches $4 Trillion
Yesterday, Nvidia’s (NVDA) share price surpassed $162 for the first time in history. As a result, the company’s market capitalisation briefly exceeded $4 trillion during intraday trading (according to CNBC), making Nvidia the first publicly listed company to reach this milestone.
The rise in NVDA’s share price is being driven by both bullish sentiment across the broader equity market—which appears optimistic ahead of the upcoming Q2 earnings season—and evidence of sustained demand for Nvidia’s products, as artificial intelligence technologies continue to gain widespread adoption.
Noteworthy developments include:
→ Nvidia may begin producing a specialised AI chip for the Chinese market this autumn, potentially circumventing current export restrictions;
→ Perplexity, a company backed by Nvidia, is launching an AI-powered browser aimed at competing with Google Chrome.
Technical Analysis of NVDA Chart
In our previous analysis of NVDA’s price action, we:
→ Drew an ascending channel;
→ Highlighted bullish conviction in overcoming the $145–150 resistance zone.
The channel remains valid, with the current price trading near its upper boundary. However, the RSI indicator is showing signs of bearish divergence, suggesting that the stock may be vulnerable to a near-term correction—potentially towards the median line of the existing upward channel.
At the same time, a major shift in the prevailing bullish trend appears unlikely. The $145–150 range may serve as a key support zone for NVDA in the foreseeable future.
This article represents the opinion of the Companies operating under the FXOpen brand only. It is not to be construed as an offer, solicitation, or recommendation with respect to products and services provided by the Companies operating under the FXOpen brand, nor is it to be considered financial advice.

NVIDIA – Best Buy of the Decade (4T Record but now resistance)🚀🔥 NVIDIA – Best Buy of the Decade Post #6
💡📉 Great but why am I taking half profits Today?
Back in July 2021, I named NVIDIA "The Best Buy of the Decade. " Today, it just hit a mind-blowing milestone — becoming the first company to reach a $4 trillion market cap. But here's the thing... that happened right at major resistance.
From our initial call in 2021 , to the target at $143.85 drawn via parabola in 2023, to the April 2025 re-entry at $95, it’s all on the chart — and it's been a textbook ride so far.
At the current level of $163.89, we’re pressing into serious overhead resistance. This doesn’t mean the story is over — not even close. But it could mean we take a breather before the next leg higher.
🧭 Targets ahead remain unchanged:
🔹 First stop: $182.85
🔹 Long-term vision: $227.41
What started as a bold macro call in 2021 has now become a multi-year thesis with precision updates along the way. This is post #6 in the NVIDIA journey — and if you scroll back through the chart, each piece has built on the last with clarity and conviction.
🎯 NVIDIA is not just a tech stock — it’s the AI backbone. But every cycle has pauses, and this one looks ready for a short rest before we see the next breakout.
Stay sharp, follow the structure, and honor the parabola.
One Love,
The FX PROFESSOR 💙
Additional info, for those who like to dive deeper into NVDA:
🔍 Technical Breakdown Version
For the chartists and structure followers, here’s the breakdown:
📌 2021: Original call — "Best Buy of the Decade"
📌 2023: First parabola plotted, projecting toward $143.85 — target hit precisely
📌 April 2025: Market offered $95 re-entry — second parabola begins
📌 Now: Price sits at $163.89, testing resistance from both structure and Fibonacci
📌 Next levels:
- $182.85 → Key extension level
- $227.41 → Long-term target based on full parabolic arc
Current structure suggests a possible pause before continuation. No need for panic — parabola remains valid unless structure is broken. Volume still supportive, and price action is following projection beautifully.
🧠 AI Macro Narrative Version
The big picture? NVIDIA isn't just another semi stock — it’s the nervous system of the AI revolution.
From gaming → crypto → AI, NVIDIA has consistently been first to adapt, and now it’s the leader in AI hardware infrastructure. The $4 trillion milestone is more than symbolic — it represents capital reallocation toward AI as the next dominant sector.
🧠 Key macro takeaways:
AI demand is insatiable
Data centers need NVIDIA
Generative AI isn't slowing down
Institutions are still buying — not selling
The resistance we see now isn’t weakness — it’s the market pausing to digest before another acceleration. Just like every past cycle... we ride, retrace, reload, and resume.
Disclosure: I am happy to be part of the Trade Nation's Influencer program and receive a monthly fee for using their TradingView charts in my analysis. Awesome broker, where the trader really comes first! 🌟🤝📈

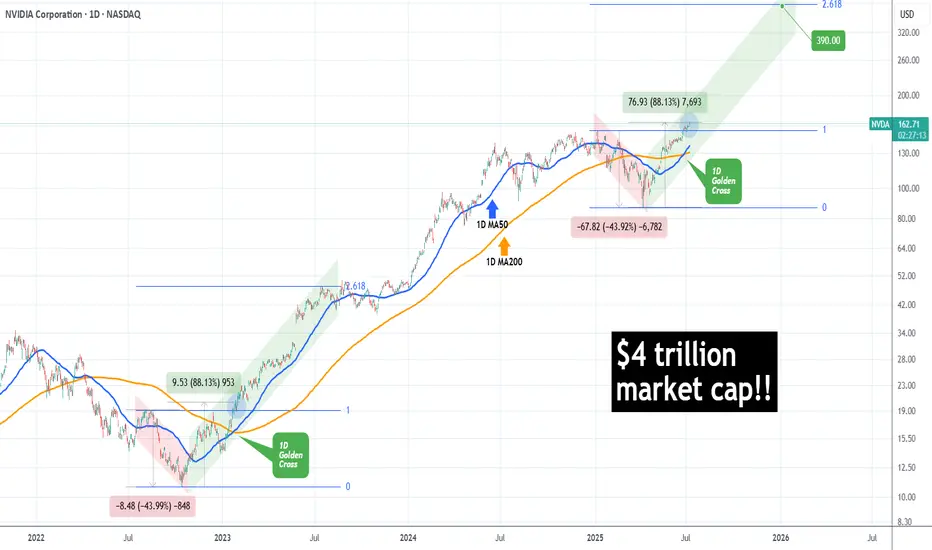
NVIDIA made history! First company with $4 trillion market cap!NVIDIA Corporation (NVDA) became today the first company in history to surpass a $4 trillion market value, as A.I. bulls extended the recent rally and pushed the price past the approximate $163.93 level needed to reach this market capitalization threshold.
The long-term trend on the 1D time-frame couldn't look more bullish. Coming off a 1D Golden Cross less than 2 weeks ago, the price has turned the 1D MA50 (blue trend-line) into Support and sits at +88.13% from the April 07 2025 Low.
This is the exact set-up that the market had when it was coming off the 2022 Inflation Crisis bottom (October 13 2022). As you can see, both fractals started with a -44% decline, bottomed and when they recovered by +88.13%, there were just past a 1D Golden Cross. In fact that Golden Cross (January 24 2023) was the last one before the current.
NVIDIA entered a Channel Up (green) on its recovery and for as long as the 1D MA50 was supporting, it peaked on the 2.618 Fibonacci extension before it pulled back below it.
If history repeats this pattern, we are looking at a potential peak around $390, which may indeed seem incredibly high at the moment, but as we pointed out on previous analyses, the market is in the early stages of the A.I. Bubble, similar to the Internet Bubble of the 1990s.
-------------------------------------------------------------------------------
** Please LIKE 👍, FOLLOW ✅, SHARE 🙌 and COMMENT ✍ if you enjoy this idea! Also share your ideas and charts in the comments section below! This is best way to keep it relevant, support us, keep the content here free and allow the idea to reach as many people as possible. **
-------------------------------------------------------------------------------
💸💸💸💸💸💸
👇 👇 👇 👇 👇 👇
Nvidia - New all time highs!Nvidia - NASDAQ:NVDA - breaks out now:
(click chart above to see the in depth analysis👆🏻)
Within two and a half months, Nvidia rallied more than +70%. Following this recent bullish strength, a retest of the previous highs was totally expected. But this does not seem to be the end at all. There is a much higher chance that we will see new all time highs soon.
Levels to watch: $150
Keep your long term vision🙏🙏
Philip (BasicTrading)

Macro Moves & Market Reversals: BTC-Metals-Tech-Dollar & more! 🤖📊 Macro Moves & Market Reversals: Bitcoin, Metals, Tech, Dollar & DAX Breakdown 🔥💹
Hey beautiful people,
FXPROFESSOR here with a massive market update to kick off the week. This one’s for my serious traders—those of you ready to read the market like a pro 📚💡
We’re in a critical transition. The Trump–Powell standoff, rate cut games, tariff escalations, and a surprising shift in risk appetite across bonds, metals, and equities are reshaping the entire trading landscape.
Let’s get into the full breakdown 👇
🧠 MACRO FIRST – THE FUNDAMENTAL PULSE
🟢 Interest Rates:
The Fed is keeping rates steady at 4.25%–4.50%, citing strong jobs data. 147K jobs added, unemployment at 4.1%. The market wanted bad news for rate cuts... didn’t get it.
🗓 September remains the most likely cut, but the Fed isn’t rushing. Strong labor = slow policy change.
⚠️ Tariffs Heating Up:
Trump just slapped 25–40% tariffs on imports from Japan, Korea, and others – effective August 1.
➡️ If no political resolution by July 9, prepare for a volatility wave.
Tariffs = supply chain risks + cost-push inflation.
💣 Geopolitics:
Middle East tensions remain background noise, but no major disruptions for now. Still, oil remains sensitive.
📈 Risk Appetite (Bonds):
U.S. Treasuries still lagging, but junk bonds and quality credit (LQD) have pumped. That’s a big clue: risk appetite is returning, even without a Fed pivot.
📉 DOLLAR INDEX (DXY) – "THE YEAR OF THE NORMALIZED DOLLAR"
We’ve followed this dollar short all year.
🔻 From rejection at 100.965, DXY dropped straight into our long-term 94–95 target zone.
📌 Now what? This level is MAJOR. A bounce could trap dollar bears.
🧭 No new short from me unless we re-tag 100+. The juice is squeezed.
Key takeaway:
The dollar already priced in rate cuts, and we didn’t even get them. That’s telling me the next macro move might not be so predictable.
💰 BITCOIN – STILL THE KING
📍 BTC at $115K resistance – a level I’ve charted for years, not weeks.
Three hits:
1️⃣ First rejection
2️⃣ Second rejection
3️⃣ And now... a decisive moment
🚨 Break 115K → BTC flies.
📉 Fail here → we could revisit $64K, yes, seriously. I’m ready for both outcomes.
This is not the time for hopium. It’s 50/50.
🪙 BTC DOMINANCE – THE ALTCOIN SWITCH
BTC.D is now above 65%. That means:
✔️ Capital flowing back into BTC
❌ Altcoins not ready yet
We don’t chase alts until BTC.D hits 71.3–72.9%. That’s the real “altseason trigger zone.”
🔒 I’m personally turned off from alts for now—too much noise, too many memes, not enough macro support.
🔩 PRECIOUS METALS – SHINING BRIGHT
💛 Gold (XAU/USD):
Reached near $3,500 highs
Now stalling
🛑 Taking profits here – caution warranted.
🤍 Silver (XAG/USD):
13-year high
Holding $36+ well
Potential breakout pending global inflation data
💿 Platinum (the sleeper):
+47% YTD
Beautiful long setup played out exactly as planned
Still bullish above $1,400 if supply squeeze continues
💡 ETFs in metals are seeing inflows – more institutions hedging as dollar weakens.
🚗🔌 TECH STOCKS – NVDA, TSLA & THE NASDAQ
📈 NVIDIA (NVDA)
Best trade of the year for me
Clean re-entry, now hitting ATH levels
AI demand + tight supply = rocket fuel
⚡ Tesla (TSLA)
Bounce off 4H trendline
Still lagging slightly – political tensions (Trump vs. Musk) not helping
But levels are working like a charm
📊 NASDAQ (QQQ)
Hit our “max pain” zone perfectly
Rebounded with textbook precision
Momentum intact – watching for new highs
🇩🇪 DAX INDEX – CHARTS DON’T LIE
All-time high. Boom. Called it weeks ago.
Despite:
No Russian energy
Industrial drag
ECB policy constraints
📌 But what worked?
➡️ Simple chart structure.
➡️ Market psychology.
➡️ Pure TA.
Now at resistance again. Watch carefully – support below is clearly defined.
🧾 FINAL THOUGHTS – THE PROFESSOR'S NOTES
🔹 The market’s narrative can change fast, especially with Trump in the mix. He’s Mr. Volatility.
🔹 Powell holds the real power – and right now, he’s not flinching.
🔹 Risk appetite is back – but not evenly. Bitcoin is leading, altcoins are lagging, metals are maturing.
🔹 If rate cuts materialize in September, expect massive rotation across all risk assets.
💭 Until then, I’m playing level-to-level. No FOMO. Just charts and logic. That’s how we survive, and thrive.
Let me know which chart you want next – and thank you for staying sharp 💪📚
One Love,
The FXPROFESSOR 💙
Disclosure: I am happy to be part of the Trade Nation's Influencer program and receive a monthly fee for using their TradingView charts in my analysis. Awesome broker, where the trader really comes first! 🌟🤝📈

NVDA Analysis To 164?Quick breakdown of NVDA
Appears we hit our corrected level, we could go deeper possibly or hold at this level and drive up to 164
This is looking like a nice little setup long indeed
Trade Smarter Live Better
Kris/Mindbloome Exchange

AAAPL: Updated Outlook and Best Level to BUY/HOLD 70% gains________________________________________
Apple Outlook: July 2025–Q1 2026
After peaking near $200 in late May, Apple (AAPL) remains under correction territory despite pockets of resilience, closing July around $193. The current correction is projected to persist until Q1 2026, as global macro and policy headwinds weigh on the broader tech sector. Technicals suggest AAPL could find its cycle low between Q3 and Q4 2025, potentially setting the stage for a renewed bull run into late 2026. Pullback until 170/175 USD. 📉
Catalysts Shaping Apple’s Stock Price in 2025–26
1. AI Integration and Apple Intelligence
Strength: 9/10
The roll-out of on-device Apple Intelligence features—including an upgraded Siri, ChatGPT integrations, and generative AI tools—continues to build anticipation for a major iPhone upgrade supercycle. Initial adoption has been strong, but broader impact will hinge on Q4 developer and enterprise feedback. 🤖
2. Services Segment Growth
Strength: 8.5/10
Apple’s Services business (App Store, iCloud, Apple Music, AI-powered subscriptions) is projected to post double-digit growth into Q4 2025, with consensus revenue estimates at $25–27B for the quarter. Analysts see upside from new AI-driven service bundles, which could add $5–8B in annualized revenue by 2026. 💡
3. Gross Margin Expansion & Cost Efficiencies
Strength: 8/10
Apple’s gross margin is forecast to improve by up to 60 basis points in Q4 2025 as the product mix tilts toward higher-margin services, and as component costs ease. Operational efficiencies from supply-chain automation may further cushion profit margins amid macro uncertainty. 📊
4. iPhone 17 Product Cycle
Strength: 7.5/10
The iPhone 17 lineup—rumored to include advanced polymer batteries and potential foldable form factors—is expected to launch Q4 2025, giving Apple a competitive hardware edge versus Android rivals. Early channel checks point to pent-up demand, though upgrade rates may lag previous cycles due to consumer caution. 📱
5. Vision Pro & Hardware Diversification
Strength: 7/10
Next-gen Vision Pro headsets and new AR/VR devices, boosted by Apple Intelligence, are expected to drive incremental growth in Q4 2025. However, high price points and limited mainstream adoption keep near-term impact contained. 🥽
6. Share Buybacks & Dividend Policy
Strength: 7/10
Apple’s $110B share buyback authorization and steady dividend growth provide valuation support, but recent market volatility has prompted a more cautious pace of repurchases. Yield-seeking investors are watching closely for any pivot in capital return policy if macro pressures persist. 💵
7. Supply Chain & Trade Policy Risks
Strength: 6.5/10
Escalating U.S.–China trade tensions—including the risk of expanded tariffs or tech export bans—remain a top concern. Apple is accelerating its assembly shift toward India and Vietnam to diversify risk, but any new policy shocks in Q4 could hit margins and unit volumes. 🌏
8. Regulatory & Antitrust Pressures
Strength: 6/10
The EU’s Digital Markets Act and potential U.S. antitrust probes could force Apple to further open up its iOS ecosystem by year-end, potentially capping Services revenue growth and adding compliance costs. ⚖️
9. Macro & Interest-Rate Environment
Strength: 5/10
With the Fed signaling “higher for longer” rates through mid-2026, tech sector valuations remain under pressure. Analysts see this limiting multiple expansion even if EPS growth resumes in late 2025. 📈
10. Smartphone Market Competition
Strength: 5/10
Aggressive pricing and innovation from Samsung and Chinese OEMs are intensifying competitive pressures, especially in emerging markets. Apple’s share gains are likely to slow until the macro environment improves and new hardware cycles fully materialize. 🥊
________________________________________
Analyst Projections for Q4 2025:
• Consensus Revenue: $108–112B (up ~4% YoY)
• EPS Estimate: $2.30–$2.42
• Gross Margin: 45–46%
• iPhone Unit Growth: 2–3%
• Services Revenue: $25–27B
Morgan Stanley and JP Morgan maintain “Overweight” ratings, but expect rangebound performance until macro and trade uncertainty clears. Most price targets for Q4 2025 hover between $195–$215, with upside potential post-correction into 2026. 📊
________________________________________
Analyst / Firm Date Rating Price Target (USD)
Barclays 06/24/2025 – 173 ()
Jefferies (E. Lee) 07/01/2025 Hold (Upgraded) 188.32
UBS (D. Vogt) 07/03/2025 – 210.00
J.P. Morgan (S. Chatterjee) 06/26/2025 Overweight 230.00
Morgan Stanley (E. Woodring) 03/12/2025 Overweight 252.00
Evercore ISI 01/31/2025 – 260.00
Redburn Partners 01/31/2025 – 230.00
D.A. Davidson (G. Luria) 05/02/2025 – 250.00
TradingView Consensus (avg) – Consensus 228.98
TipRanks Consensus (avg over 3mo) – Consensus 226.36
