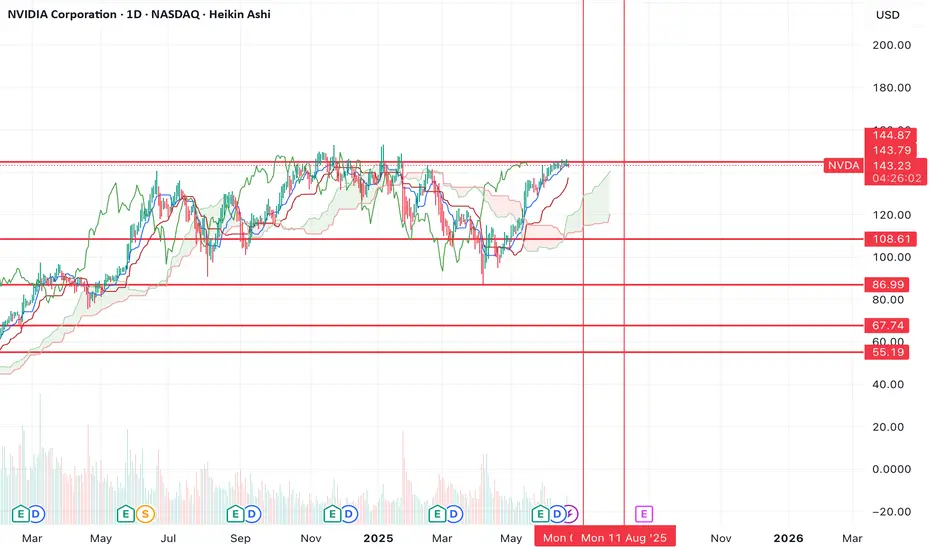
$NVDA has topped, new lows incomingNVDA has now topped, you can see that we've just formed another high time frame lower high and the rejection up here has the potential to create a strong bearish move.
I think it's very likely that the bearish move will take us all the way down to the bottom support before it's completed.
The bounce from the bottom went higher than I initially thought it would (which is why I'm creating a new chart), but price can't escape gravity and the same outcome is inevitable.
Let's see how it plays out over the coming weeks.
NVDA
Stock Market Forecast | TSLA NVDA AAPL AMZN META MSFTStock Market Forecast | !nq1! !es1! SPY QQQ
Mag 7 Forecast | NASDAQ:TSLA NASDAQ:NVDA AAPL AMZN META MSFT GOOG

$AVGO above its previous ATH and holding on. 400 $ reachable. The poster child of the AI rally has been NASDAQ:NVDA and $AVGO. Here we have analysed both the stocks multiple times fundamentally and technically. But the lesser known NASDAQ:AVGO has performed better than the NASDAQ:NVDA since the April lows. NASDAQ:AVGO is still above its previous ATH and closed above yesterday which was 242 $ in Jan 2025. NASDAQ:NVDA is still below its Jan 2025 highs of 152 $.
The Semis index NASDAQ:SMH is also 6.3% below its ATH of 262 $. So not many stocks in this index have a more bullish chart than $AVGO. My assessment is that NASDAQ:AVGO will continue its dominant outperformance in the NASDAQ:SMH sector in comparison to others like $NVDA.
Going back to technical and plotting the Fib Extension levels form the last bull run before Aug 2024 we can see that the next possible near-term target is 275 $, a 10% upside form here and in the medium term the target is 400 $.
Verdict : Long NASDAQ:AVGO over NASDAQ:SMH and $NVDA. First Target 275 $ then we go to 400 $.

NVIDIA – Best Buy of the Decade (2 Years from now) 🚀💻 NVIDIA – Best Buy of the Decade (2 Years from now) 🔥🧠
Hey everyone! Back in 2021, I called NVIDIA the best buy of the decade, and in 2023, we followed up as NVDA rocketed to my target of $143. Now in 2025, it’s time for Part 3 — and the case for NVDA being a generational play just got even stronger. 💪
✅ On April 4th, I re-entered around $96.85, right at my alert level. The setup? A rounded bottom reversal pattern forming with 4 strong bullish divergences on key indicators (Stoch, CCI, MOM, MFI). Target levels ahead:
📍 $143
📍 $182
📍 $227
📉 Yes, Nvidia took a 6% hit after announcing a $5.5B impact from U.S. export restrictions on its H20 chip to China — a reminder that macro & geopolitical factors still matter. But…
💡 The company just launched DGX Spark and DGX Station, bringing AI supercomputing to the desktop — powered by Grace Blackwell architecture. That’s next-level innovation, not just for enterprises, but for developers, students, and researchers alike. A true desktop AI revolution.
🇺🇸 And most importantly: NVIDIA will now manufacture AI supercomputers on U.S. soil — in Arizona and Texas — aiming to produce $500 billion worth over the next four years. This initiative is a bold move toward supply chain resilience, economic growth, and cementing NVIDIA’s leadership in the AI arms race.
⚠️ If we lose the $96 level, I’ll re-evaluate. But for now? The technical and fundamentals still say: Best Buy of the Decade (2 Years from now we will revisit this chart).
💬 What’s your outlook? Are you buying the dip or waiting on clarity?
One Love,
The FXPROFESSOR 💙

CRWV high tight flag pattern we have a breakout setting up at 162 ive taken a position at the open with a stop under 154 this is the best pattern in the market.
WE have huge momo the last month now we have the first consolidation in the run. It shoudl get bought as the fomo kicks in,

NVIDIA (NVDA) – Ending Diagonal at the Top? 126 Next?NVDA is currently trading inside a potential ending diagonal, often signaling a reversal or strong correction. With multiple Breaks of Structure (BoS) and a visible Fair Value Gap (FVG) left behind, this setup is aligning with Smart Money Concepts.
📉 Bearish Rejection Expected?
Price might sweep liquidity and revisit the 126–129 demand zone, where strong unmitigated orders sit. If this zone holds, a bullish continuation toward 152+ is likely.
🔍 Key Highlights:
⚠️ Ending Diagonal pattern near local top
📊 Multiple BoS confirming internal structure shifts
📉 Unfilled Fair Value Gap (FVG) near 129
🟩 Strong demand zones at 129–126 and 108
🔄 Potential liquidity sweep before reversal
🧠 Smart money footprint visible
📅 Watch for price reaction around 129.8–126.1.
📈 Breakout above 145 with strength may invalidate the drop.

SPY & MegaCap strengthSPY saw a very strong gap up, negating most of the selling from last week.
despite rising tensions in the middle east - investors have shrugged off volatility and bought the initial dip.
This may be proving that "war" is good for stocks.
we observed a very close correlation between the indices and oil today.
As oil reversed higher - markets saw a bit of weakness. As oil fell markets rallied.
TSLA trying to break a 4 hour bullish pattern
META new Smart Glasses release causing a surge.
MSFT new all time high tap
NVDA firm with ripping semiconductors
GOOGL looking strong for continuation
AMZN moving nicely off support
AAPL lagging the mega's but positive

Stock Market Forecast | TSLA NVDA AAPL AMZN META MSFTStock Market Forecast | CME_MINI:NQ1! CME_MINI:ES1! SPY QQQ
Mag 7 Forecast | NASDAQ:TSLA NVDA AAPL AMZN META MSFT GOOG

NVDA Swing Trade – Overbought Reversal Setup (June 12, 2025)📉 NVDA Swing Trade – Overbought Reversal Setup (June 12, 2025)
Ticker: NASDAQ:NVDA | Bias: 🔻 Moderately Bearish
Strategy: Short-Term Swing | Timeframe: ~2 weeks
Confidence: 75% | Entry Timing: Market Open
Expiry: June 27, 2025
🔍 Market & Technical Snapshot
• Price: ~$144.67
• Trend: Weekly and M15 uptrend still intact
• RSI (Daily): ~70.63 → Overbought
• MACD: Bearish crossover on Daily
• Options Data:
– Heavy put OI at $140 (14,803 contracts)
– Max pain at $135 → potential pull lower
– High call OI at $145–$150 caps upside
🧠 AI Model Breakdown
🔼 Grok/xAI (Bullish Swing):
• Calls out strong technicals, 5-min momentum
• Suggests $155C for upside play
🔽 DeepSeek (Bearish Swing – Preferred):
• Overbought daily RSI + bearish MACD
• Strong put volume + options market pressure
• Targets pullback to $138–$140 → PUT @ $140
✅ Recommended Trade Setup
🎯 Direction: PUT
📍 Strike: $140
📅 Expiry: 2025-06-27
💵 Entry Price: $2.09
🎯 Profit Target: $3.10 (+48%)
🛑 Stop Loss: $1.25 (–40%)
📈 Confidence: 75%
📏 Size: 1 contract
⏰ Entry Timing: Market Open
⚠️ Risk Considerations
• Weekly chart still bullish → risk of trend continuation
• Low VIX (17.26) = slower option premium movement
• Positive news surprise could cause upside gap
• Use tight risk controls and monitor intraday structure
💭 NASDAQ:NVDA : Extended or just gearing up for another breakout?
📉 Drop your play below — Put buyers vs. breakout chasers 👇

$SMCI "Buy The Dip" Value AreaSMCI (Super Micro Computer) has weathered the storm from all the negative press and I believe it is poised to go on a big run. This $26-$47 area is the BEST value you are going to get on it. This is probably the last discount before takeoff. We may not see this level again. As NVDA continues to fly, so will SMCI. Always do your own DD.

Nvidia - The breakout will eventually follow!Nvidia - NASDAQ:NVDA - will break out soon:
(click chart above to see the in depth analysis👆🏻)
Over the course of the past couple of days, we saw a quite strong rally of +50% on Nvidia. Considering the market cap of this company, such a move is quite impressive. Following this overall very strong bullish momentum, an all time high breakout is quite likely to happen soon.
Levels to watch: $150
Keep your long term vision!
Philip (BasicTrading)

AI Chip Stocks NVDA and AMD Showing 5 Wave RiseNASDAQ:NVDA and NASDAQ:AMD are both showing 5 wave rise in weekly chart after a correction in WXY. I haven't checked but other AI related stocks also might be doing something similar.
Once the 5 waves are over, we can expect some correction but the 5-wave rise post a correction typically signals fresh uptrend so it might be worth keeping an eye on these stocks. Waiting till retracement/correction of this rise is complete.

Is NVDA Building Strength Before a Breakout?After cooling off from its $150 highs, NVIDIA (NVDA) is consolidating in the $140–$145 zone. While some traders fear the AI hype has peaked, others see this as the calm before another rally. With solid fundamentals, continued leadership in AI, and strong institutional backing, NVDA remains a name to watch closely.
🎯 Trade Setup:
Entry Points
✅ $142 – Current price zone (speculative buy)
✅ $135–$130 – Strong support (ideal swing entry)
✅ $125 (only if market-wide pullback occurs)
Profit Targets
📈 TP1: $149 – All-time high retest
🚀 TP2: $160 – Extension target
💰 TP3: $175+ – Long-term bullish scenario if momentum returns
💡 Strategy: This is a “buy-the-dip, trade-the-breakout” setup. Wait for confirmation above $146 if you're conservative, or accumulate gradually into weakness with a clear risk plan.
📌 Disclaimer: This is not financial advice. Always do your own research and use proper risk management. I'm sharing my personal view for educational purposes.

OKTA - DAY TRADE IDEAOKTA is setting up for a day trade scalp long...perhaps an aggressive swing trade as well. The day trade is a much higher probability of success around the $98.50-$99.30
Okta's stock has seen some volatility recently. After a strong rally earlier this year, it pulled back following cautious guidance from the company. Despite beating expectations on sales and earnings for Q1 fiscal 2026, investors were concerned about slowing growth, leading to a 14.6% drop in its stock price.
Okta reported $688 million in revenue, a 12% year-over-year increase, and positive free cash flow of $238 million, but its GAAP earnings were significantly lower than its adjusted earnings. The company maintained its full-year revenue forecast of $2.85 billion to $2.86 billion, reflecting 9% to 10% growth, but analysts tempered their optimism due to macroeconomic uncertainties.
Technicals
- Multiyear Support
- 50 % Fib Retrace
- Upsloping Trendline
- Positive Divergence building on 1/ 4 hour chart.

AMD - Inverted Head & Shoulders (Bullish Reversal)Let´s see if we can break the neckline (White trendline) and stay above with a close and possibly a retest on the neckline to confirm this pattern. If so, Im looking for the previous top on daily which is the all time high (So far).
This is not a financial advise. Always do your own research and decision before investing.

Stock Market Forecast | TSLA NVDA AAPL AMZN META MSFTStock Market Forecast | CME_MINI:NQ1! CME_MINI:ES1! QQQ AMEX:SPY
Mag 7 Forecast | NASDAQ:TSLA NASDAQ:NVDA AAPL AMZN META MSFT GOOG

NVDA to $240 by 2026NASDAQ:NVDA is bullish still, anyone can see that, however I wanted to find some targets once it's in price discovery mode, well the golden pocket happpens to be $240 ($225-$250)
on weekly trend is confirmed extremely bullish so I'll continue holding and NASDAQ:NVDA should break $240 before 2026
Even a buy signal went off at the bottom in April. Let's see how much gas NASDAQ:NVDA has after it breaks the famous $150 resistance level

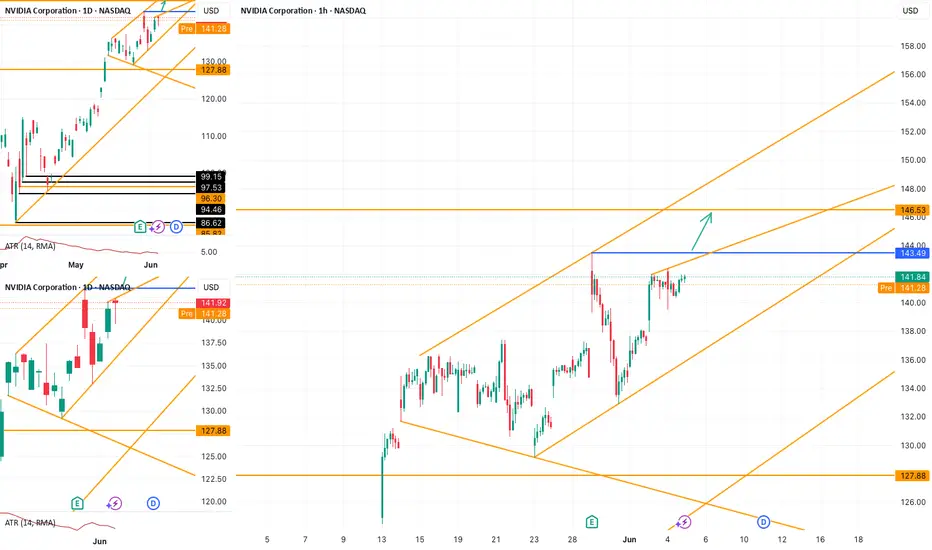
NVDA Setup: Clean Path to 146.53 If 143.49 Gives WayNASDAQ:NVDA continues to move within a rising channel. On the 1H chart, no major trendline currently limits further upside. If price breaks above the key swing high at 143.49 , the next potential target lies around 146.53 .
$NVDA - $250 PT Bullish Cup & HandleThere is a Bullish Cup and Handle Setting Up. Height of the Cup is the Price Objective which would take the stock from current levels to roughly $250.

Potential Reversal Zone for NVDAThis chart of NVIDIA Corporation (NVDA) as of June 3, 2025, shows a technical analysis scenario forecasting a possible bearish reversal. The price action, zones, and arrows suggest a setup based on supply and demand zones.
Key Elements in the Chart:
🔴 Supply Zone (Resistance Area)
Location: Around $141.73 to ~$144
Observation: The price recently entered this red-shaded area, indicating strong historical resistance.
Implication: The area is expected to act as a ceiling, where sellers may overwhelm buyers, causing a reversal.
⚫ Price Reaction:
The chart shows price approaching and briefly piercing the supply zone, followed by a bearish candle or rejection (as indicated by the top arrow).
Arrows project a downward movement, suggesting bearish sentiment.
🟢 Demand Zone (Support Area)
Location: Approximately $114–$121
Observation: This green-shaded area acted as a base for a previous upward move.
Implication: It is likely to act as a strong support if the price drops significantly.
Projected Price Path:
Short-term reversal from the resistance zone (~$144).
Initial drop to mid $130s (likely a lower high or minor support).
Continuation to demand zone around $116, completing the projected bearish move.
Technical Interpretation:
This setup is a classic supply and demand reversal strategy.
Confirmation of the short setup may require:
A clear rejection candle at resistance.
Break of minor support levels on the way down.
Risk for bulls is high near resistance; short sellers may find opportunities targeting the demand zone.

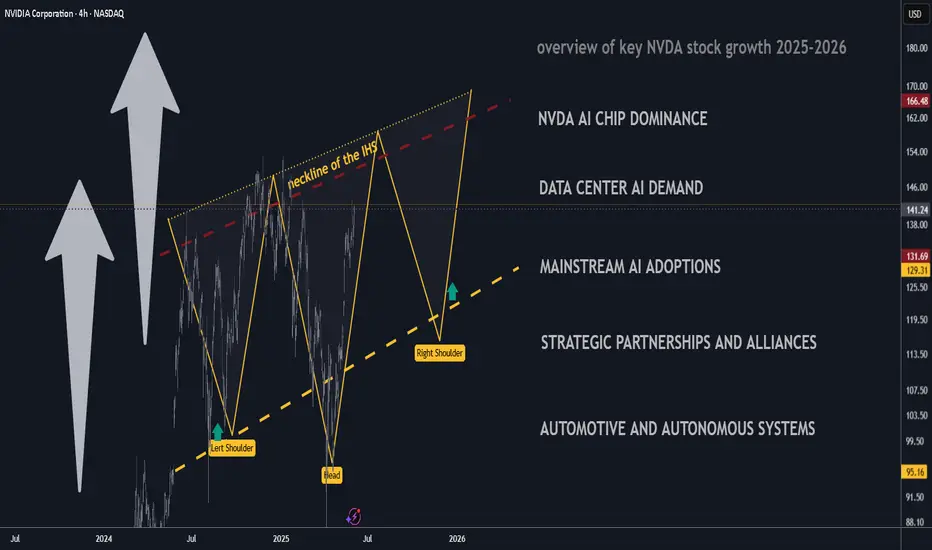
Key Catalysts Driving Nvidia’s Stock Growth 2025 and BeyondKey Catalysts Driving Nvidia’s Stock Growth (Mid-2025 Onward)
Nvidia (NVDA) has solidified its position at the center of the AI computing boom, with record fiscal 2025 revenue of $130.5 billion (114% year-over-year growth) driven by surging demand for its AI chips. Looking ahead from mid-2025, multiple fundamental catalysts are expected to power further stock price growth. Below, we identify 10 primary forward-looking growth drivers for Nvidia, each ranked by expected impact (0 to 10) and analyzed with recent data, forecasts, and developments.
1. AI Chip Dominance – Strength: 10/10
Nvidia is the undisputed leader in accelerated AI hardware, commanding a dominant market share in data-center GPUs and AI chips. Its GPUs have become the backbone of modern AI – Nvidia “holds the pole position” in the AI ecosystem, with industry estimates showing it controls over 90% of the data-center AI processor market. This chip supremacy gives Nvidia tremendous pricing power and a virtuous cycle: more developers adopt its CUDA platform and hardware, further reinforcing its lead. As advanced AI models grow ever more complex, Nvidia’s top-of-the-line silicon (from the current Blackwell GPUs to upcoming architectures) remains the default choice for training and deploying cutting-edge AI, positioning the company to capture the lion’s share of the AI revolution.
2. Explosive Data Center AI Demand – Strength: 10/10
Skyrocketing demand from cloud giants and enterprise data centers for AI compute is a core growth engine for Nvidia. The company’s data-center segment has experienced exponential growth – in calendar 2023, Nvidia’s data center revenue surged by 409%– as hyperscalers raced to build out AI infrastructure for large-scale training and inference. This upward trend is expected to continue into 2025 as companies pour capital into AI-driven services. Notably, tech titans like Meta, Microsoft, Amazon, and Google have collectively pledged over $300 billion in 2025 AI-related capex, reflecting no slowdown in spending on AI servers.
Nvidia directly benefits, as its high-end GPUs (e.g. H100 and Blackwell) are heavily deployed for these AI workloads. In its latest quarter, Nvidia reported data center revenue of $39.1 billion (up 73% year-on-year – an astonishing run-rate driven by relentless orders from cloud providers. With customers reportedly maintaining or increasing their 2025 AI infrastructure plans, data-center demand remains an unparalleled catalyst for Nvidia’s growth over the next several years.
3. Mainstream AI Adoption Across Industries – Strength: 9/10
AI is rapidly becoming ubiquitous in business processes and consumer applications, translating to broad-based demand for Nvidia’s technology beyond the hyperscalers. “AI has gone mainstream and it’s being integrated into every application,” CEO Jensen Huang noted – from logistics and e-commerce to healthcare and finance, organizations are embedding AI to gain efficiency and insights. This everyday AI usage sustains high growth for Nvidia as enterprises large and small invest in AI capabilities, often via cloud services powered by Nvidia GPUs. The company is banking on this pervasive adoption (“AI…in delivery services everywhere, shopping services everywhere”) to drive continued revenue expansion.
Crucially, as AI moves into normal operations – such as automated customer service, supply chain optimization, and data analytics – demand shifts from one-off experimental projects to ongoing, scaled deployments. This creates a steady, secular tailwind for Nvidia’s AI platforms (both hardware and software) across virtually every industry. Analysts expect Nvidia’s revenue to keep rising at a healthy clip (UBS projects ~$147 billion by 2026, up from ~$27 billion in 2023f) precisely because AI adoption is broadening into a long-term, multi-industry growth cycle. In short, the “AI everywhere” era means sustained demand for Nvidia’s solutions well beyond the tech sector.
4. Strategic Partnerships & Alliances – Strength: 8/10
Nvidia has forged high-impact partnerships across tech, industry, and even nations, which amplify its market reach and create new revenue streams. Robust alliances with virtually all major technology players are central to Nvidia’s strategy, enabling it to deliver solutions at massive scale. For example, Nvidia expanded collaborations with cloud providers and enterprise software firms: Snowflake now integrates Nvidia’s full-stack AI platform to help customers build AI applications in the Data Cloud, and ServiceNow is co-developing enterprise AI agents with Nvidia’s tools to transform business workflows.
These deals embed Nvidia’s AI technology into popular platforms, driving indirect adoption of its chips and software. On the global stage, Nvidia is also partnering with governments and sovereign investment funds to supply AI infrastructure. In May 2025, Nvidia announced a major partnership with Saudi Arabia’s AI firm Humain (backed by the Saudi Public Investment Fund) to build out national AI infrastructure. In the first phase, Humain will purchase 18,000 of Nvidia’s advanced Grace Blackwell AI superchips for new Saudi data centers. Such large-scale deals not only yield immediate chip sales but also cement Nvidia’s position as the go-to provider for strategic AI projects. Overall, by teaming up with influential cloud vendors, software companies, automakers, and governments, Nvidia is seeding long-term growth opportunities far beyond what it could achieve alone.
5. Automotive & Autonomous Systems – Strength: 8/10
Nvidia’s push into automotive AI is expected to become a significant growth driver as the auto industry evolves toward self-driving, electrification, and software-defined vehicles. Nvidia’s automotive segment – which provides AI chips and software (Drive platform) for driver assistance and autonomous driving – grew 27% year-over-year recently and is considered the company’s next billion-dollar business line. The pipeline is robust: more than 25 vehicle makers (including EV leaders BYD, NIO, Lucid and stalwarts like Mercedes-Benz, Volvo, Jaguar Land Rover) have adopted the NVIDIA DRIVE system-on-chip for their next-generation cars. Starting in 2025, all new Jaguar Land Rover models will be built on Nvidia’s Drive AI platform (from cloud training to in-car chips), and Mercedes is rolling out Nvidia-powered “Hyperion” AI computers in its 2024 models.
These design wins translate to multi-year revenue streams in hardware and software (through NVIDIA’s DRIVE OS and AI cockpit software). As vehicles become “computers on wheels” requiring sophisticated AI for perception and decision-making, Nvidia is uniquely positioned with its automotive-grade Orin/Atlan chips and full software stack. Additionally, Nvidia’s technology is expanding into robotaxis, trucking, and autonomous industrial machines, tapping markets beyond passenger cars. While automotive AI revenue is smaller today than data center, its growth trajectory (with a design-win pipeline exceeding $11 billion over 6 years makes it a strong catalyst moving forward – effectively adding a new vertical to Nvidia’s growth profile as self-driving capabilities proliferate.
6. Expanding Software Ecosystem & Platforms – Strength: 9/10
A critical (and often underappreciated) driver of Nvidia’s success is its full-stack software ecosystem, which greatly extends its reach and creates a sticky moat around its hardware. Nvidia has spent years developing software frameworks, libraries, and tools (from the CUDA programming platform to AI frameworks like TensorRT and NVIDIA AI Enterprise) that are custom-built for its chipsets. This tight integration means anyone building AI, HPC, or graphics applications can leverage Nvidia’s optimized software to get superior performance – but in doing so, they become tied into Nvidia’s platform. For example, CUDA has become the de facto standard for GPU computing, with countless applications and machine learning models written for Nvidia GPUs.
The result is a virtuous ecosystem: over 4 million developers now work with Nvidia’s SDKs, and the company continually updates its software (e.g. CUDA Toolkit, cuDNN, Triton inference server) to support new AI breakthroughs. Beyond enabling hardware sales, software is becoming a direct revenue stream. The NVIDIA AI Enterprise suite – a cloud-native AI software platform dubbed the “operating system for enterprise AI”– is sold via licenses and subscriptions to corporations deploying AI. Likewise, Nvidia’s DGX Cloud offering provides its AI infrastructure “as-a-service” via cloud partners, contributing to nearly $1 billion in annual recurring revenue already. By expanding its software stack and services, Nvidia not only locks in customers, but also moves up the value chain. This software-centric strategy is a powerful catalyst: it boosts margins, fosters customer loyalty, and opens Nvidia to growth beyond chip sales – for instance, through AI cloud services, enterprise support contracts, and developer platform fees – all of which support a higher long-term valuation.
7. Omniverse and Digital Twin Leadership – Strength: 7/10
Nvidia is spearheading the use of AI and graphics in simulation, positioning its Omniverse platform as the standard for industrial metaverse applications and digital twins. Omniverse is a real-time 3D simulation and collaboration platform that enables companies to create virtual worlds – “digital twins” of products, factories, cities, and even data centers – with physical accuracy. This initiative is forward-looking and strategic: it drives demand for Nvidia’s professional GPUs and AI software as more industries embrace simulation for design, engineering, and operations. Recent developments underscore Omniverse’s momentum: at GTC 2025, Nvidia announced an expansion of Omniverse with major partners like Ansys, Siemens, SAP, and Schneider Electric integrating it into their solutions to build smarter factories, robots and AI-driven facilities.
In other words, leading industrial software providers are embedding Nvidia’s metaverse platform to help enterprise customers digitize their operations. The Omniverse allows engineers to visualize complex systems and test scenarios virtually – for example, designing a gigawatt-scale AI data center in simulation (including cooling and electrical systems) before building it in reality. Automakers use Omniverse to simulate autonomous driving; architects create virtual building models; manufacturers test production line changes in a risk-free virtual space. As this “industrial metaverse” trend grows, Nvidia’s early lead could yield a new ecosystem (and revenue source) of Omniverse software subscriptions, cloud services, and associated hardware sales. While still emerging, the platform’s potential is significant – it extends Nvidia’s reach into every field that uses simulation or 3D design, leveraging its core strengths in graphics and AI. In the coming years, Omniverse-driven demand for GPUs (for rendering and physics simulation) and software could become a notable catalyst augmenting Nvidia’s more mature segments.
8. Continuous Innovation and Product Roadmap – Strength: 9/10
Nvidia’s planned GPU hardware roadmap through 2027 (Ampere/Hopper to Blackwell to Rubin architectures) demonstrates its aggressive cycle of innovation, with each generation delivering major leaps in AI performance.
A key reason Nvidia maintains its edge is relentless R&D yielding regular leaps in performance – a pipeline of new GPUs and systems that keep customers upgrading. The company’s roadmap beyond mid-2025 is packed with heavyweight launches. Its current flagship data-center GPU family, Blackwell, only ramped production in early 2025, yet Nvidia is already preparing the next architecture, codenamed “Rubin,” for 2026. CEO Jensen Huang has affirmed that Blackwell Ultra GPUs (a mid-cycle upgrade with faster memory and networking) will debut in late 2025, followed by the next-generation Rubin GPU platform shortly thereafter. Partners are “getting up to speed” on Rubin, which is expected to provide a “huge step up” in AI capability. In fact, Nvidia has outlined a cadence of major launches every even year (2024 Hopper → 2026 Rubin → 2028 Feynman, etc.), with incremental updates on odd years. This rapid pace matters for the stock: each new generation spurs a replacement cycle as cloud firms, enterprises, and supercomputing centers upgrade to unlock higher efficiency.
For instance, the Blackwell-based systems offer up to 1.5× the performance of the prior Hopper chips, and Rubin is expected to jump even further, enabling more advanced AI models (critical as the industry chases artificial general intelligence). Nvidia’s ability to consistently deliver order-of-magnitude improvements – e.g. through more memory (HBM4E), faster interconnects, and specialized AI cores – encourages customers to expand their Nvidia-powered infrastructure. In turn, it deters competitors who struggle to match Nvidia’s R&D breadth. This continuous innovation cycle ensures that as AI workloads grow, Nvidia will have the cutting-edge products ready – keeping demand (and revenue growth) on an upward trajectory.
9. Full-Stack Expansion (CPUs, DPUs & Networking) – Strength: 8/10
Nvidia is evolving from a pure GPU vendor into a full-stack data center platform provider, expanding into CPUs, networking, and data processing units (DPUs). This strategic broadening of its product portfolio substantially increases Nvidia’s addressable market and lets it capture more value per system. Notably, Nvidia’s homegrown CPU (central processor), codenamed Grace, began shipping to customers in 2024–2025. Grace is a high-performance Arm-based CPU designed to pair tightly with Nvidia GPUs, capable of handling enormous data flows between chips – a crucial advantage for AI and HPC workloads. By offering its own CPU, Nvidia can sell complete server platforms (CPU+GPU) and optimize the whole system for AI. Jensen Huang highlighted that integrating GPUs with CPUs can boost computing speeds by 100× while only tripling power usage, underscoring the efficiency gains of Nvidia’s full-stack approach.
Alongside CPUs, Nvidia has invested in networking and interconnects (acquiring Mellanox in 2020) and now leads in ultra-fast data center networks. Its latest Spectrum-X switches and ConnectX/BlueField SmartNICs (DPUs) are built to alleviate data bottlenecks in AI supercomputers. Industry analysts predict rapid growth in this DPU/SmartNIC space (a ~$5.5 billion market by 2031), and Nvidia is well positioned to dominate it with BlueField. By selling DPUs and switches alongside GPUs, Nvidia ensures that AI clusters can scale out efficiently, which is a key selling point for cloud providers. Importantly, these moves encroach on traditional CPU and networking incumbents – every Nvidia Grace CPU or BlueField DPU sold potentially displaces a competitor’s chip, consolidating more of the data center stack under Nvidia. The full-stack strategy thus acts as a force-multiplier for growth: Nvidia can address virtually every component of AI infrastructure, from processing to networking to storage acceleration. As customers increasingly prefer integrated solutions, Nvidia’s ability to provide the “entire package” drives incremental revenue and strengthens its competitive moat in the AI infrastructure market.
10. Global AI Infrastructure & New Markets – Strength: 8/10
Nvidia’s growth is set to benefit from international expansion and a wave of government-driven AI infrastructure investments. Around mid-2025, export policies began to favor Nvidia’s business, widening its reachable market. The U.S. Commerce Department’s rollback of certain AI chip export rules in May 2025 removed restrictions on which countries Nvidia can sell advanced AI chips to, easing a headwind that had weighed on the stock earlier. This policy shift, coupled with surging interest in AI globally, has unlocked huge orders from new regions. For instance, the Middle East is emerging as a major AI hub: the United Arab Emirates reached a preliminary agreement with the U.S. to import up to 500,000 of Nvidia’s high-end AI chips per year starting in 2025 – a massive volume aimed at making the Gulf a “third AI power center” alongside the US and China. Similarly, Saudi Arabia has announced plans to invest hundreds of billions in tech and is buying a TON of Nvidia chips for its own “AI factories” as part of a $600 billion investment pledge in U.S. and AI infrastructure.
These moves reflect a broader “sovereign AI” trend: governments and enterprises worldwide are building domestic AI supercomputers (for national security, research, or competitive advantage) – and Nvidia is the go-to supplier for the requisite hardware. Additionally, markets like India, Southeast Asia, and Latin America are ramping up cloud data center builds and AI initiatives, representing new growth frontiers for Nvidia’s datacenter GPUs. Even in China – despite ongoing export controls – Nvidia has navigated restrictions by offering modified chips (like the A800/H800) to continue serving demand. Altogether, the global arms race in AI computing acts as a tailwind for Nvidia: it guarantees a steady stream of orders from across the world. With geopolitical allies now explicitly allowed (and eager) to procure Nvidia’s top chips, the company stands to fill the AI compute gap globally, driving revenue growth beyond the traditional U.S. customer base. In summary, expanding international markets and large-scale AI infrastructure projects are a catalyst that could propel Nvidia’s next phase of growth.
Sources: The analysis above incorporates information from recent Nvidia financial reports, press releases, and expert commentary, including Nvidia’s FY2025 earnings, CEO Jensen Huang’s statements on AI demand, analyst insights on spending and growth forecasts, and news of key deals and policy changes affecting Nvidia. These catalysts underscore Nvidia’s unique positioning at the intersection of AI hardware, software, and global adoption, suggesting that from mid-2025 onward, the company has multiple powerful growth drivers supporting its stock’s long-term trajectory.
SPY New All Time Highs IncomingThe #SPY weekly chart is so bullish but don't take my word for it.
Simply look at the weekly bullish crossover that occurred between the 7 week & the 20 Week MA.
The last time this occurred was in Nov 2023 and the markets ripped 19% before having a major 3 week pullback and then another soaring continuation higher.

Bullish Intraday Patterns Everywhere!SPX had a wonderful intraday hourly chart confirmed breakout. This pattern is bullish and likely will continue higher.
The bulls tomorrow would love to confirm the daily chart breakout and will try to push for that.
SPY/SPX is holding more relative strength than the Q's & IWM which is displaying broad participation.
There are many bullish charts showing accumulation, golden crosses and bullish MA crossovers.
The DXY appears to be wanting to break down to around $97.00 which should yield more upside.
We secured profits today on SPY 594 calls & NVDA 144 calls.
We still remain net long and see the S&P 500 over $6000
Apple, XYZ, AI - are bullish setups were continuing to manage.
