Nvidia Posts Another Blowout Quarter. What Can Slow It Down?Hint: Not much.
🚀 Earnings So Good You Can’t Ignore ‘Em
Another quarter, another jaw-dropper from Nvidia NVDA . In what has basically become a quarterly ritual at this point (congrats to all who celebrate!), Jensen Huang’s silicon empire posted revenue of $44.1 billion , soaring past the $43.3 billion consensus.
That’s a 69% year-over-year gain, in case anyone’s still doing the math. Adjusted earnings of 81 cents per share also easily crushed expectations.
Shares popped 5% in after-hours trading Wednesday and then pulled back a little bit during the cash session on Thursday — not quite a moonshot, but a confirmation that even if Nvidia’s guidance was meh, this earnings report was meh’gnificent.
So what exactly is fueling this unstoppable juggernaut? And is there anything that could actually throw a wrench in the gears? Grab your chips (there’s your pun), let’s break it down.
💾 Data Centers: The Company’s Cash Cow
If Nvidia is famous for anything, it’s that it’s really able to see the trend before the crowds pick it up. From gaming, to crypto… and now? The star of the show now is data centers. But there's not just any growth. We’re talking $39.1 billion in data center revenue, up 73% from last year. That’s nearly 90% of Nvidia’s entire business. Not exactly fans of revenue diversification, are we?
Big Tech is gorging on Nvidia’s AI chips like it’s an all-you-can-eat GPU buffet. Amazon NASDAQ:AMZN , Google NASDAQ:GOOGL , and Microsoft NASDAQ:MSFT alone account for nearly half of that segment.
Basically, if you’re building anything with the words “large language model,” “AI agent,” or “sovereign compute,” you’re probably writing big checks to Nvidia.
🇨🇳 About That $10.5 Billion Problem
Thanks to Trump’s H20 export ban, Nvidia’s revenue from China is expected to take a $10.5 billion hit over two quarters. That’s an $8 billion crater forecasted for the current quarter, on top of a $2.5 billion gap in the previous one.
Is that bad? Maybe. Does anyone care right now? Not really.
Because here’s the kicker: demand outside China is so nuclear that even subtracting ten billion bucks over six months doesn’t materially derail the bullish narrative. Nvidia’s still forecasting $45 billion in revenue this quarter, which is basically flat — but considering what’s missing, that’s a win in disguise.
📦 Blackwell to the Rescue
The forward guidance may have missed the Street’s expectations — Nvidia projected Q2 revenue of $44–$46 billion, versus the $45.9 billion consensus — but CEO Jensen Huang already served the antidote: Blackwell Ultra.
These next-gen chips are already shipping to early customers. They promise to be leaner, meaner, and more power-efficient — basically, think McLaren but for AI accelerators. And they’re expected to ramp up aggressively in the back half of the year.
That means Nvidia has a new growth lever just waiting to be pulled. Some overly bullish analysts say it could eclipse the H100’s success.
💡 The Real Moat? It’s Not Just the Chips
What makes Nvidia such a rare beast isn’t just its hardware. It’s the ecosystem — CUDA, software stacks, developer tools, APIs, vertical integrations. It’s like Apple, but for the AI industrial complex.
Everyone wants to build an AI empire, but good luck doing it without Nvidia’s infrastructure. It’s not just expensive — it’s essential.
In the meantime, AMD NASDAQ:AMD and Intel NASDAQ:INTC are trying. There’s chatter about custom silicon from OpenAI (still a private company) and Meta $META. But for now, the moat around Nvidia looks more like a canyon.
🧨 So What Could Slow It Down?
But let’s not get carried away — there are still some real risks on the radar. Here’s what might actually trip up the AI king:
Geopolitical shocks: More export bans? Chinese retaliation? Taiwan tension? Any of these could make markets twitchy.
Supply chain constraints: As demand grows, so does pressure on foundries like TSMC 2330 . Any hiccups in advanced packaging or wafer starts could pinch margins.
Rising competition: AMD’s MI300 is no slouch. And Big Tech is building in-house chips to lessen reliance on Nvidia.
AI fatigue: If the AI hype cycle fizzles out or hits a plateau (remember the metaverse?), that could cool capital spending. It only takes 3-4 tech titans to pull their capex and Nvidia’s reign is over.
But until any of that materializes, the narrative for many is "Buy the dip — Jensen’s grip won’t slip."
💫 What’s Priced In?
The stock’s P/E is still sky-high, and the multiple implies several more years of 50–60% annual revenue growth. That’s hard to sustain indefinitely. But then again, so was becoming the second-largest company in the world… (and the biggest one, if only for a while ) and here we are.
Nvidia’s valuation is steep, but not unjustified — as long as it keeps executing. And judging by any of the previous quarters going back to 2023, execution isn’t a problem.
👩🏻🚀 More Than a Stock — Macro Theme
At this point, Nvidia has transcended chipmaker status. It’s now a macro story. Betting on Nvidia is betting on AI. It’s betting on infrastructure. It’s betting on the next industrial revolution in software, automation, and language models.
So… what can stop it? Share your thoughts in the comment section!
NVDA

NVIDIA 1D — When “Head & Shoulders” Aren’t Just for the GymOn the daily chart, NVDA has broken out of the descending channel and reclaimed the 50-day moving average (MA50), triggering a classic inverted head and shoulders formation. Price is now holding above the key $113–$114.50 zone, confirming a structural shift. As volume picks up, buyers are eyeing the next levels of resistance.
Near-term upside targets: – $119.80 (0.5 Fibonacci) – $127.62 (0.382) – $137.28 (0.236) — primary resistance zone – Extended target — $152.91 (1.0 Fibonacci projection)
Technical setup: — Breakout from channel + above MA50
— Inverted head and shoulders pattern completed
— $114.50–$118.00 now acts as buyer support
— EMA and MA convergence supports trend reversal
— Increasing volume on rallies supports bullish momentum
Fundamentals: NVIDIA remains the AI and semiconductor sector leader. Growing demand for high-performance GPUs in AI and data centers positions NVDA as a core tech play. Expectations of strong earnings and continued institutional accumulation support the bullish narrative.
The confirmed breakout and inverted H&S setup mark a clear structural reversal. As long as price stays above $114.50, the path toward $127–$137 remains the primary target zone, with $152.91 in sight if momentum continues.

Nvidia - The bullish consolidation flag!Nvidia - NASDAQ:NVDA - is still quite bullish:
(click chart above to see the in depth analysis👆🏻)
After Nvidia retested a major horizontal support just last month, we witnessed an extremely strong bullish reversal candle which resulted in a strong +50% rally. Considering the bullish flag consolidation, a breakout is much more likely, but not in the immediate future.
Levels to watch: $150
Keep your long term vision!
Philip (BasicTrading)

SPY, SPX, IWM, Natural Gas, NVDA, XYZ, AI - Analysis- Markets sold off into the NVDA rally this morning.
- Small afternoon rally turned indices back green
- Major pre market high levels up ahead likely allow us to push higher in coming days.
- NVDA should retest its premarket high levels.
- Profits secured on AI calls!
- Structurally indices are still bullish and remain above key levels.
- Yields see nasty reversal lower and look to be going down.
- Natural Gas trying to lure investors with a bottoming tail - but i think its false hope.

Nvidia Maintains Bearish Bias After EarningsNvidia released its quarterly earnings yesterday, and since then, market confidence triggered a significant bullish gap that pushed the stock price up by nearly 5%. However, in recent hours, a new bearish bias has started to emerge, steadily closing the gap as the market digests the company’s latest report.
Nvidia reported $44 billion in revenue, slightly above the $43 billion expected, while earnings per share (EPS) came in at $0.77, below the $0.87 forecast. Nevertheless, the most notable aspect of the report was the announcement of an estimated $8 billion revenue loss due to U.S. export restrictions. In response, CEO Jensen Huang strongly criticized these measures, warning that they could negatively impact the company’s performance in the coming months.
Uptrend Channel Remains Intact
Since early April, Nvidia has maintained a steady upward channel. Although a slight bearish bias has emerged recently, it is not yet strong enough to pose a threat to the broader bullish trend seen in recent months. Therefore, this technical structure remains the most important pattern for the upcoming sessions.
Technical Indicators:
RSI: The Relative Strength Index has begun to show signs of a possible bearish divergence, as lower highs on the RSI contrast with higher highs in the stock price. This mismatch could signal short-term corrective movements.
MACD: The MACD, meanwhile, continues to oscillate around the zero line, indicating a balance between buying and selling pressure. As long as the histogram remains near this level, it suggests neutral momentum in price direction.
Key Levels to Watch:
$140 USD: Current resistance level where short-term selling pressure may emerge.
$150 USD: Distant resistance around January highs. A breakout toward this level could support a stronger bullish channel.
$125 USD: Important support that coincides with the 200-period moving average. A bearish move toward this level could break the current bullish formation.
Written by Julian Pineda, CFA – Market Analyst

Nvidia Stock Price Rises Over 4% Following Earnings ReportNvidia (NVDA) Stock Price Rises Over 4% Following Earnings Report
Yesterday, after the main trading session, Nvidia released its quarterly earnings report, which exceeded analysts' expectations:
→ Earnings per share: actual = $0.81, forecast = $0.73
→ Revenue: actual = $44 billion, forecast = $43.3 billion
Additionally, according to media reports, Nvidia issued a strong forecast for the next period, although CEO Jensen Huang noted difficulties in accessing the Chinese market, which he estimates to be worth $50 billion.
Nevertheless, market participants reacted positively. According to Google, in after-hours trading the NVDA stock price rose by more than 4%, surpassing the $140 level.
It is reasonable to assume that this initial positive reaction could continue during today’s main trading session.
Technical Analysis of NVDA Chart
As we mentioned earlier this week, NVDA stock in 2025 has formed a broad descending channel (shown in red), and just before the earnings release, the price was consolidating near the upper boundary of this channel.
We also suggested a scenario in which the bulls might attempt to break through the upper boundary of the channel. Given the positive earnings report and the stock market rally following the Federal Court’s decision declaring Trump tariffs invalid, the likelihood of this scenario increases.
This, in turn, means that:
→ the upper boundary of the channel, once broken, may act as support;
→ we may once again see the key psychological resistance level of $150 come into play — a level we have highlighted multiple times before.
This article represents the opinion of the Companies operating under the FXOpen brand only. It is not to be construed as an offer, solicitation, or recommendation with respect to products and services provided by the Companies operating under the FXOpen brand, nor is it to be considered financial advice.

AAPL 2025 Strategic Outlook: Overview of Primary CatalystsAfter trading around $200 intraday on May 27, Apple shares closed at $200.21—up 2.5% despite broad market headwinds and lingering investor skepticism.
Technical outlook remains bullish, as price action is still defined by
a rising bullish channel on higher time frames. expecting AAPL to bottom
out heading into Q3/Q4 2025 and then another bull run of 70-80%.
Here are the primary catalysts shaping Apple’s stock price in 2025, ranked 0–10:
AI integration and Apple Intelligence
Strength: 9/10
Rollout of on-device AI features (upgraded Siri, generative image tools, ChatGPT integration) expected to drive a renewed iPhone upgrade cycle.
Services segment growth
Strength: 8.5/10
App Store, Apple Music, iCloud and other services projected to grow double-digits, with new AI services adding billions in revenue.
Gross margin expansion and cost efficiencies
Strength: 8/10
Shift toward higher-margin services and anticipated memory price declines could boost overall gross margin by roughly 50 basis points.
iPhone 17 product cycle
Strength: 7.5/10
Rumored polymer battery improvements and possible foldable models may spur meaningful hardware upgrades versus Android peers.
Vision Pro and hardware diversification
Strength: 7/10
Mixed-reality headset upgrades under Apple Intelligence will broaden appeal, though high price and modest enterprise traction limit near-term impact.
Share buybacks and dividend policy
Strength: 7/10
A planned $100 billion buyback in 2025, plus steady dividends, underpins valuation, though recent pullbacks hint at caution amid cost headwinds.
Supply-chain diversification and trade policies
Strength: 6.5/10
Ongoing U.S.-China tensions and potential tariffs create uncertainty; pivoting assembly to India and Vietnam helps mitigate risk.
Regulatory and antitrust pressures
Strength: 6/10
New EU rules may force Apple to open parts of its ecosystem, potentially weighing on Services revenues.
Macro and interest-rate environment
Strength: 5/10
A “higher-for-longer” Fed rate outlook raises discount rates on growth, tempering valuations for tech leaders.
Smartphone market competition
Strength: 5/10
Samsung and fast-growing Chinese OEMs intensify price and feature competition, especially in emerging markets.
⭐️Catalyst Strength Rankings (May 2025)
✅AI integration and Apple Intelligence: 9
✅Services segment growth: 8.5
✅Gross margin expansion and cost efficiencies: 8
✅iPhone 17 product cycle: 7.5
✅Vision Pro and hardware diversification: 7
✅Share buybacks and dividend policy: 7
✅Supply-chain and trade policy risk: 6.5
✅Regulatory and antitrust pressures: 6
✅Macro and Fed policy: 5
✅Smartphone competition: 5

SHORT Nvidia, Bearish Chart Setup, Resistance ConfirmedThe resistance from 21-May has been confirmed 28-May.
The same level has been working as resistance since 14-May.
After two weeks, this resistance level continues to hold and it is now confirmed.
In November 2024 NVDA produced a high.
Later in January 2025 NVDA produced an all-time high.
18-February 2025 NVDA went to produced a lower high; a rejection that led to a major drop.
The major drop resulted in a recovery and the recovery found resistance earlier this month. This resistance, the same from 14-May, 21 and 28-May, is also a lower high compared to the previous levels just mentioned.
The signal here is double: (1) Resistance confirmed and (2) a lower high.
There is one more. 28-May produced a volume breakout day. The day ended up closing red. So, Nvidia is confirmed bearish now.
Thank you for reading.
Namaste.

SPX Bullish Patterns Emerging ahead of NVIDIA EarningsThe SP:SPX has taken out some major pivots and recaptured the ever so important daily 200 MA.
across multiple time frames some very interesting bullish patterns are emerging.
All eyes will be in NASDAQ:NVDA earnings tonight after the bell.
If NVIDIA beats and guides it will breakout of an epic bull flag pattern that will likely casue this market to trend to new All time highs.
Probabilities from a technical pattern standpoint are pointing towards higher price action.
We have already broken out and back tested key support levels and the buying is clearly being observed.
We remain net long with positions already in profit.

TSLA New ATH incoming? Overview of primary catalysts.After trading between $346 and $365 intraday on May 27, Tesla shares closed at $362.89—up modestly despite broader market headwinds and lingering investor skepticism.
Here’s a detailed breakdown of the primary catalysts shaping Tesla’s stock price (ranked 0–10):
1. Electric Vehicle Demand Growth
Strength: 9/10
Global EV adoption remains the single largest driver of Tesla’s top line. Despite slowing sales in Europe and China, overall EV penetration continues to surge as consumers shift away from internal-combustion engines.
2. Launch of Affordable Model (Entry-Level EV)
Strength: 8.5/10
Elon Musk has reiterated plans to unveil a sub-$25,000 EV in early 2025, targeting the mass market. Investors cheered a recent reaffirmation of focus on core products over peripheral projects.
3. Battery Cost Reductions & Margin Expansion
Strength: 8/10
Tesla’s relentless drive to lower battery pack costs underpins both profitability and price competitiveness. Q4 cost of goods sold dipped below $35,000 per vehicle, even as margins softened amid mixed volumes.
4. Autonomy & Robotaxi Progress
Strength: 7.5/10
Commercial robotaxi trials are slated to begin in Austin in June 2025, with a dedicated Cybercab in development. While regulatory and safety hurdles loom, the promise of recurring software subscription revenue could be transformative.
5. Competition from Other EV Manufacturers
Strength: 7/10
Legacy automakers and startups alike are ramping up EV offerings. Tesla’s U.S. market share has declined in recent years, highlighting intensifying pressure in key regions.
6. U.S.–China Trade Policies & Tariffs
Strength: 6.5/10
Fluctuating tariffs on Chinese EV imports have led to order suspensions and forecasting challenges. Trade-policy uncertainty remains a wild card given Tesla’s global supply chain.
7. Regulatory Incentives & Subsidies
Strength: 6/10
U.S. federal tax credits under the Inflation Reduction Act and similar programs in Europe and China support EV demand—and Tesla’s eligibility criteria will influence its market growth.
8. Commodity Price Volatility (Lithium, Nickel, Cobalt)
Strength: 5.5/10
Raw material cost swings can erode margins. While long-term supply agreements help, spot shortages or price spikes remain risks.
9. Fed “Higher for Longer” Interest Rate Environment
Strength: 5/10
Elevated real yields reduce the appeal of high-growth names like Tesla. A sustained hawkish stance from the Fed could continue to cap valuations, similar to how it weighs on non-yielding assets.
10. Corporate Governance & Elon Musk’s Public Profile
Strength: 4/10
Musk’s high-profile engagements and occasional controversies can politicize the brand, prompting sentiment-driven stock swings.
Catalyst Strength Rankings (May 2025)
🔸 EV demand growth: 9
🔸 Affordable Model launch: 8.5
🔸 Battery cost & margins: 8
🔸 Autonomy/robotaxi progress: 7.5
🔸 Competition: 7
🔸 Trade & tariffs: 6.5
🔸 Regulatory incentives: 6
🔸 Commodity costs: 5.5
🔸 Fed rates: 5
🔸 Musk profile: 4
Analyst Forecasts for 2025
| Analyst / Consensus | 12-Month Price Target | Rating |
| --------------------------- | --------------------- | ------------ |
| High | \$470.00 | – |
| Median | \$306.00 | Hold/Neutral |
| Low | \$115.00 | – |
| Average (Consensus) | \$306.29 | Hold |
| Dan Ives (Wedbush) | \$315 | Outperform |
| Adam Jonas (Morgan Stanley) | \$430 | Overweight |
* Consensus sees a range of \$115–\$470 with an average near \$306.
* Dan Ives trimmed his target from \$550 to \$315, citing tariff risks and political headwinds.
* Adam Jonas remains bullish with a \$430 target, viewing Tesla as an “embodied AI compounder” despite near-term brand challenges.
Where to Next for Tesla?
* Current price: \~\$362.89
* Key support levels: \$350 and \$340
* Next technical floor: \$330
* Upside triggers: Stronger-than-expected delivery volumes, breakthrough in full-self-driving (FSD) reliability, or renewed cost cuts.
Tesla’s stock remains a balance between long-term disruptive potential and short-term execution risks. While EV adoption and autonomous ambitions underpin a compelling growth narrative, margin compression, competitive pressures, and macro uncertainties will dictate volatility in the months ahead.

What to Watch in Nvidia Earnings and Key Technical LevelsStock markets around the globe are turning their focus to one key earnings report: Nvidia. AI has been the primary driver of the U.S. stock market over the past few years, and Nvidia’s earnings are widely viewed as the best indicator of growth in the AI sector. The correlation between Nvidia and broader U.S. stock performance as well as its influence on global equities, crypto, and FX is strong enough for the world to fixate on this report.
Nvidia is expected to report $0.88 EPS for the first quarter of FY2026, representing a 43.36% year-over-year increase, but a slight decline quarter-over-quarter. The company previously guided revenue between $42.14 billion and $43.86 billion, with market consensus currently at $43.317 billion, in line with that range.
The key revenue stream, Data Center, is expected to generate $39.357 billion, reflecting 74.44% growth. Some analysts are forecasting as high as $42.051 billion for this segment alone.
At a forward P/E ratio of 27.6x, Nvidia is trading well below its 1-year (32.1x), 2-year (33.7x), and 5-year (40.1x) historical averages. This more favorable valuation, coupled with strong AI tailwinds, could present a solid medium- to long-term buying opportunity if earnings and guidance support the growth narrative.
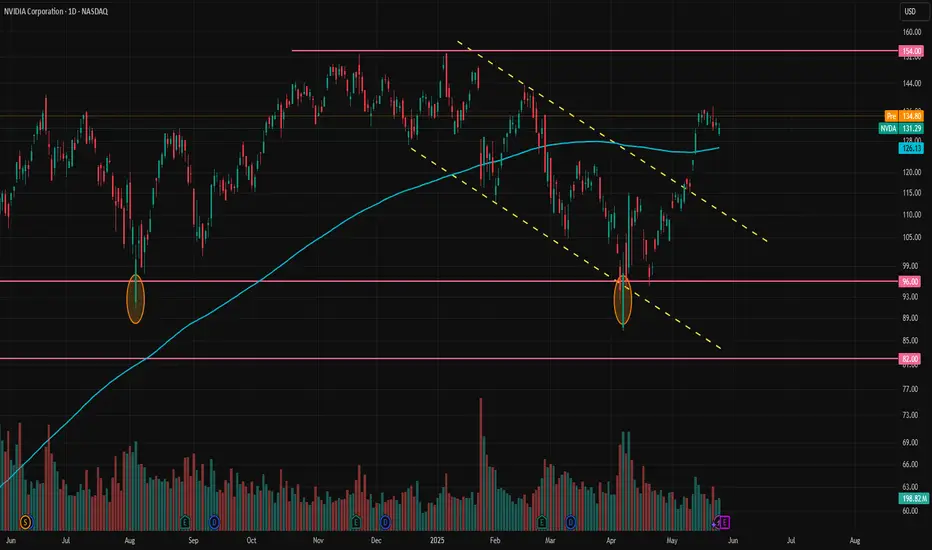
After breaking out of the downtrend, NVDA approached the 140 resistance level but failed to break through. Following the upcoming earnings release, if Nvidia pulls back to either 118 or 110, those levels could present buying opportunities, assuming the report isn’t significantly negative.
It’s worth noting that sometimes real market expectations run much higher than the analyst consensus, which can lead to a selloff even after a strong earnings report.
The 154 level remains the key resistance for now, and in our view, a breakout this week carries a relatively low probability. If the report tomorrow exceeds expectations, 154 could still act as a barrier and trigger some profit-taking by Nvidia bulls.
ALTCOIN ROADMAP: REVISITED!!! Ethereum vs NvidiaOne of the most insightful ratio charts that provides a remarkable glimpse into the vitality of Altcoins and the appetite for risk is when Ethereum outshines one of the fastest rising stars in the stock market, #NVDA!
The conventional Altcoin index indicates how many of the top 100 Altcoins are outperforming #BTC.
This is indeed a valuable metric that we can rely on for identifying peaks.
However, I believe that if we broaden our perspective and examine the ETH ratio against a Tech Titan, we can truly pinpoint the timing of the banana zone. When it starts and when it is confirmed violent uptrend.
My interest in this ratio was sparked when ETH was still a proof of work coin, validated through GPUs; it seemed like a natural starting point to assess whether the ETH price was overvalued or undervalued.
Even after the transition to POS, I still think it’s worth analysing, as shown by the recent double bottom on the ratio!
The next crucial question is when we can break the multi-year downtrend to genuinely confirm the Banana zone. Because without ETH, there’s no party.
If we enter a big strong banana zone, I believe the ratio could swiftly trend towards 100, so we will be keeping a close eye on it!

What’s Happening with Nvidia (NVDA) Ahead of Earnings?What’s Happening with Nvidia (NVDA) Ahead of Earnings?
After an extended weekend due to Veterans Day in the US (observed on Monday), financial markets are returning to active trading. The highlight of the week will be Nvidia’s (NVDA) earnings report, scheduled for Wednesday after the close of the main trading session.
What You Need to Know Ahead of Nvidia’s Earnings
According to media reports, market participants are concerned about:
→ escalating trade tensions between the US and China;
→ increasing competition;
→ Nvidia’s premium pricing at a time when the GPU market is shifting towards more affordable alternatives;
→ downward revisions to earnings per share, which some interpret as a sign that Nvidia’s report may fall short of expectations.
On the other hand, Reuters reports that Nvidia is set to unveil a new processor that:
→ is designed specifically for AI applications;
→ is based on the Blackwell architecture;
→ will not be subject to US export restrictions on chips sent to China;
→ is expected to be cost-effective.
Technical Analysis of Nvidia (NVDA) Stock
Today’s NVDA price chart suggests that the descending channel (marked in red) may be forming a large bullish flag — a continuation pattern that typically indicates a potential resumption of the uptrend after a corrective phase.
Price action in Nvidia stock has slowed near the upper boundary of the channel — a sign of temporary equilibrium between supply and demand (this could also be interpreted as traders adopting a wait-and-see stance ahead of the earnings release).
Given that the earnings report is a potentially strong price catalyst, a breakout from the bullish flag cannot be ruled out. Such a move could signal the start of a new phase in NVDA’s long-term upward trend (as indicated by the arrow on the chart).
This article represents the opinion of the Companies operating under the FXOpen brand only. It is not to be construed as an offer, solicitation, or recommendation with respect to products and services provided by the Companies operating under the FXOpen brand, nor is it to be considered financial advice.

NVDA - 140 Quasimodo?Well NVDA has exceeded the 120 PoC from the last year, and other than the head and shoulders developing it looks rather bullish above that 120. But I would sell 140, or at least not buy.
And if I'm buying I'd probably wait for 112. Think I will wait forever? 😂
Will update after we get some more data.

$NVDA bull flag potentialNASDAQ:NVDA setting up with a bull flag formation on the daily. A strong ER with good guidance can get us to 140-145. A less than stellar guidance can break the bull flag thesis and send it back to the 120-125 range, with some gaps below.

NVDA NVIDIA Corporation Options Ahead of EarningsIf you haven`t bought NVDA before the previous earnings:
Now analyzing the options chain and the chart patterns of NVDA NVIDIA Corporation prior to the earnings report this week,
I would consider purchasing the 131usd strike price Puts with
an expiration date of 2025-6-20,
for a premium of approximately $7.00.
If these options prove to be profitable prior to the earnings release, I would sell at least half of them.
I`m overall bullish long term on NVDA.
Disclosure: I am part of Trade Nation's Influencer program and receive a monthly fee for using their TradingView charts in my analysis.

NVDA Weekly Options Trade Plan 2025-05-25NVDA Weekly Analysis Summary (2025-05-25)
Model Summaries Grok/xAI: Mixed technical signals—bullish on daily, bearish on 5-minute; neutral overall; no trade recommended (55% confidence). Claude/Anthropic: Moderately bearish; recommends buying the $128 put at ~$3.60 for a 50–100% profit target; confidence 72%. Llama/Meta: Moderately bearish but views premium/risk as unfavorable for buying; instead suggests selling the $130 put; confidence 70%. Gemini/Google: Strong intraday bearish technicals and negative sentiment; recommends buying the $120 put at ~$1.24 as a day trade; confidence 65%. DeepSeek: Moderately bearish but sees premiums >$1 as too rich; no trade recommended (55% confidence). Areas of Agreement and Disagreement Agreement: • Overall moderately bearish bias for NVDA into weekly expiry. • Rising VIX, max-pain near $126, and negative news support downside. Disagreement: • Trade/no-trade: Grok and DeepSeek pass, Claude, Gemini and Llama propose trades. • Strike selection: Claude prefers $128 put; Gemini $120 put; Llama sells $130 put. • Strategy type: All bearish ideas are buy puts except Llama, which suggests naked put selling. Conclusion Overall Market Direction: Moderately Bearish for the week ending 2025-05-30. Recommended Trade: Buy a weekly put to capture the expected pull toward the $126 max-pain level. • Instrument: NVDA 2025-05-30 $128 Put • Entry Timing: At market open • Entry Price: $3.65 (ask) • Profit Target: $5.48 (≈50% gain ⇒ midpoint sell or scale) • Stop Loss: $2.56 (≈30% loss) • Size: 1 contract Confidence Level: 70% Key Risks and Considerations: • Intraday oversold conditions could trigger a short-term bounce. • Theta decay accelerates late in the week—need timely exit. • Holiday-shortened week may damp momentum. • Liquidity is good at the $128 strike but bid-ask spread and slippage can impact execution.
TRADE_DETAILS (JSON Format)
{ "instrument": "NVDA", "direction": "put", "strike": 128.0, "expiry": "2025-05-30", "confidence": 0.70, "profit_target": 5.48, "stop_loss": 2.56, "size": 1, "entry_price": 3.65, "entry_timing": "open", "signal_publish_time": "2025-05-25 10:57:51 UTC-04:00" } 📊 TRADE DETAILS 📊 🎯 Instrument: NVDA 🔀 Direction: PUT (SHORT) 🎯 Strike: 128.00 💵 Entry Price: 3.65 🎯 Profit Target: 5.48 🛑 Stop Loss: 2.56 📅 Expiry: 2025-05-30 📏 Size: 1 📈 Confidence: 70% ⏰ Entry Timing: open 🕒 Signal Time: 2025-05-25 10:58:05 EDT
Disclaimer: This newsletter is not trading or investment advice but for general informational purposes only. This newsletter represents my personal opinions based on proprietary research which I am sharing publicly as my personal blog. Futures, stocks, and options trading of any kind involves a lot of risk. No guarantee of any profit whatsoever is made. In fact, you may lose everything you have. So be very careful. I guarantee no profit whatsoever, You assume the entire cost and risk of any trading or investing activities you choose to undertake. You are solely responsible for making your own investment decisions. Owners/authors of this newsletter, its representatives, its principals, its moderators, and its members, are NOT registered as securities broker-dealers or investment advisors either with the U.S. Securities and Exchange Commission, CFTC, or with any other securities/regulatory authority. Consult with a registered investment advisor, broker-dealer, and/or financial advisor. By reading and using this newsletter or any of my publications, you are agreeing to these terms. Any screenshots used here are courtesy of TradingView. I am just an end user with no affiliations with them. Information and quotes shared in this blog can be 100% wrong. Markets are risky and can go to 0 at any time. Furthermore, you will not share or copy any content in this blog as it is the authors' IP. By reading this blog, you accept these terms of conditions and acknowledge I am sharing this blog as my personal trading journal, nothing more.

Stock Market Forecast | TSLA NVDA AAPL AMZN META MSFT GOOGLStock Market Forecast | CME_MINI:NQ1! CME_MINI:ES1! SPY QQQ
Mag 7 Forecast | NASDAQ:TSLA NASDAQ:NVDA AAPL AMZN META MSFT GOOG

$NVDA $TSLA $META $AMZN – Triangle Squeeze Incoming?📊 Symmetrical triangle formations are building across these tech giants — and volatility is compressing.
🔍 What to watch:
📈 Breakout above upper trendline = bullish momentum
📉 Breakdown below lower trendline = bearish confirmation
📉 RSI on NASDAQ:NVDA is at 73.04 = overbought warning
⚠️ NASDAQ:NVDA earnings drop May 28, could be a trigger for resolution
These coils don’t last forever. Price is building pressure — and one strong candle could break the dam.
Stay sharp, and tighten your stops.
This is where risk management matters most.
👇 Which side are you betting on — breakout or breakdown?

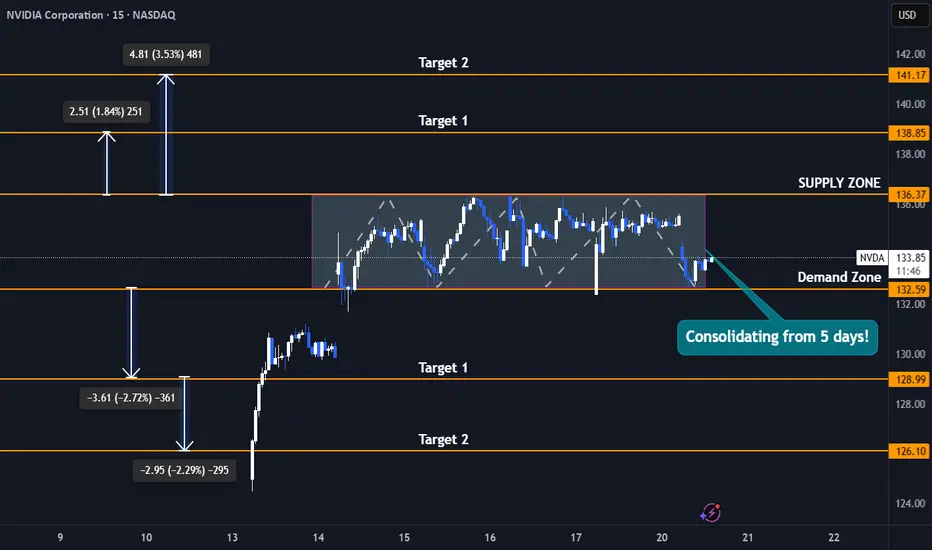
Nvidia Stock 5-Day Consolidation Breakout - Uptrend or Pullback?Trade Duration: Intraday
Trade Type: Breakout
- Nvidia is currently consolidating tightly between $132 and $136, forming a narrow range that reflects a balance between buyers and sellers unwilling to relinquish control. This range-bound action signals indecision, but it won’t last indefinitely.
- Typically, the longer the consolidation, the more significant the subsequent move. As new participants enter the market, a breakout—whether upward or downward—can trigger a powerful surge.
- This move is often amplified by breakout buyers joining in and stop-loss orders of trapped traders being triggered, creating an ideal setup for an intraday breakout trade.
- I plan to initiate either a buy or sell position depending on the breakout direction, capitalizing on the momentum generated by this tight consolidation phase.
Upside Targets : 138$ and 141$
Downside Targets : 128$ and 126$
DOUBLED MONEY in 3 days! $6/share win for $0.50/share stop loss!🔥 +100% in 3 days ✅ $6 to $12 Swing Pick buy on Friday before market close at $6 NASDAQ:ASST
Just 3 days later it's $12 for a mega win!
And to make that much better the risk was only $0.50 per share while going for $6/share win so 1:12 risk/reward ratio

$NVTS is up 125%, but they might not be done yet!NASDAQ:NVTS Could see more upside if...
We close the week above $4.66 Double Bottom Breakout. This would lead us to the following targets...
🎯$6📏$7.76
- Bullish cross on H5_L indicator
- Volume shelf launch with GAP
- NASDAQ:NVDA Partnership
- Small Cap
- High Short Float

SHORT | NVDANASDAQ:NVDA
Key Observations:
Current Price Action:
Price: $131.80
Recent Drop: -2.58 (-1.92%)
Support and Resistance Levels:
Immediate Resistance: $134.70 to $138.83
This red zone represents a strong supply area where the price has historically faced selling pressure.
Immediate Support: $122.74 (Target Price 1)
Further Supports:
Target Price 2: $116.65 (Aligned with 0.5 Fibonacci Retracement)
Target Price 3: $108.38 (Previous structural low)
Trendlines:
Red Uptrend Line: Recently broken, indicating weakening bullish momentum.
Green Downtrend Line: Long-term resistance trendline from the previous Lower Highs (LH) is still intact and respected.
The break below the minor trendline suggests a corrective wave (4) might be in motion.
Fibonacci Levels:
0.382 Fib Retracement: $121.22
0.5 Fib Retracement: $116.22
These levels align with potential targets in a wave (4) corrective phase according to Elliott Wave theory.
Target Prices:
Target Price 1: $122.74
This is the closest demand zone and aligns with the 0.382 retracement—high-probability support.
Target Price 2: $116.65
Aligned with the 0.5 Fibonacci level and previous consolidation.
Target Price 3: $108.38
A major structural support and potential wave (4) bottom if market turns sharply bearish.
Summary:
NVIDIA Corporation (NVDA) is showing early signs of a corrective phase after failing to break through strong resistance in the $134–$138 range. The price rejected the resistance zone and is likely entering wave (4) correction. Key support levels to monitor are $122.74, $116.65, and $108.38, corresponding with Fibonacci retracement levels and historical price structure. A break below the short-term trendline increases the probability of a continued pullback before potentially resuming the uptrend in wave (5).
