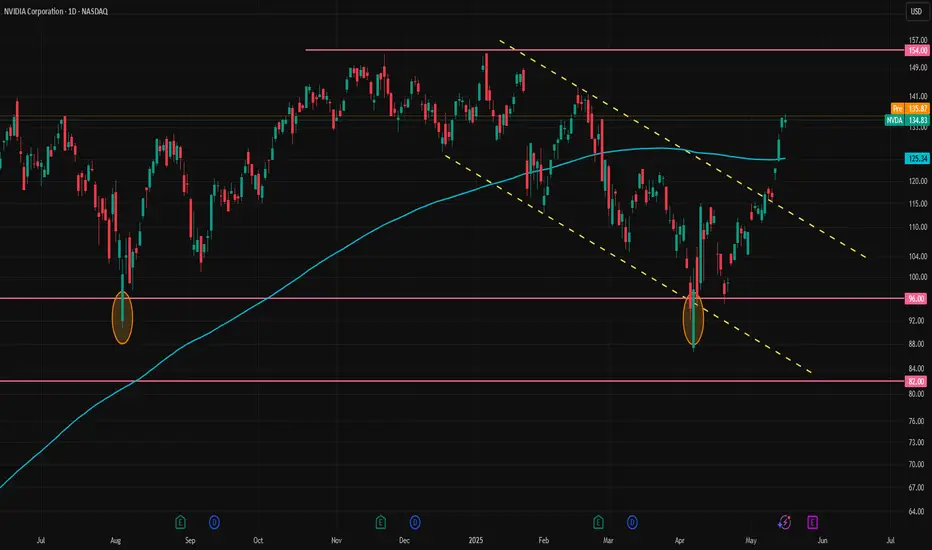
Possible Targets for Nvidia on Both Upside and DownsideNvidia has surged more than 55% since the early April dip and over 40% from the second dip, as expected in our earlier post. This massive rally was supported by a softening in trade policy (Bloomberg trade uncertainty index fell to 7.67 from 16.27), Nvidia's valuation being well below historical averages, and momentum sparked by Trump’s Middle East business trip.
Despite the surge, Nvidia still trades below its historical average based on forward price-to-earnings ratios. The stock has averaged a forward P/E of 32.2x over the past year, 34.2x over the last two years, and 40.2x over the past five years. Its current forward P/E stands at 28.4x. If Nvidia were to return to these averages, the implied price would be:
1-year average (32.2x): $153.04
2-year average (34.2x): $162.20
5-year average (40.2x): $190.79
However, relying on the 5-year average may not be ideal, as Nvidia’s explosive growth potential is no longer at the same trajectory it was five years ago. The 1-year average at $153.04 could be a more realistic near-term target.
Around the 1-year p/e price target, Nvidia has also a notable technical resistance. The stock has an infamous double top at $154 that has capped price advances twice before in November and January. This suggests that a short-term bet on further upside could be risky.
If Nvidia pulls back to around 120 level, however, it may offer a good buying opportunity, with upside potential toward 150 or higher, depending on the broader macroeconomic conditions at the time.
Please also check our earlier post:
NVDA
$QQQ Over $523.5 for a retest of Highs. Lower High Setup?As you can see on the notes in the chart, several 5 counts lead to sell offs in the last Quarter. Will this trend continue or will we run it to a 9 Count again? 3 Days left. Watch these levels as I have a possible selloff to May open Price. This would effectively follow my 10D chart forecast of new lows in the next 30-40 trading days, if not 20 for significant damage either way. I will continue to update as we go.

NVDIA Don't Miss Out
Overview:
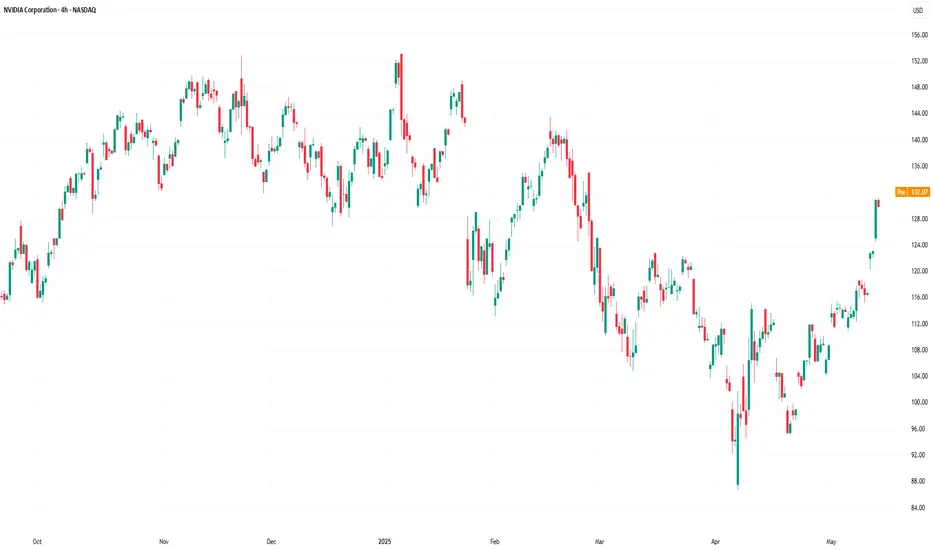
NASDAQ:NVDA is showing strong bullish momentum on the 2-hour chart, trading at $132.34 as of the latest candlestick. After a recovery from the March low of $88, the price is now testing a key resistance at $132.47. A breakout above this level could signal a continuation toward higher targets, supported by positive market sentiment and technical indicators.
Key Levels to Watch:
Resistance: $135.47
Next Target: $139.50 (psychological level and prior resistance)
Support: $116.24 (recent low, key support)
Trade Setup:
Direction: Buy on breakout
Entry: $133.50 (confirmation above resistance)
Profit Target: $139.50
Stop Loss: $125.00 (below recent pullback and 50-period MA)
Risk-Reward Ratio: 2:1 (Risk: $2.50, Reward: $5.00)
Follow for the Best Free AI Signals on the market
Ash.

Nvidia Overtakes Apple as 2nd-Biggest Company. Microsoft Next?Well, well, well — if it isn’t the GPU-maker-turned-global-tech-Goliath lapping the iPhone factory on the market cap leaderboard . Again.
Nvidia NASDAQ:NVDA has officially snatched the second-largest company title from Apple NASDAQ:AAPL , bringing its market cap north of $3.3 trillion, while Apple sat there like a vintage iPod on shuffle at $3.17 trillion — playing the same valuation tune for days.
So, what’s powering this meteoric rise? It’s not just graphics cards for gamers — that’s 2015. And it’s not graphics cards for Big Tech — that’s 2024. It’s graphics cards paid for by Middle Eastern oil money.
😎 Saudi Chips: Not the Potato Kind
Here’s the scoop: Saudi Arabia and the UAE are ready to shell out billions to become AI superpowers. And who’s their go-to guy? Nvidia, of course.
CEO Jensen Huang, who was in Riyadh this week, announced that Nvidia will supply “several hundred thousand” of its most advanced processors to Humain, a state-backed Saudi firm tasked with building AI infrastructure across the desert kingdom. That includes 18,000 units of Nvidia’s cutting-edge GB300 Grace Blackwell chips — the stuff data scientists dream about.
Nvidia calls this initiative “sovereign AI” — governments building and running their own AI on national infrastructure. Think of it as building data sandcastles, except the sand is made of petrodollars and server farms.
The geopolitical context? President Trump’s Middle East tour is clearing regulatory roadblocks, scrapping AI export restrictions drawn up under Biden, and opening the region to top-shelf American tech.
And Wall Street is paying attention.
💪 Trump Dumps Diffusion Rule, Nvidia Pumps
One of the major tailwinds for Nvidia’s latest rally came in the form of a policy reversal. The Biden-era “AI Diffusion Rule,” which aimed to restrict exports of advanced chips, has now been tossed by the Trump administration.
According to the Bureau of Industry & Security, the rule would have “undermined US innovation” and strained diplomatic relations. Translation? Nvidia was about to have its international wings clipped — but now it's free to fly across the Persian Gulf with pallets of GB300s.
The rule reversal instantly boosts Nvidia’s global reach — and opens the floodgates for billions in international chip demand. Naturally, the stock responded positively, climbing 5.4% on Monday, 5.6% on Tuesday, and 4.1% on Wednesday.
🚂 Not Just a Hype Train (But Bring Snacks Anyway)
Nvidia’s rally isn’t just FOMO (but there is some froth every now and then ).
It’s backed by earnings, expansion, and actual demand. Every major AI player — from startups to sovereign nations — needs Nvidia chips. And there’s no clear rival. AMD NASDAQ:AMD is a step behind. Intel NASDAQ:INTC is still trying to remember how to make people excited again.
But at these levels, expectations are sky-high. Even a great quarter that’s not utterly perfect could trigger some profit-taking. After all, trees don’t grow to the sky — but apparently semiconductors are expected to .
👀 Eyes on Microsoft, But Timing Is Key
So what’s next? Can Nvidia dethrone Microsoft NASDAQ:MSFT , currently valued at just about $60 billion more, and become the biggest company in the world?
Easily, especially if Huang’s tech juggernaut keeps this pace and posts another monster earnings beat. Nvidia reports on May 28, and you can bet every institutional desk, Reddit thread, and our very own TradingView community will be glued to their multi-screen setups to get those numbers.
Microsoft still sits at the top with a $3.36 trillion valuation — within striking distance. All it would take is another ~1.8% pop for Nvidia and a sleepy session for Microsoft.
But be warned: Wall Street loves a Cinderella story until the glass slipper misses earnings by two cents.
🧐 Final Thoughts: Watch Out Everyone
Apple may have Siri. But Nvidia has the chips to build a thousand Siris — and a few Skynets while we're at it.
Whether it can overtake Microsoft depends on the next earnings report (or the lead-up hype).
So the question isn’t “Will Nvidia stay #2?” It’s: How long until it’s #1 — and what could possibly stop it?
And if you’ve got it on your watchlist, circle May 28 in red marker and don’t forget to pay attention to the earnings calendar .
Because that earnings print might just rewrite the leaderboard again.
Your move : Are you riding NASDAQ:NVDA to the top? Waiting for a pullback? Or nervously watching from the sidelines with popcorn and regret? Hit the comments with your play.

Magnificent Seven: Still Magnificent? Or Diverging for Good?The Nasdaq 100 has bounced, but under the surface, the “Magnificent Seven” are no longer marching in sync.
And this divergence matters, especially if you’re trading QQQ or using it as a momentum proxy.
⚔️ Leadership Rotation in Real Time
- Nvidia (NVDA): Still a beast. Making fresh highs, clear institutional momentum.
- Microsoft (MSFT): Quiet strength — not flashy, but technically clean.
- Meta, Amazon: Holding up, consolidating after major runs.
- Apple (AAPL) and Tesla (TSLA): Weak links. AAPL can't find a bid. TSLA is stuck below major resistance.
Trading QQQ directly?
Consider weighting your thesis by what’s working under the hood.
- QQQ reclaimed the 200-day MA with the May 12's gap echoing the broader S&P move.
- Look for a retest of the resistance and the previous high of 540
- Play breakouts with confirmation, or mean-reverting pullbacks.
🧠 Final Take
The Magnificent Seven are splitting into two camps: those still driving the rally, and those dragging it.

Nvidia (NVDA) Share Price Jumps Over 5%Nvidia (NVDA) Share Price Jumps Over 5%
Nvidia (NVDA) shares surged to the $130 mark yesterday – a level not seen since late February 2025. This strong rise, marked by a wide bullish candlestick, helped Nvidia reclaim its status as a company valued at over $3 trillion.
Why Nvidia (NVDA) Shares Are Rising
The bullish sentiment has been driven by several factors, including:
→ Price increases on products: Nvidia has raised prices on its graphics cards and data centre chips. The GeForce RTX 5090 has risen by more than 10%, while the RTX 50 series is up by 5–10%.
→ News of a major contract: The company will supply chips to an AI start-up backed by Saudi Arabia. In addition, media reports suggest that the US government is considering a deal allowing the UAE to purchase up to 500,000 Nvidia chips annually until 2027.
All of this could positively impact Nvidia’s revenue, encouraging investors to buy NVDA shares.
Technical Analysis of Nvidia (NVDA) Stock Chart
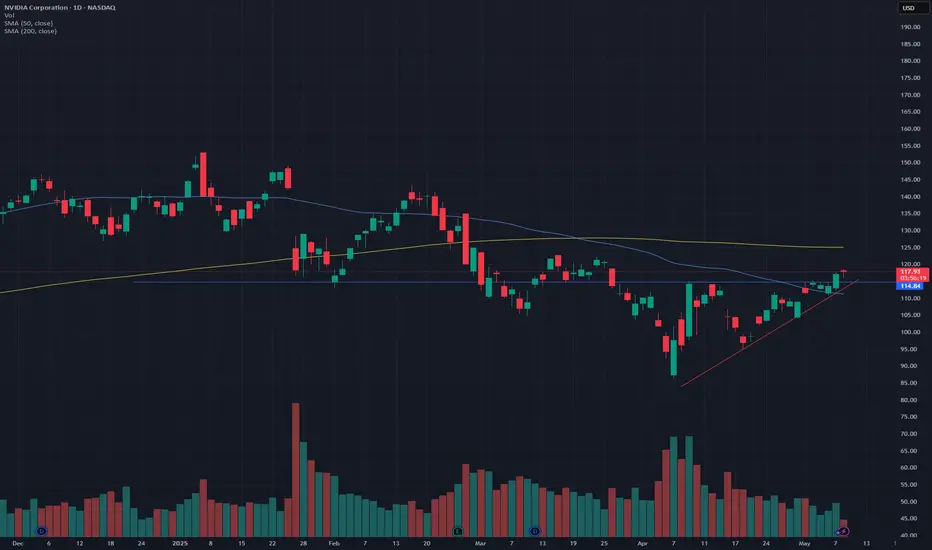
Yesterday’s sharp rally suggests a breakout from the descending channel (marked in red), which had remained in place since late last year.
The breakout occurred near the $123 level, which had previously acted as resistance. It is therefore possible that if there is a pullback in the NVDA stock price, this level could act as support (“breakout retest” pattern), confirming the breakdown of the descending channel and strengthening the outlook for further growth.
This article represents the opinion of the Companies operating under the FXOpen brand only. It is not to be construed as an offer, solicitation, or recommendation with respect to products and services provided by the Companies operating under the FXOpen brand, nor is it to be considered financial advice.
NVDA Weekly Head and Shoulders There's no main price target in mind, however the company from a risk management perspective has been largely not investible for about a year. Multiple 40-60% moves from top to the bottom of the range. Now with diffusion global competition will eventually eat into Nvidia's earnings/market share.
Without a major wave of monetary inflation in the United States it's very like that the short/medium term top has been put in and AI is a narrative that is played out. AI although impressive has yet to deliver what people see has a true life changer. It will eventually happen but Nvidia will have competition when that occurs.

Trading the Impulse Rally Retracement — Price and Time Symmetry Trend is observed from an impulse run’s lowest/highest point and projected outwards in symmetrical fibonacci retracement via price/time from the first reversal candle to the end of the rally, creating crosshairs. These ‘crosshairs’ visually represent the trending ‘price distribution projection’ in price/time symmetry.
Using this concept, I draw a ‘projection trend line’ from the bottom or top of the impulse run thru the projected 78.6% price/time retracement value, to identify the price distribution structure in a linear form.
Now to introduce my STOP LOSS TRIANGLE.
This is a concept of decaying price and time as an underlying move towards our theoretical projection, where if the underlying enters our built faded cross-section, the SL is triggered to avoid sideways consolidation and decaying contract premiums.
This ‘right’ triangle that is ‘sclene’ by nature is created by taking the furthest projection in price/time symmetry (78.6%) and drawing a vertically placed straight line to the highest/lowest point in the rally previously identified. Here, I create a ‘right triangle’ by turning 90 degrees towards my final point, which is made by the nearest projection in price/time symmetry (38.2%). In its entirety, this forms the stop loss triangle.
Come follow me on X @askHVtobidIV for more!
CHEERS!

NVDA New 2025 All-Time High Explained, 153 Next Followed by 194The NVDA stock just hit its highest price since March. Today it moved above resistance while producing a perfect ascending triangle pattern.
This is a major development because the resistance level that was broken today, 114, rejected growth a total of 4 times. NVDA moving above this level confirms the continuation of the bullish move coming from a technical analysis perspective.
Just to be unbiased, I have to mention that there is still one final level to conquer before the chart truly points to a new All-Time High.
The resistance is not a single price but a range, the resistance zone. This range sits between 114 and 123. Once NVDA closes decisively above 123, say a full daily or weekly candle with really high volume, we have a test of the All-Time High as resistance confirmed.
Depending on how the market reacts once the ATH is challenged we can determine what will happen next.
For example, if the ATH produces a very strong rejection with really high bearish volume, we know that a major correction will follow and even a lower low becomes possible. But, on the other hand, if challenging the ATH results in a mild market reaction, a normal drop/retrace then immediately we know that additional growth will happen after a higher low.
The truth is, Nvidia will move up, fight a little bit at the ATH and then continue growing. Just as we predicted the bottom we can predict what will happen next based on the chart. The chart is saying up long-term and this means a new All-Time High in 2025. Rest easy.
Thank you for reading.
Your support is appreciated.
Namaste.

Coinbase New All-Time High Confirmed (477 & 685)Good yes Cryptocurrency Bitcoin trading profits up winning today more. How are you feeling in this wonderful bull market session prices going up strong?
I hope your day is great and that's the same for the chart above. Coinbase, COIN, wow; a new All-Time High coming within months do you have any doubts? I don't think so. Those with doubts are gone, all that is left is us, the buy and hold crew. Successful traders, investors, miners, reporters, hobbyist, holders and curious onlookers, we are winning with Bitcoin and Crypto and this stock... This stock is easy to read.
There are so many bullish signals that I will skip them all and go straight to the bottom point. New All-Time High coming next. It will take months but it will be months of growth, higher heights and higher highs and fast bullish strong momentum building up and growing like nothing you've seen before.
If you are a bear, I am sorry for you but you were warned.
If you are a bull, congratulations my dearest of friends because this is only the start. Everything grows. Everything that is related to Cryptocurrencies of course because Crypto is the future of finance. Bitcoin is the evolution of money. Digital gold.
— Technical analysis
After a strong correction, the COIN stock produced a classic reversal formation as a v shaped bottom at the end of a bearish move. This move is followed by two strong green candles and these candles pushed prices above the 0.236 Fib. extension level, setting the stock into a bullish zone.
After the second big green candle, there is a small retrace in the form of a red week. This is normal and shows consolidation before additional growth. This week is also red but not for long. The fact that COIN remains trading very high compared to the full green candle close means that bears are not present and the bulls are in control.
The chart shows long-term higher highs as well as higher lows.
The chart structure points to a new All-Time High happening very soon, within months. 3-6 months. 3 months for a new All-Time High and 6 months for a major peak. The whole flavor of this market is giving out clues of a cycle that will be big and extended long-term.
Coinbase can grow for longer than what you are prepared for.
The next All-Time High can happen around 477 but this wouldn't be the end of the bullish cycle and wave. I expect even higher targets, the next one being 685. Hold tight, the best is yet to come.
Thank you for reading.
Namaste.

$NVDA: Full on Bull mode. 170 $ before end of Summer Happy Monday. A new week, new trade for you guys. How does the largest AI stock looks like today with US-China Tariff pause for 90 days behave? Today the stock NASDAQ:NVDA broke the 1.0 Upward sloping Fib retracement channel with which we have been working for months now. The stock opened @ 122 % which is the 1.0 Fib retracement level. If we extend the channel and extrapolate then we see the next levels and the resistance levels.
In our Fib Chart here the next level is 1.6 Level which is @ 137 $. In my opinion with RSI at 50 and NASDAQ:NVDA having some high level of short interest. 1.12 % of the float is short which is high going back to 2021 bear market. So, this helps have violent short covering rally in the short term. Bullish before we turn bearish. RSI may top out at 85 in this bull rally phase. This cycle bull r un can take it to 170$ before end of Summer 2025.
Verdict : NASDAQ:NVDA next levels : 135 $ ; cycle top @ 170 $.

Swing Pick $13 to $210 per share in less than 2 months$13 Buy in March to $200/share today! 😱
Swing Pick on 14th March to buy NASDAQ:RGC at $13.10 per share
Today's high is $210 per share 🔥
15X in less than 2 months, I wish I was still holding, congrats to those that still are 💸
You can also see posts about NASDAQ:RGC on my trading view from 2 months ago even the one mentioning it at $4 per share

OptionsMastery: A potential trend change on NVDA? 🔉Sound on!🔉
📣Make sure to watch fullscreen!📣
Thank you as always for watching my videos. I hope that you learned something very educational! Please feel free to like, share, and comment on this post. Remember only risk what you are willing to lose. Trading is very risky but it can change your life!

$SPX Urgent! My <3 & My Soul: Slow Bleed Crash to 3k by Q4 26' Do be warned. Very important post here. I put my heart and soul into this. I made a video earlier and then it got deleted by accident, so I made a less happy one right after. I've got news for all the bulls and investors out there that feel they will be able to continue buying every single dip out there. Get ready for the dip that keeps dipping. Big names already cracking heavy. NASDAQ:META NASDAQ:TSLA NASDAQ:AMD NASDAQ:NVDA to name a few. Big tech is getting cleaned out and layoffs are on the rise. Tariffs create huge amounts of uncertainty. I don't feel like this is rocket science. Buffet is all cash. 89% of Hedge Fund managers believe the US market is the most expensive its ever been and Tutes have been selling at the highest rate ever before. I think it's time the US finally gets a shake down. Bullish conditioning has been running rampant, and I've seen Social Media Accounts discourage charting and only paying attention to price action? Price action involves the entire collective, not just one Timeframe. Anyways, here's an overlay from 01' ... the only one I could find that matches. Says short 560 around May 7th and then take profits around 500 again. Let's make this a nice one. Calls till 560 into May then flip to Puts into June. From then short 530 every time you can. $450 is My first target after we break previous lows. I will update as we go. Have a good one yall.

Trade Idea: $MSFT Short to $418 and beyond into JuneTriple bearish divergence is evident on Volume, RSI, and Momentum. The 9-count sell signal on the daily chart further supports the likelihood of a sell-off at this point. If the price falls below $425, a swift decline to $418 is anticipated, where the true test of the Fair Value Gap (FVG) below will occur. The Fair Value Gap open is at $392.45. Stop would be above yesterday's high at $439.50 ...

Stock Market Forecast | TSLA NVDA AAPL AMZN META MSFTStock Market Forecast | CME_MINI:NQ1! NASDAQ:QQQ AMEX:SPY CME_MINI:ES1!
Mag 7 Forecast | NASDAQ:TSLA NASDAQ:NVDA AAPL AMZN META MSFT GOOG

HUGE +1,522% in 2 days from $0.61 to $9.90 $ASSTIt was clear from the very start this one will go insane because of the volume. It traded 315 million shares on first day when I posted about it. I sent out a message premarket at the very beginning of the move and it already had tens of millions of shares volume at that time.
Then the next day it got to 241 million shares, you just don't see stuff like that in regular stocks.
Awesome profits made along the way, can't wait for a new catch like that!
NASDAQ:ASST

$SPY Its time according to my chart.. Lower high is the trigger I posted two charts for reference to the current situation. With a historic rally right into resistance and a fractal analog that matches, I have no choice but to remain bearish. These are my studies. Sometimes Impatience leads to things like Impulsive Entries and Exits, Revenge Trading, and at times, even Blown Accounts. Times like those should be followed by a regroup and a reset.
The 9 Count Sell Signal Triggered with a Reset is on Technical Inidators for a move lower. I do believe we are going to consolidate for several days but nothing further than the second week of May. Today Bulls got extremely bullish and still were not able to hold the highs into the close. The test of the 200 day SMA was rejected and several days near these leveles whether above or below, would prove the downside move more possible. The monthly on SPX is my biggest indicator, personally. If it follows the pattern I'm following then after a test of the 10WMA, we will roll back over on the next 10 day candle. The market ran through a death cross without stopping, which if anyone were to study for several minutes, they would be able to see any first attempt at a death cross to the upsde is almost immediately met with a selloff back to the lows of the breakout move. Good luck everybody.

NVIDIA: Breakout above ascending triangle, retest confirmationNVDA has been forming an ascending triangle over the past few weeks, with declining volume. Finally, it broke out yesterday, and today, we had a retest of the resistance line. NVDA was down about 1% earlier today however after a successful retest of the resistance line, it is now up 0.8% at the time of writing.
In terms of support, it seems the price has successfully bounced off the 50-Day SMA line. While an ascending triangle is bullish, the 200-Day SMA is likely going to be a point of resistance (around $125).
This is amid the renewed overall market strength and the news related to the reduced limitations of exporting AI chips - which is contributing to the momentum.
Please note: Not financial advice.
NVDA Trade Setup Eyeing the Bounce After the PullbackNVIDIA (NVDA) is currently trading around $117.06, pulling back from its recent highs of $153.13. With volatility kicking in and macro pressure (including renewed tariff talk from the Trump camp), NVDA is setting up for what could be a powerful rebound opportunity.
Here’s how I’m looking at it:
📥 Buy Zones (Scaling In):
$104 – Technical support zone where buyers may start stepping in.
$95 – Key psychological and chart-based support.
$90–$80 – Deep correction zone for high-conviction entries.
🎯 Profit Targets:
TP1: $125 – Strong short-term resistance.
TP2: $145 – Reclaiming mid-term momentum.
TP3: $153+ – All-time high retest if sentiment recovers.
💡 Why It Matters:
NVIDIA’s fundamentals are on fire: strong revenue, record margins, and leadership in AI and data center growth. Add in $25B+ in cash and minimal debt, and you've got a long-term juggernaut. Yes, it's volatile. Yes, it's overvalued on paper. But growth like this doesn’t come cheap.
📊 Risk Management:
Always use stops—especially in this kind of market. I’m keeping an eye on $90 as a make-or-break level and adjusting sizing to weather volatility.
Disclaimer: This is not financial advice. All trading involves risk. Do your own research or speak to a licensed financial advisor before making any financial decisions.

My buy view for NVDAMy buy view for NVDA.
If positive fundamentals continue to outweigh bad news, we are likely to see NVDA push further up towards $120, $130, $140, and then its previous peak of $150.
Trade with care if you are day trading, but this baby is still selling at discount in my view

NVDA Weekly Options Trade Plan 2025-05-07NVDA Weekly Analysis Summary (2025-05-07)
Model Summaries
Grok/xAI Report
Technicals: Price $117.06 above all key EMAs; bullish MACD on 5-min and daily; RSI overbought short-term (75) but neutral daily (59); trading near upper Bollinger Bands. Sentiment: VIX elevated at 24.76; mixed news (AI rally vs. supply delays); max pain at $111 suggests some bearish undertone. Direction: Moderately bullish with caution for pullback. Trade: Buy naked $113 put (premium $0.59) anticipating pullback, stop if $119 breach, target 25–50% gain, 65% confidence.
Claude/Anthropic Report
Technicals: Strong intraday uptrend; bullish MACD and RSI neutral daily; immediate resistance at $117.68. Sentiment: Sector tailwinds, positive news, but VIX elevated and max pain at $111. Direction: Moderately bullish. Trade: Buy $121 call at $0.75, profit target 100% ($1.50), stop-loss 40% ($0.45), 65% confidence.
Llama/Meta Report
Technicals: Bullish MACD, overbought short-term RSI, mixed reversal risk. Sentiment: Mixed news; VIX rising; max pain theory. Direction: Moderately bullish but immediate entry risky—overbought, mixed signals. Trade: No trade recommended at open (confidence <60%).
DeepSeek Report
Technicals: Bullish breakout, expanding bands, RSI overbought M5 but room on daily. Sentiment: Positive AI policy news; VIX manageable; max pain unlikely to derail strong technicals. Direction: Strongly bullish (70% confidence). Trade: Buy $122 call at $0.56, target $1.12, stop if $115.86 break, size 3–5% of capital.
Gemini/Google Report
Technicals: Strong uptrend but very overbought short-term. Sentiment: Mixed news with supply concerns; VIX rising; max pain $111 adds caution. Direction: Neutral/unclear for immediate trade (confidence <60%). Trade: No trade recommended at market open. Areas of Agreement and Disagreement
Agreements
All models see a strong intraday and daily uptrend with price above key EMAs and bullish MACD. Short-term RSI is overbought, suggesting potential for pullback or consolidation. VIX is elevated (~24.8), signaling caution. Max pain at $111 introduces a bearish tether toward expiration.
Disagreements
Trade selection: Grok favors a bearish put; Claude, DeepSeek favor bullish calls; Llama and Gemini hold off. Confidence: DeepSeek is most bullish (70%), Grok and Claude are moderately bullish (65%), Llama and Gemini see too many conflicting signals for immediate action. Strike selection varies widely: $113 put, $121 call, $122 call, or no trade. Conclusion
Overall Market Direction Consensus: Moderately bullish for the week, with elevated short-term risk of pullback.
Recommended Trade
Strategy: Single-leg naked call Instrument: NVDA weekly options (expiry 2025-05-09) Strike: $122.00 Call Premium: ~ $0.56 Entry Timing: At market open Profit Target: $1.12 (100% gain) Stop-Loss: $0.34 (40% loss) Confidence: 70%
Key Risks and Considerations
M5 RSI overbought (75) risks a short-term pullback. Elevated/rising VIX may induce whipsaws. Max pain suggests potential downward drift into expiration. Monitor any fresh supply-chain or sector news at open.
TRADE_DETAILS (JSON Format)
{ "instrument": "NVDA", "direction": "call", "strike": 122.0, "expiry": "2025-05-09", "confidence": 0.70, "profit_target": 1.12, "stop_loss": 0.34, "size": 1, "entry_price": 0.56, "entry_timing": "open", "signal_publish_time": "2025-05-07 20:16:47 UTC-04:00" }
Disclaimer: This newsletter is not trading or investment advice but for general informational purposes only. This newsletter represents my personal opinions based on proprietary research which I am sharing publicly as my personal blog. Futures, stocks, and options trading of any kind involves a lot of risk. No guarantee of any profit whatsoever is made. In fact, you may lose everything you have. So be very careful. I guarantee no profit whatsoever, You assume the entire cost and risk of any trading or investing activities you choose to undertake. You are solely responsible for making your own investment decisions. Owners/authors of this newsletter, its representatives, its principals, its moderators, and its members, are NOT registered as securities broker-dealers or investment advisors either with the U.S. Securities and Exchange Commission, CFTC, or with any other securities/regulatory authority. Consult with a registered investment advisor, broker-dealer, and/or financial advisor. By reading and using this newsletter or any of my publications, you are agreeing to these terms. Any screenshots used here are courtesy of TradingView. I am just an end user with no affiliations with them. Information and quotes shared in this blog can be 100% wrong. Markets are risky and can go to 0 at any time. Furthermore, you will not share or copy any content in this blog as it is the authors' IP. By reading this blog, you accept these terms of conditions and acknowledge I am sharing this blog as my personal trading journal, nothing more.

NVIDIA Corporation: Bullish ConsolidationThe NVDA stock is facing resistance at the 0.5 Fib. extension level. This resistance was met after a higher low and above 0.618 Fib. While this is a confirmed resistance zone, market conditions are bullish.
The RSI is now above 50. It is at its highest on a rise since late January earlier this year.
Local resistance on the RSI has been broken and this oscillator is trading straight up. This is a positive and strong signal. Here is the chart:
The yellow horizontal line is the local resistance which has been broken. On a drop, this same line would now work as support. A "magic" line I should say. :D
It is magical because it helps us predict the future with a high level of accuracy and certainty; so far so good.
These dynamics: The higher low, the small stop at resistance, the bullish RSI and overall bullish market conditions are all part of a bullish consolidation period.
Let me break it down for you; the market will continue to consolidate for a while, for as long as it needs, before moving higher to hit a new high. The conditions revealed by this chart setup is that the low that was hit 7-April remains the bottom. The market can shake, NVDA can go down, it can go up but this low will never be challenged, you can set your stop-loss below it. Any short-term movements against you is just noise. Wait patiently and eventually it will grow.
If you have any questions leave a comment it will be my pleasure to answer.
Thank you for reading again.
See you tomorrow, or the next day, or yesterday-more again.
Make sure to follow. My main focus is Cryptocurrency but I also do the SPX, NVDA and TSLA. (And sometimes Gold which is bearish now.)
Namaste.
