Nvidia - How Long Will It LastHello Traders, welcome to today's analysis of Nvidia.
--------
Explanation of my video analysis:
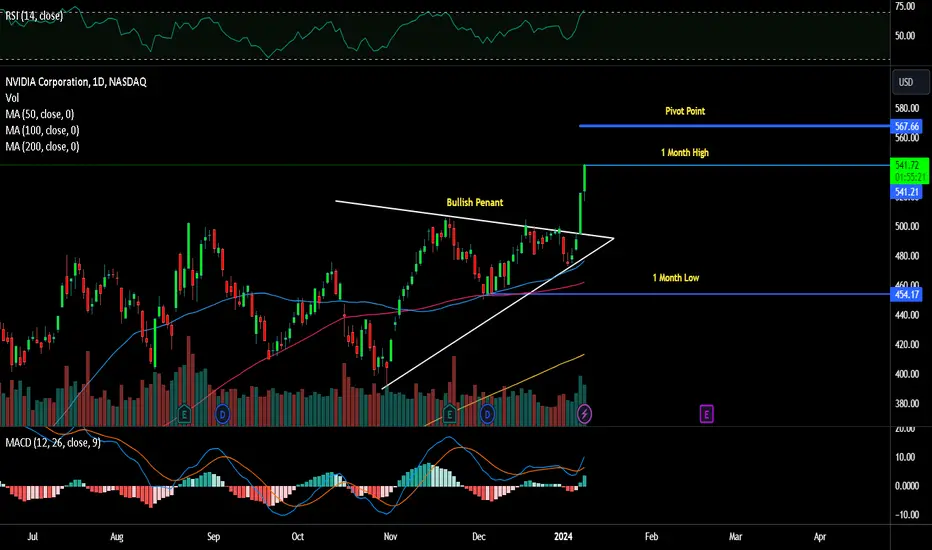
All the way back in February of 2014 we saw a breakout of a long term symmetrical triangle on Nvidia. This breakout was followed by an insane +9.500% rally towards the upside. Right now Nvidia is trading in a solid ascending channel and is approaching the upper resistance trendline. I do expect a (short term) pullback from there to retest the support mentioned in the analysis.
--------
I will only take a trade if all the rules of my strategy are satisfied.
Let me know in the comment section below if you have any questions.
Keep your long term vision.
Nvda_analysis

Nvidia Monumental Divergence- Nvidia seems ready for a bigger retracement.
---------------------------------------------------
Trading Parts
---------------------------------------------------
Short Zone : 400$ ish ( Now )
TP1 : 275$ ish
TP2 : 200$ ish
---------------------------------------------------
- Stay S4fe!
Happy Tr4Ding !

NVDA Nvidia Jan 25th updateNVDA is on the way to its next resistance box, and should be hit by Friday, then a move down to the 575-555 level will be expected
I expect NVDA to maj top in Apr

$NVDA COMPLETE ELLIOT WAVE ANALYSISI have identified all the wave counts visible on the weekly chart, and while they make sense to me, I acknowledge the possibility of errors, given my relatively new exposure to Elliott Wave analysis. It's evident that we are currently within wave B in the overarching wave count. Anticipating an elongated wave B due to various sub waves, my expectation is for wave B to reach the designated green pivot area before completing wave C well below the 2022 low.

Nvidia's Dance with ControversyThe Underground Market for Banned AI Chips in China"
Nvidia (NASDAQ: NASDAQ:NVDA ) finds itself at the center of a storm as reports surface regarding the illicit trade of its advanced AI chips in China. Despite a U.S. ban on exporting these chips to the country, Chinese military entities, state-owned AI research centers, and universities have reportedly been actively acquiring batches of Nvidia semiconductors. This raises concerns about the efficacy of U.S. efforts to restrict China's access to critical AI technology and the potential implications for national security.
The Chinese Quest for Nvidia's Banned Chips:
According to a comprehensive analysis, various Chinese entities, including elite universities like the Harbin Institute of Technology and the University of Electronic Science and Technology of China, have been identified as purchasers of Nvidia's banned A100 and H100 chips. Even chips specifically developed for the Chinese market, the A800 and H800, faced a ban in October. The relentless demand for these chips underscores the challenges faced by the U.S. in cutting off China's access to advanced AI technology, vital for breakthroughs in artificial intelligence and high-end military applications.
Regulatory Quandaries:
While the U.S. ban prohibits the direct export of these chips to China, the emergence of an underground market reveals a complex web of transactions. Chinese vendors reportedly acquire excess stock or import through companies incorporated in countries like India, Taiwan, and Singapore. Nvidia ( NASDAQ:NVDA ), however, maintains that it complies with export control laws and pledges to take action against customers engaging in unlawful resale. U.S. authorities are equally determined to close loopholes in export restrictions, but experts argue that achieving watertight control over small chips is unrealistic.
The Superiority of Nvidia's GPUs in AI:
Nvidia's graphics processing units (GPUs) have long been recognized as superior for AI-related activities, efficiently processing vast amounts of data crucial for machine learning. The persistent demand for these banned AI chips in China highlights the absence of satisfactory alternatives for Chinese firms, with local competitors like Huawei expected to lag behind in development.
National Security Concerns:
The intersection of technology and national security is a critical aspect of this controversy. The involvement of Chinese military entities and institutions with alleged affiliations to military bodies raises questions about the potential dual-use nature of these AI chips. The U.S. government faces the challenge of balancing its commitment to innovation with the imperative to safeguard sensitive technologies that could have military applications.
Conclusion:
Nvidia's entanglement in the controversy surrounding the underground trade of banned AI chips in China sheds light on the complexities of enforcing export restrictions in the tech industry. As geopolitical tensions continue to shape the landscape, the story of Nvidia's chips serves as a compelling narrative, emphasizing the delicate balance between technological advancement, economic interests, and national security. The evolving situation calls for a nuanced approach from both the U.S. government and technology companies to navigate these challenging waters.

NVIDIA ($NVDA) Future of AI-Enabled DevicesNVIDIA ( NASDAQ:NVDA ) appears to be on an impressive trajectory, bolstered by the recent unveiling of its GeForce RTX 40 SUPER Series GPUs at CES 2024. These graphic processing units, built on the Ada Lovelace architecture, promise a significant leap in AI-powered PC experiences. The GPUs boast remarkable capabilities, with up to 52 shader TFLOPS, 121 RT TFLOPS, and 836 AI TOPS, setting new standards in gaming realism and AI-enhanced experiences.
The introduction of these AI-powered chips aligns well with the emerging demand for AI-enabled PCs. Despite recent challenges in the PC market, including declining demand and economic uncertainties, NVIDIA's forward-thinking approach positions it to capitalize on the growing opportunities in the AI PC segment. PC manufacturers like HP Inc. and Dell Technologies are also gearing up to roll out AI PCs, anticipating a recovery in the PC market in 2024.
NVIDIA's transformative technology goes beyond gaming, extending across various sectors such as deep learning inference, generative AI applications, and productivity tools like Adobe Photoshop. The RTX 40 SUPER series chips, equipped with specialized AI Tensor Cores, represent a monumental leap in AI capabilities for PCs, promising users transformative AI experiences.
The technical analysis further supports the positive outlook for NVIDIA. The stock is in a rising trend channel, indicating positive development and increasing buy interest among investors. The recent breakout through resistance levels and the positive signal from the rectangle formation suggest a potential further rise in stock price.
In summary, NVIDIA's strategic focus on cutting-edge AI chips, its readiness to meet the demand for AI-enabled PCs, and the positive technical indicators make it a compelling investment opportunity. The company's commitment to innovation positions it well in the evolving landscape of AI-centric computing, making NVIDIA an attractive choice for investors seeking growth in the technology sector.
NVIDIA (NVDA) - SELL (WYCKOFF DISTRIBUTION)NVDA looks as though it has entered a distribution phase after reaching the 1.618 fib extension. Awaiting formation of UTAD (with low volume), to confirm the sell entry. Hard to gauge how far price will continue to rise in UTAD formation, so I would enter on the UTAD test, which will make it easier to spot full UTAD formation.
Take profit would be around $318 which would have price reaching the 1.618 fib extension. Coincidentally, this would fill the price gap between $318 - $366.

NVIDIA's Strategic & Technological Innovations Propel's Stock
In the ever-evolving landscape of technology, NVIDIA stands as a beacon of innovation, making waves not only in the gaming industry but also in the realm of artificial intelligence. The recent launch of the custom-designed GeForce RTX 4090 D for the Chinese market underscores the company's commitment to expanding its global footprint.
1. GeForce RTX 4090 D: Tailored for Success in the Chinese Market
NVIDIA's collaboration with the U.S. government to design the GeForce RTX 4090 D, specifically tailored to meet export control regulations, reflects the company's dedication to navigating the complex geopolitical landscape. Priced competitively at 12,999 yuan (~$1837), this gaming and processing powerhouse positions NVIDIA as a key player in the lucrative Chinese market. Despite a slight 5% reduction in speed compared to the standard RTX 4090 model, the strategic alignment with regulatory requirements enhances the company's ability to capture market share in a region with immense growth potential.
2. AI Chip Advancements: A Glimpse into the Future
NVIDIA's recent strides in crafting specialized AI chip versions to replace restricted A800 and H800 models further demonstrate the company's adaptability and forward-thinking approach. As global demand for AI solutions continues to rise, NVIDIA's cutting-edge technology places it at the forefront of innovation. By addressing supply restrictions in China, the company not only ensures compliance but also positions itself as a reliable and strategic partner in the fast-paced world of artificial intelligence.
3. Investor Confidence in NVIDIA's Growth Trajectory
Investors have consistently shown confidence in NVIDIA's growth potential, reflected in the stock's upward trajectory. The medium- to long-term rising trend channel suggests positive development and increasing buy interest among investors. The recent breakout through the resistance at $468 signals a bullish sentiment, with further potential for growth projected up to $542 or beyond. Volume analysis adds weight to this positive trend, as volume tops and bottoms align with corresponding price movements, reinforcing the overall strength of the upward momentum.
4. Strategic Breakthroughs and Future Prospects
NVIDIA's breakthroughs extend beyond the immediate product launches and stock performance. The positive signal from the rectangle formation, coupled with the strategic moves to navigate regulatory challenges, positions the company for sustained success. As NVIDIA continues to push the boundaries of technology, investors can anticipate further strategic breakthroughs and innovations that drive stock value.
NVIDIA's strategic collaborations, technological innovations, and investor-friendly performance paint a compelling picture for potential buyers. The company's ability to navigate regulatory challenges, tap into burgeoning markets, and lead the way in AI development solidify its position as a key player in the tech industry. For investors seeking growth potential and a stake in the future of technology, NVIDIA emerges as a compelling opportunity, poised for continued success in the dynamic world of gaming and artificial intelligence.


NVIDIA (NASDAQ: $NVDA) Poses Positive OutlookKey Takeaway
Nvidia, the world’s most valuable chipmaker, has become one of the most prolific investors in artificial intelligence start-ups this year, seeking to capitalise on its position as the dominant provider of AI processors.
Silicon Valley-based Nvidia said it had invested in “more than two dozen” companies this year, from big new AI platforms valued in the billions of dollars to smaller start-ups applying AI to industries such as healthcare or energy.
According to estimates by Dealroom, which tracks venture capital investments, Nvidia participated in 35 deals in 2023, almost six times more than last year.
Technical Analysis
NVIDIA shows strong development within a rising trend channel in the medium long term. This indicate that the company experiences positive development and that buy interest among investors is increasing.
NASDAQ:NVDA has given a positive signal from the rectangle formation by a break up through the resistance at $468. Further rise to $542 or more is signaled.
NASDAQ:NVDA has marginally broken up through resistance at $494. An established break predicts a further rise.

Shorting NVDA. Try #2!If at first you don't succeed....
Traders,
You know I tried this once already. Got stopped out for a loss and honestly, I've been annoyed since. So yeah, this is kind of an revenge trade. Not a good example of how you should trade kids. But again, this is all for your entertainment anyways as I've said all along.
Anywho. Here we are at the bottom of my channel. Patent retest!
Also, I've redrawn the H&S neckline in a way that does not show confirmation on the daily. That right shoulder looks wonky (sometimes it does), but still appears to be forming. Am I a product of my own confirmation bias. Probably. Time will tell.
30%+ Potential profit on this trade.
$460 Entry
$317 Target
$480 SL
7/1 RRR
Def not fin advice.
LFG!
Stewdamus

HPE and Nvidia Team Up for Full Stack Generative AI SolutionHewlett Packard Enterprise (HPE) and Nvidia, two industry giants renowned for their cutting-edge technologies, have joined forces to build a groundbreaking full stack generative AI solution. This collaboration is set to revolutionize the way we approach AI, opening up new realms of possibilities and transforming industries across the globe.
By combining HPE's expertise in high-performance computing and data center solutions with Nvidia's unmatched prowess in AI and accelerated computing, this dynamic partnership promises to deliver an all-encompassing AI infrastructure that is both powerful and efficient. The full stack generative AI solution will empower businesses to unlock the true potential of AI, enabling them to develop innovative applications, drive operational efficiencies, and gain a competitive edge in today's fast-paced market.
This remarkable collaboration signifies a major milestone in the AI landscape, as it brings together the best of both worlds. HPE's deep-rooted experience in delivering scalable infrastructure solutions, coupled with Nvidia's groundbreaking GPU technology, will create a synergy that is simply unparalleled. Together, they will pave the way for groundbreaking advancements in AI research, development, and deployment.
Now, you may be wondering, "How can I be a part of this exciting development?" Well, as an astute trader, you understand the value of seizing opportunities at the right time. Nvidia, being at the forefront of AI innovation, is poised for remarkable growth as a result of this collaboration. Therefore, I encourage you to consider adding Nvidia to your portfolio, as it has the potential to benefit significantly from this game-changing partnership.
As we witness the birth of a transformative full stack generative AI solution, it is crucial to stay ahead of the curve and invest wisely. By positioning yourself strategically, you can potentially reap substantial rewards in the coming months and years.
So, let's embark on this exhilarating journey together! Take a moment to evaluate the potential of Nvidia and consider adding it to your trading portfolio. As always, thorough research and analysis are key to making informed decisions, so ensure you carefully assess the opportunities and risks involved.
If you have any questions or require further information, please do not hesitate comment below. I am here to assist you in any way I can.
Wishing you an exciting and prosperous trading journey!

Above 459 we go up to new highs, below high chance we see $400We're getting alternation between an almost indistinguishable wave 2 and this current wave 4. However, if we breach 459, then we have declined lower than .50% of wave 2 and 3, and although we have NO overlap, the chances are high we are no longer dealing with a wave 4.
Therefore I will keep this simple, above 459 and we go higher to complete this larger pattern. Below 459 and I'm 75%/25% on price heading to 400 in a larger wave 4 flat.

Nvidia Drill Down for Wave v of 5 of ( 1 ) CompletionIn the micro count, it appears we're in our wave iv with another low to come to complete. From there I am expecting one more high to complete this two-decade pattern.

Starting Coverage on Nivida (NVDA)Starting with the big picture containing all the price action within Trading View charts.
Based on fib extension levels my long-term green labeled count is my primary. Purple is an alternative, but again, based on fib extensions levels it seems unlikely that purple is the optimal long-term count. Nonetheless, in either scenario, we should be entering a period of sustained downside that even in my alternative count will last years.
I will drill down into the daily and the micro patterns to get at a top for v of V of 5 of (1)

Nvidia Maintains Lead in AI MarketNvidia's strategy of expanding into cloud services aims to reinforce its market position. The company's financial health is robust, with profit margins nearing 25%, significantly outpacing AMD's 4%. This stark contrast in profitability underlines why Nvidia may continue to be a more attractive investment option compared to AMD. Despite projections hinting at AMD's faster growth in 2024, Nvidia is expected to hold onto its leadership position.
Tech giants and investors are closely watching these developments. who holds positions in both AMD and Nvidia as well as other tech firms like Microsoft, Amazon, and Intel (NASDAQ:INTC), considers his investment in AMD as a strategic hedge against his larger stake in Nvidia. Meanwhile, Meta Platforms (NASDAQ:META) has opted not to challenge Nvidia's GPU capabilities for AI tasks, further cementing Nvidia's dominance in the market.
As the AI revolution demands more processing power, both companies are likely to remain critical players. However, for now, Nvidia's combined hardware-software offerings give it an edge reminiscent of Intel’s past market dominance but with the added leverage of being a crucial software provider akin to Microsoft.

NVDA ~ Snapshot TA (Daily / Nov 2023)NASDAQ:NVDA chart mapping/analysis.
Breakout/bullish price momentum pushing higher within an ascending parallel channel (green).
Bull target(s)
Golden Pocker Fib
Ascending trend-line resistance (white dotted)
78.6% Fib (+1)
Bear target(s)
50% Fib (+1)
Descending trend-line support (white dotted) aka "return to scene of crime"
38.2% Fib (+1)
Underlying gap fill (~423.81) + lower range of ascending parallel channel (green) confluence support zone
23.6% Fib (+1)
Lower range of ascending parallel channel (light blue) + gap fill (~306.01) confluence support zone

Nvda is about to be sold heavilyI will open a short position if I get an entry at 450. Head and neck pattern that will break soon in my opinion.

ANALYSIS ON NVDADear Investors and Traders,
I'm sharing with you this analysis on NVDA to let you know that the price will come down after the squeeze it made in October, if you're holding as an investor close your position and take your profits, and if you're trading there's no point of taking long trades on NVDA currently.
For further questions, don't hesitate to ask!

Is $NVDA Nvidia about to fall down it's RISING CHANNELNASDAQ:NVDA is currently printing a head and shoulders.
Price action is currently at the lower level of it's Rising Channel
Will VANTAGE:NVIDIA nvidia rise higher or fall lower?
Current Price: 421

NVDARETEsting the 40% rule once it breaks.
474$ is my short zone!
This is not a financial advice.
Trade it or buy for longterm.

nvda long term predictionsNVDA is looking for small retrace dwon then rapidliy move up towards given areas .. trade always with confirmation good luck

NVDADear Traders,
expecting trend to remain bearish for short time. Targeting 350 region. Thank you.
