NVDA PUT ThesisWith a close & hold above 274 we will see upside and possible NATHs. But with the current market right now: the Russia - Ukraine conflict, the inflation, and March right around the corner, I don't see the upside. But I see more reason for MMs and short to ride this with the media, on the downside.
Below 230, I see downside to 200
What are your thoughts?
Nvda_analysis

NVIDA: Heading to 200Hello friends, here is a fresh NVDA update. The structure has become quite clear. NVDA should be heading to the 190-210 region. I find it most probable that it will bottom at 200, because that is where the .5 fib retracement lies from this larger degree move. After this, it should move towards 400+ through the rest of the year. Good luck traders :)

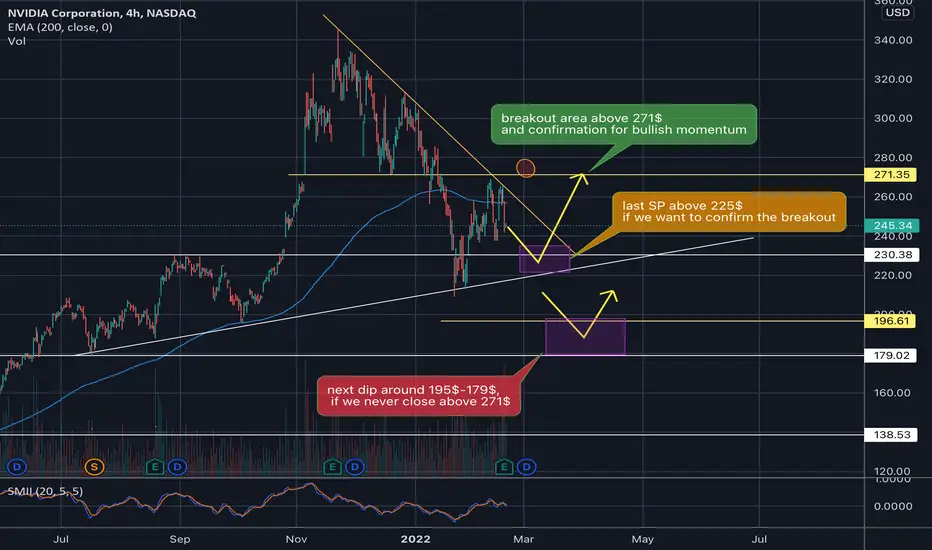
$NVDA price breakout targetwe will see a turning point for our price action , when we close 1h candle this time above 271$, other wise we will see the price drop to accumulate above the 225$, and hold above this support then retest the 271$ , to see a break out above the 300$.
if we didn't hold above our support this time above the 225$, we going to see a price going down near our next support above the 179$.
a bonus in TradingView coins (up to 30$)
tiny.one
NVDA: Back up the truck at 230The structure for NVDA is becoming more clear. It looks like we have one final low to make to about the 230 region to fill the gap. At that juncture, I will "back up the truck". Very bullish setup moving forward.

NVDA Downtrend.Looks like in downtrend.
hoping to hit ~270 range to support the earnings and post which it would come to ~200 range.
May be in FEB last to March timeframe.
Somehow I have feeling during this transient bear market almost all scripts would hit pre-pandemic levels.
Note : Not an investment/trading advise. Please do you own DD.

$NVDA Technical Analysis Two outcomes in the next few weeks.
ER beat 👉Re-test resistance.
ER miss👉 Break support - Re-test $205-$208

NVDA: Set your buy orders for 235-240NVDA made a nice 5-wave move off the low, but now it is time to take a rest and digest some of the gains. We may still get one more small push up to the 270 level, but it is not worth chasing right now. The price target for this swing trade is 400+, which would translate to a 60-70% return by the end of the year.

NVDA SELLwe don't usually publish our stock analysis but her we go
Seems like NVDA has meet the completion of bearish requirements being,
reaching the bearish order block and completing the classic 5 step Elliot wave among others

NVDA possibly to 290 correct me elliot wave guys if i'm wrongNASDAQ:NVDA
Possible finished correction and is headed to 290. is in micro wave 4 out of 5.

NVDA sympathy play for AMD earnings?! -Bounced and finding support @ 200SMA
-Wedge formation breakout?
-TTM Squeezes on timeframes listed (30m,1h,2h,3h)
-Potential $6-$7 move if squeeze fires.
-Break above 2h supply(240.57) could test upper wick @ 248.23 then next target @ 3h Supply.

NVDA: Bottom is Near NVDA finally starting to hit some demand around $208. I am a buyer from $200-$220 for commons and any retest of that area I will look for a bounce long.
Will need to get a feel that day about where we are at, but should be good for swings once we get one more touch this week down. Under $200 market is dropping to $4000 SPX.

LongNVDA ranging at support and accumulation area
buy in between 228 to 208
Target Area 1: 271
Target Area 2: 313
and Trail for further upside

NVDA: Where do we go from here? DP talks about what he sees going into Earnings from #NVDA #NVIDIA after a 100+ point drop over the last few months.

Nvidia Analysis 24.01.2022Hello Traders,
welcome to this free and educational analysis.
I am going to explain where I think this asset is going to go over the next few days and weeks and where I would look for trading opportunities.
If you have any questions or suggestions which asset I should analyse tomorrow, please leave a comment below.
I will personally reply to every single comment!
If you enjoyed this analysis, I would definitely appreciate it, if you smash that like button and maybe consider following my channel.
Thank you for watching and I will see you tomorrow!

NVDA NASDAQ LONGBlack M Team:
NVDA , NASDAQ
Trend Line support range
Support range in oscillator indicators
____________
Safer purchase price:235
TP1=280
TP2=300
TP3=330

NVDA WILL DOWN BEFORE UPNVDA (NVIDIA CORPORATION) will go down around $231 to finish the correction and after that, it will make a new high.
DISCLOSURE - Please be informed that the information I provide is not a trading recommendation or investment advice. All of my work is for educational purposes only. All labeling and wave count have been done by me manually and I will keep changing according to the LIVE MARKET PRICE ACTION. So don't bias, hope on my trade plans. Try to learn Elliott Wave or other strategies and make your own strategy. Following is not that much easy. I am not responsible for any losses if u took the trade according to my trade plans.
#NVDA #NVIDIA

NVDA: Held Key AreaWatching NVDA to bounce after filling and holding a major gap at 267.84. If we see SOXL start to go green or gaps up, wouldn't be surprised to see NVDA have a move back to 284/285 area. Overall market cannot be going into the gutter for this move to happen. NVDA should find local supply around $280.
If NVDA fails 256 for any reason, swing puts down to 230 may be an absolute monster payday.

Nvidia Analysis 11.01.2022Hello Traders,
welcome to this free and educational analysis.
I am going to explain where I think this asset is going to go over the next few days and weeks and where I would look for trading opportunities.
If you have any questions or suggestions which asset I should analyse tomorrow, please leave a comment below.
I will personally reply to every single comment!
If you enjoyed this analysis, I would definitely appreciate it, if you smash that like button and maybe consider following my channel.
Thank you for watching and I will see you tomorrow!

NVDA- Buy areaThis is a business that I like, I am looking at buying the company
but I will await the weekly 60 pull back area, which also in confluence
with a weekly demand zone at 227. the company I think we rally from
those levels, so the first quarter of the year is to remain come and patient

Weekly Watchlist! 1/10 - 1/14Here is what stocks we are going to be watching for this week
NASDAQ:NVDA
Scalping puts under $270
Targets: $269, $268, $267, $266
NASDAQ:FB
Scalping Calls over $337
Targets: $338, $339, $340
NYSE:UPS
Scalping Calls over $220
Targets: $221, $222, $223

NVDA long NVDA analysis with the use of the fibonacci tool
entry: 267,00
stoploss: 257,50
TP: 300.00
I hope this will help you, i am a beginnig trader, so let me know if you have any tips or tricks

NVDA breakout above $315Similar pattern as other SEMIs. Expected breakout above $315. The important part is the consolidation in the $295-315 range. The perfect pattern would have a volatility contraction after the previous larger correction (check), volume dry-out (check), and then higher than average volume on the breakout to new intermediate highs above $315.

#NVDA $NVDA consolidation, looking to rip shortlyNVDA has consolidated over the last few days, and found strong support around 295. Prior to this week, it recently broke the downtrend/bullish wedge, into its current pattern. Shorts have tried all week to drop this, along with very low volume. Finally tax loss harvesting for 2021 ended yesterday. I see this running, until tapering is done in March, and rates indicated to rise with a set date.
Once the rates become in effect, this will correct.
NFA
