Potential Reversal Zone for NVDAThis chart of NVIDIA Corporation (NVDA) as of June 3, 2025, shows a technical analysis scenario forecasting a possible bearish reversal. The price action, zones, and arrows suggest a setup based on supply and demand zones.
Key Elements in the Chart:
🔴 Supply Zone (Resistance Area)
Location: Around $141.73 to ~$144
Observation: The price recently entered this red-shaded area, indicating strong historical resistance.
Implication: The area is expected to act as a ceiling, where sellers may overwhelm buyers, causing a reversal.
⚫ Price Reaction:
The chart shows price approaching and briefly piercing the supply zone, followed by a bearish candle or rejection (as indicated by the top arrow).
Arrows project a downward movement, suggesting bearish sentiment.
🟢 Demand Zone (Support Area)
Location: Approximately $114–$121
Observation: This green-shaded area acted as a base for a previous upward move.
Implication: It is likely to act as a strong support if the price drops significantly.
Projected Price Path:
Short-term reversal from the resistance zone (~$144).
Initial drop to mid $130s (likely a lower high or minor support).
Continuation to demand zone around $116, completing the projected bearish move.
Technical Interpretation:
This setup is a classic supply and demand reversal strategy.
Confirmation of the short setup may require:
A clear rejection candle at resistance.
Break of minor support levels on the way down.
Risk for bulls is high near resistance; short sellers may find opportunities targeting the demand zone.
Nvda_analysis

NVDA Weekly Options Outlook — June 1, 2025📉 NVDA Weekly Options Outlook — June 1, 2025
🚨 AI Model Consensus: Lean Bearish Into 6/6 Expiry
🧠 Model Breakdown
🔹 Grok (xAI)
Bias: Short-term bullish (above 10/50 EMA on M5), but below 200 EMA.
Indicators: RSI ~63, MACD weakening on daily.
Sentiment: Falling VIX + AI buzz, but $133 max pain caps upside.
Trade: Buy $141C @ ~$0.94 → Target +50%, SL 50%
Confidence: 70%
🔹 Claude (Anthropic)
Bias: Slightly bullish.
Indicators: Price above 10EMA, below 200EMA; MACD weak, RSI neutral.
Sentiment: Call/put OI split, max pain $133.
Trade: Buy $140C @ $0.96 → Target +55–75%, SL $0.50
Confidence: 72%
🔹 Gemini (Google)
Bias: Bearish.
Indicators: Bearish MACD crossover; upper Bollinger rejection.
Sentiment: Positive news priced in.
Trade: Buy $128P @ $0.73 → Target +75–100%, SL 50%
Confidence: 65%
🔹 Llama (Meta)
Bias: Moderately bearish.
Indicators: MACD fading; under EMAs on M5.
Trade: Buy $133P → Target +50%, SL above $136.35
Confidence: 70%
🔹 DeepSeek
Bias: Bearish.
Indicators: MACD bearish crossover; momentum fading.
Trade: Buy $132P @ $1.65 → Target +100%, SL 50%
Confidence: 65%
✅ Consensus Takeaways
🎯 Max Pain: $133 is the focal level across all models.
🟢 VIX down; sentiment positive, but momentum fading.
📉 Daily MACD across models turning bearish.
⚠️ Bullish calls (Grok/Claude) vs. bearish puts (Gemini/Llama/DeepSeek).
🔍 Recommended Trade This Week
💡 Bearish Play: NVDA Weekly Put (Exp: 2025-06-06)
💵 Entry: $1.66
🎯 Target: $2.49 (+50%)
🛑 Stop: $0.83 (−50%)
🔢 Size: 1 contract
⏰ Entry Timing: Market open (Monday)
📈 Confidence: 65%
⚠️ Risks to Watch
🚀 AI catalyst could reverse thesis and rally price fast
⏳ Time decay will eat premium—move needed early
🕳️ Opening gaps could get filled fast—use limit orders
🔄 Max pain ≠ magnetic level—watch price action around $133 closely
📊 TRADE DETAILS (JSON)
json
Copy
Edit
{
"instrument": "NVDA",
"direction": "put",
"strike": 132.0,
"expiry": "2025-06-06",
"confidence": 0.65,
"profit_target": 2.49,
"stop_loss": 0.83,
"size": 1,
"entry_price": 1.66,
"entry_timing": "open",
"signal_publish_time": "2025-06-02 09:30:00 UTC-04:00"
}

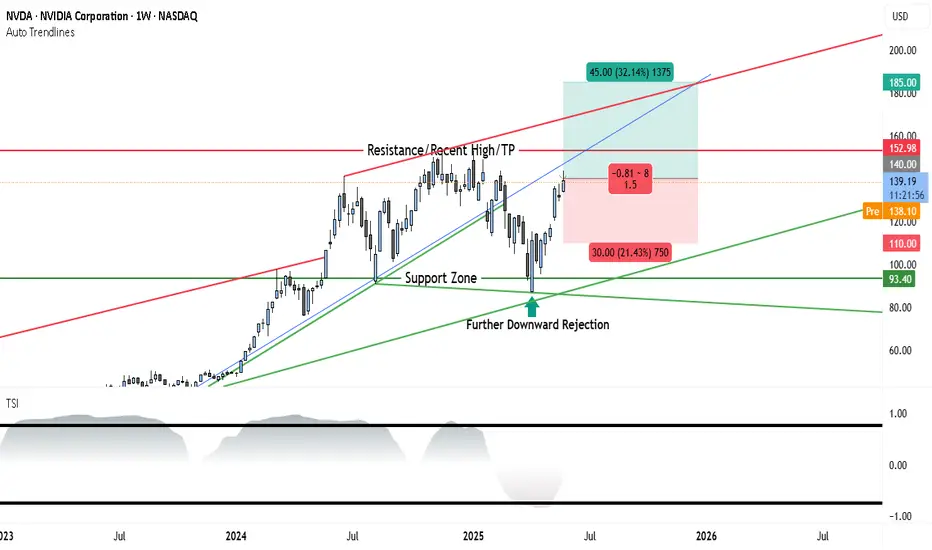
NVIDIA Stock Weekly Outlook: Support Holds Strong as $185 TargetThe weekly chart of NVDA shows a strong continuation pattern forming after a period of consolidation and a healthy pullback. The recent price action confirms a bullish stance, with a fresh bounce off support and momentum gradually shifting in favor of the bulls.
________________________________________
Long-Term Uptrend Confirmed
The blue ascending trendline drawn from early 2023 remains intact, showing that the overall trend is still bullish. NVDA has respected this trendline multiple times, with each touch followed by a renewed upward move. This week, the price rebounded once again near this trendline, confirming its role as dynamic support and signaling renewed buying interest.
________________________________________
Resistance and Breakout Potential
The key resistance level is marked at $152.98, which represents the recent weekly high and a psychological barrier. This level has acted as a ceiling in past attempts, but the current structure and momentum suggest a potential breakout if volume confirms. Above this level, there's clear air up to $185, where the next major resistance sits, and which also acts as the projected target in this trade setup.
________________________________________
Support Holding Strong
A strong support zone around $93.40 is clearly defined and has already triggered multiple rejections. NVDA recently saw a sharp bounce from this zone after a downward rejection, signaling that institutional buyers may be active here. This area is the foundation of the current bullish case.
________________________________________
Momentum Turning Favorably
The True Strength Index (TSI), shown at the bottom of the chart, is emerging from a low region. While not yet fully bullish, the indicator is starting to turn upward, suggesting early signs of momentum building. If TSI crosses above the midline in coming weeks, it could confirm the start of a sustained upward move.
________________________________________
Trade Setup
• Entry Zone: $138 to $140 (current price range)
• Stop-Loss: $110 (beneath the last significant swing low)
• Target: $185 (aligns with the next major resistance and top of risk-reward box)
• Risk-Reward Ratio: Approximately 1.5:1
• Setup Bias: Swing to mid-term bullish continuation
________________________________________
Conclusion
NVIDIA’s weekly chart is aligning in favor of the bulls after a healthy consolidation and support retest. The price remains within a strong uptrend channel, and momentum is gradually improving. A breakout above $152.98 would likely attract more volume and set the stage for a rally toward $185. The risk-reward setup is favorable, making this a strong candidate for bullish swing positioning heading into Q3 2025.
Nvidia Stock Price Rises Over 4% Following Earnings ReportNvidia (NVDA) Stock Price Rises Over 4% Following Earnings Report
Yesterday, after the main trading session, Nvidia released its quarterly earnings report, which exceeded analysts' expectations:
→ Earnings per share: actual = $0.81, forecast = $0.73
→ Revenue: actual = $44 billion, forecast = $43.3 billion
Additionally, according to media reports, Nvidia issued a strong forecast for the next period, although CEO Jensen Huang noted difficulties in accessing the Chinese market, which he estimates to be worth $50 billion.
Nevertheless, market participants reacted positively. According to Google, in after-hours trading the NVDA stock price rose by more than 4%, surpassing the $140 level.
It is reasonable to assume that this initial positive reaction could continue during today’s main trading session.
Technical Analysis of NVDA Chart
As we mentioned earlier this week, NVDA stock in 2025 has formed a broad descending channel (shown in red), and just before the earnings release, the price was consolidating near the upper boundary of this channel.
We also suggested a scenario in which the bulls might attempt to break through the upper boundary of the channel. Given the positive earnings report and the stock market rally following the Federal Court’s decision declaring Trump tariffs invalid, the likelihood of this scenario increases.
This, in turn, means that:
→ the upper boundary of the channel, once broken, may act as support;
→ we may once again see the key psychological resistance level of $150 come into play — a level we have highlighted multiple times before.
This article represents the opinion of the Companies operating under the FXOpen brand only. It is not to be construed as an offer, solicitation, or recommendation with respect to products and services provided by the Companies operating under the FXOpen brand, nor is it to be considered financial advice.

What’s Happening with Nvidia (NVDA) Ahead of Earnings?What’s Happening with Nvidia (NVDA) Ahead of Earnings?
After an extended weekend due to Veterans Day in the US (observed on Monday), financial markets are returning to active trading. The highlight of the week will be Nvidia’s (NVDA) earnings report, scheduled for Wednesday after the close of the main trading session.
What You Need to Know Ahead of Nvidia’s Earnings
According to media reports, market participants are concerned about:
→ escalating trade tensions between the US and China;
→ increasing competition;
→ Nvidia’s premium pricing at a time when the GPU market is shifting towards more affordable alternatives;
→ downward revisions to earnings per share, which some interpret as a sign that Nvidia’s report may fall short of expectations.
On the other hand, Reuters reports that Nvidia is set to unveil a new processor that:
→ is designed specifically for AI applications;
→ is based on the Blackwell architecture;
→ will not be subject to US export restrictions on chips sent to China;
→ is expected to be cost-effective.
Technical Analysis of Nvidia (NVDA) Stock
Today’s NVDA price chart suggests that the descending channel (marked in red) may be forming a large bullish flag — a continuation pattern that typically indicates a potential resumption of the uptrend after a corrective phase.
Price action in Nvidia stock has slowed near the upper boundary of the channel — a sign of temporary equilibrium between supply and demand (this could also be interpreted as traders adopting a wait-and-see stance ahead of the earnings release).
Given that the earnings report is a potentially strong price catalyst, a breakout from the bullish flag cannot be ruled out. Such a move could signal the start of a new phase in NVDA’s long-term upward trend (as indicated by the arrow on the chart).
This article represents the opinion of the Companies operating under the FXOpen brand only. It is not to be construed as an offer, solicitation, or recommendation with respect to products and services provided by the Companies operating under the FXOpen brand, nor is it to be considered financial advice.

NVDA Weekly Options Trade Plan 2025-05-25NVDA Weekly Analysis Summary (2025-05-25)
Model Summaries Grok/xAI: Mixed technical signals—bullish on daily, bearish on 5-minute; neutral overall; no trade recommended (55% confidence). Claude/Anthropic: Moderately bearish; recommends buying the $128 put at ~$3.60 for a 50–100% profit target; confidence 72%. Llama/Meta: Moderately bearish but views premium/risk as unfavorable for buying; instead suggests selling the $130 put; confidence 70%. Gemini/Google: Strong intraday bearish technicals and negative sentiment; recommends buying the $120 put at ~$1.24 as a day trade; confidence 65%. DeepSeek: Moderately bearish but sees premiums >$1 as too rich; no trade recommended (55% confidence). Areas of Agreement and Disagreement Agreement: • Overall moderately bearish bias for NVDA into weekly expiry. • Rising VIX, max-pain near $126, and negative news support downside. Disagreement: • Trade/no-trade: Grok and DeepSeek pass, Claude, Gemini and Llama propose trades. • Strike selection: Claude prefers $128 put; Gemini $120 put; Llama sells $130 put. • Strategy type: All bearish ideas are buy puts except Llama, which suggests naked put selling. Conclusion Overall Market Direction: Moderately Bearish for the week ending 2025-05-30. Recommended Trade: Buy a weekly put to capture the expected pull toward the $126 max-pain level. • Instrument: NVDA 2025-05-30 $128 Put • Entry Timing: At market open • Entry Price: $3.65 (ask) • Profit Target: $5.48 (≈50% gain ⇒ midpoint sell or scale) • Stop Loss: $2.56 (≈30% loss) • Size: 1 contract Confidence Level: 70% Key Risks and Considerations: • Intraday oversold conditions could trigger a short-term bounce. • Theta decay accelerates late in the week—need timely exit. • Holiday-shortened week may damp momentum. • Liquidity is good at the $128 strike but bid-ask spread and slippage can impact execution.
TRADE_DETAILS (JSON Format)
{ "instrument": "NVDA", "direction": "put", "strike": 128.0, "expiry": "2025-05-30", "confidence": 0.70, "profit_target": 5.48, "stop_loss": 2.56, "size": 1, "entry_price": 3.65, "entry_timing": "open", "signal_publish_time": "2025-05-25 10:57:51 UTC-04:00" } 📊 TRADE DETAILS 📊 🎯 Instrument: NVDA 🔀 Direction: PUT (SHORT) 🎯 Strike: 128.00 💵 Entry Price: 3.65 🎯 Profit Target: 5.48 🛑 Stop Loss: 2.56 📅 Expiry: 2025-05-30 📏 Size: 1 📈 Confidence: 70% ⏰ Entry Timing: open 🕒 Signal Time: 2025-05-25 10:58:05 EDT
Disclaimer: This newsletter is not trading or investment advice but for general informational purposes only. This newsletter represents my personal opinions based on proprietary research which I am sharing publicly as my personal blog. Futures, stocks, and options trading of any kind involves a lot of risk. No guarantee of any profit whatsoever is made. In fact, you may lose everything you have. So be very careful. I guarantee no profit whatsoever, You assume the entire cost and risk of any trading or investing activities you choose to undertake. You are solely responsible for making your own investment decisions. Owners/authors of this newsletter, its representatives, its principals, its moderators, and its members, are NOT registered as securities broker-dealers or investment advisors either with the U.S. Securities and Exchange Commission, CFTC, or with any other securities/regulatory authority. Consult with a registered investment advisor, broker-dealer, and/or financial advisor. By reading and using this newsletter or any of my publications, you are agreeing to these terms. Any screenshots used here are courtesy of TradingView. I am just an end user with no affiliations with them. Information and quotes shared in this blog can be 100% wrong. Markets are risky and can go to 0 at any time. Furthermore, you will not share or copy any content in this blog as it is the authors' IP. By reading this blog, you accept these terms of conditions and acknowledge I am sharing this blog as my personal trading journal, nothing more.

SHORT | NVDANASDAQ:NVDA
Key Observations:
Current Price Action:
Price: $131.80
Recent Drop: -2.58 (-1.92%)
Support and Resistance Levels:
Immediate Resistance: $134.70 to $138.83
This red zone represents a strong supply area where the price has historically faced selling pressure.
Immediate Support: $122.74 (Target Price 1)
Further Supports:
Target Price 2: $116.65 (Aligned with 0.5 Fibonacci Retracement)
Target Price 3: $108.38 (Previous structural low)
Trendlines:
Red Uptrend Line: Recently broken, indicating weakening bullish momentum.
Green Downtrend Line: Long-term resistance trendline from the previous Lower Highs (LH) is still intact and respected.
The break below the minor trendline suggests a corrective wave (4) might be in motion.
Fibonacci Levels:
0.382 Fib Retracement: $121.22
0.5 Fib Retracement: $116.22
These levels align with potential targets in a wave (4) corrective phase according to Elliott Wave theory.
Target Prices:
Target Price 1: $122.74
This is the closest demand zone and aligns with the 0.382 retracement—high-probability support.
Target Price 2: $116.65
Aligned with the 0.5 Fibonacci level and previous consolidation.
Target Price 3: $108.38
A major structural support and potential wave (4) bottom if market turns sharply bearish.
Summary:
NVIDIA Corporation (NVDA) is showing early signs of a corrective phase after failing to break through strong resistance in the $134–$138 range. The price rejected the resistance zone and is likely entering wave (4) correction. Key support levels to monitor are $122.74, $116.65, and $108.38, corresponding with Fibonacci retracement levels and historical price structure. A break below the short-term trendline increases the probability of a continued pullback before potentially resuming the uptrend in wave (5).

Nvidia (NVDA) Share Price Jumps Over 5%Nvidia (NVDA) Share Price Jumps Over 5%
Nvidia (NVDA) shares surged to the $130 mark yesterday – a level not seen since late February 2025. This strong rise, marked by a wide bullish candlestick, helped Nvidia reclaim its status as a company valued at over $3 trillion.
Why Nvidia (NVDA) Shares Are Rising
The bullish sentiment has been driven by several factors, including:
→ Price increases on products: Nvidia has raised prices on its graphics cards and data centre chips. The GeForce RTX 5090 has risen by more than 10%, while the RTX 50 series is up by 5–10%.
→ News of a major contract: The company will supply chips to an AI start-up backed by Saudi Arabia. In addition, media reports suggest that the US government is considering a deal allowing the UAE to purchase up to 500,000 Nvidia chips annually until 2027.
All of this could positively impact Nvidia’s revenue, encouraging investors to buy NVDA shares.
Technical Analysis of Nvidia (NVDA) Stock Chart
Yesterday’s sharp rally suggests a breakout from the descending channel (marked in red), which had remained in place since late last year.
The breakout occurred near the $123 level, which had previously acted as resistance. It is therefore possible that if there is a pullback in the NVDA stock price, this level could act as support (“breakout retest” pattern), confirming the breakdown of the descending channel and strengthening the outlook for further growth.
This article represents the opinion of the Companies operating under the FXOpen brand only. It is not to be construed as an offer, solicitation, or recommendation with respect to products and services provided by the Companies operating under the FXOpen brand, nor is it to be considered financial advice.
My buy view for NVDAMy buy view for NVDA.
If positive fundamentals continue to outweigh bad news, we are likely to see NVDA push further up towards $120, $130, $140, and then its previous peak of $150.
Trade with care if you are day trading, but this baby is still selling at discount in my view

NVDA Weekly Options Trade Plan 2025-05-07NVDA Weekly Analysis Summary (2025-05-07)
Model Summaries
Grok/xAI Report
Technicals: Price $117.06 above all key EMAs; bullish MACD on 5-min and daily; RSI overbought short-term (75) but neutral daily (59); trading near upper Bollinger Bands. Sentiment: VIX elevated at 24.76; mixed news (AI rally vs. supply delays); max pain at $111 suggests some bearish undertone. Direction: Moderately bullish with caution for pullback. Trade: Buy naked $113 put (premium $0.59) anticipating pullback, stop if $119 breach, target 25–50% gain, 65% confidence.
Claude/Anthropic Report
Technicals: Strong intraday uptrend; bullish MACD and RSI neutral daily; immediate resistance at $117.68. Sentiment: Sector tailwinds, positive news, but VIX elevated and max pain at $111. Direction: Moderately bullish. Trade: Buy $121 call at $0.75, profit target 100% ($1.50), stop-loss 40% ($0.45), 65% confidence.
Llama/Meta Report
Technicals: Bullish MACD, overbought short-term RSI, mixed reversal risk. Sentiment: Mixed news; VIX rising; max pain theory. Direction: Moderately bullish but immediate entry risky—overbought, mixed signals. Trade: No trade recommended at open (confidence <60%).
DeepSeek Report
Technicals: Bullish breakout, expanding bands, RSI overbought M5 but room on daily. Sentiment: Positive AI policy news; VIX manageable; max pain unlikely to derail strong technicals. Direction: Strongly bullish (70% confidence). Trade: Buy $122 call at $0.56, target $1.12, stop if $115.86 break, size 3–5% of capital.
Gemini/Google Report
Technicals: Strong uptrend but very overbought short-term. Sentiment: Mixed news with supply concerns; VIX rising; max pain $111 adds caution. Direction: Neutral/unclear for immediate trade (confidence <60%). Trade: No trade recommended at market open. Areas of Agreement and Disagreement
Agreements
All models see a strong intraday and daily uptrend with price above key EMAs and bullish MACD. Short-term RSI is overbought, suggesting potential for pullback or consolidation. VIX is elevated (~24.8), signaling caution. Max pain at $111 introduces a bearish tether toward expiration.
Disagreements
Trade selection: Grok favors a bearish put; Claude, DeepSeek favor bullish calls; Llama and Gemini hold off. Confidence: DeepSeek is most bullish (70%), Grok and Claude are moderately bullish (65%), Llama and Gemini see too many conflicting signals for immediate action. Strike selection varies widely: $113 put, $121 call, $122 call, or no trade. Conclusion
Overall Market Direction Consensus: Moderately bullish for the week, with elevated short-term risk of pullback.
Recommended Trade
Strategy: Single-leg naked call Instrument: NVDA weekly options (expiry 2025-05-09) Strike: $122.00 Call Premium: ~ $0.56 Entry Timing: At market open Profit Target: $1.12 (100% gain) Stop-Loss: $0.34 (40% loss) Confidence: 70%
Key Risks and Considerations
M5 RSI overbought (75) risks a short-term pullback. Elevated/rising VIX may induce whipsaws. Max pain suggests potential downward drift into expiration. Monitor any fresh supply-chain or sector news at open.
TRADE_DETAILS (JSON Format)
{ "instrument": "NVDA", "direction": "call", "strike": 122.0, "expiry": "2025-05-09", "confidence": 0.70, "profit_target": 1.12, "stop_loss": 0.34, "size": 1, "entry_price": 0.56, "entry_timing": "open", "signal_publish_time": "2025-05-07 20:16:47 UTC-04:00" }
Disclaimer: This newsletter is not trading or investment advice but for general informational purposes only. This newsletter represents my personal opinions based on proprietary research which I am sharing publicly as my personal blog. Futures, stocks, and options trading of any kind involves a lot of risk. No guarantee of any profit whatsoever is made. In fact, you may lose everything you have. So be very careful. I guarantee no profit whatsoever, You assume the entire cost and risk of any trading or investing activities you choose to undertake. You are solely responsible for making your own investment decisions. Owners/authors of this newsletter, its representatives, its principals, its moderators, and its members, are NOT registered as securities broker-dealers or investment advisors either with the U.S. Securities and Exchange Commission, CFTC, or with any other securities/regulatory authority. Consult with a registered investment advisor, broker-dealer, and/or financial advisor. By reading and using this newsletter or any of my publications, you are agreeing to these terms. Any screenshots used here are courtesy of TradingView. I am just an end user with no affiliations with them. Information and quotes shared in this blog can be 100% wrong. Markets are risky and can go to 0 at any time. Furthermore, you will not share or copy any content in this blog as it is the authors' IP. By reading this blog, you accept these terms of conditions and acknowledge I am sharing this blog as my personal trading journal, nothing more.

Nvidia Shows Signs of Recovery -but the Bearish Channel Remains Over the last five trading sessions, Nvidia’s stock has gained more than 9%, and short-term bullish momentum remains intact as the tech giant appears to benefit from expectations of a potential easing in trade war tariffs. Notably, the company’s CEO, Jensen Huang, recently stated that the Chinese market for artificial intelligence chips could reach $50 billion within the next two years — highlighting the importance of maintaining access to this market. This reinforces the view that a diplomatic resolution to the trade conflict is crucial for Nvidia to sustain a steady recovery.
It’s also important to note that Nvidia is scheduled to release its next earnings report on May 28, with market expectations pointing to earnings of approximately $0.88 per share. Should results meet or exceed projections, this could reignite a bullish sentiment that has been largely absent from the stock over the past several months.
Bearish channel still in play:
Since early January of this year, Nvidia’s stock has formed a steady downward channel, pushing the price even below the $100 mark at times. While a consistent upward correction is underway, it remains insufficient to confirm a definitive breakout, meaning this bearish channel is still the dominant technical structure in the short term.
ADX:
The ADX indicator has been fluctuating below the neutral 20 level, signaling a decline in volatility over the average of the last 14 sessions. As long as this continues, the current phase of price neutrality may persist.
RSI:
The RSI is showing a similar picture, hovering near the 50 level — indicating a balance between buying and selling momentum in recent sessions, and reinforcing the lack of a clear short-term trend.
Key levels to watch:
$113: Current resistance level, aligned with the upper bound of the bearish channel and the 50-period simple moving average. Continued price action in this area may extend the current phase of consolidation.
$125: A critical resistance point tied to the 200-period simple moving average. A breakout toward this level could signal the end of the bearish channel.
$100: A key psychological support level in the short term. A move below this threshold could reinforce the bearish bias and trigger a deeper downtrend within the current price structure.
Written by Julian Pineda, CFA – Market Analyst

My buy view for NVIDIA stock explained My buy view for NVDA.
If positive fundamentals continue to outweigh bad news, we are likely to see NVDA push further up towards $120, $130, $140, and then its previous peak of $150.
Trade with care if you are day trading, but this baby is still selling at discount in my view

Will the EUR/USD find support and rally or give up it's run?In this video I go over EUR/USD, GBP/USD, USD/JPY, NVDA & SPX.
With an overall bearish outlook on the U.S. Dollar, I'm watching for support to hold above 1.1200 on the EUR/USD in order to continue the rally.
Although a pullback was expected after an aggressive up move over the span of 3 weeks, this will be interesting with a good amount of economic data set to release beginning on Tuesday.
We'll see if Bulls hold up or if Bears decide to show some strength.
As always, Good Luck & Trade Safe.

$NVDA forming local higher low and above 20-Day SMA NASDAQ:NVDA has traded very poorly recently. Today we are looking at a daily price chart of NASDAQ:NVDA and we have seen many lower lows and lower highs since GTC Conference. After touching the ATH of 150 $, the price is making new lows and has recently touched the lows of 85 $ and made new higher low of 95 $. So, this marks a double higher bottom and now the at 105 $ is now above 20 Day SMA. This might mark a bullish reversal in my opinion.
So why not a trade idea on a Friday. #TGIF. I say we go long NASDAQ:NVDA here and now. Remain long if it remains over the 50-Day, 100-Day and 200-Day SMA. 200-Day SMA ist currently @ 125 $. If NVDA has a weekly close above 125 $ then we go all in on $NVDA.
Verdict: Long NASDAQ:NVDA here until 125 $. Keep watching this space for next levels.

cup with handle pattern on the 1-hour time frameWelcome to today's analysis! Let’s break down the current price action on NASDAQ:NVDA and potential trade setups.
🌐 Overview: NASDAQ:NVDA Forming a Cup with Handle Pattern
📈 NASDAQ:NVDA is currently forming a cup with handle pattern on the 1-hour time frame. This pattern is typically bullish and could indicate a potential upward move.
🔄 Current Scenario:
NASDAQ:NVDA has formed a cup shape and is now developing the handle. The handle is a consolidation phase before a potential breakout.
The key level to watch is the resistance at the top of the handle. A breakout above this level could signal a bullish continuation.
🔑 Key Levels to Watch
🔴 Resistance: Top of the Handle (Needs breakout for continuation)
🟢 Target: Measured move equal to the depth of the cup, projected from the breakout point.
🛠️ Trade Scenarios
📌 Bullish Scenario (Breakout Above Resistance)
If NASDAQ:NVDA breaks and holds above the handle resistance, it could move toward the target level.
This breakout would confirm the cup with handle pattern and suggest a potential upward trend.
📌 Bearish Scenario (Failure to Breakout)
If NASDAQ:NVDA fails to break out and instead moves lower, it could retest the support levels within the cup or handle.
A failure to hold above key support levels could indicate a potential reversal or further consolidation.
📌 Conclusion
NASDAQ:NVDA is forming a cup with handle pattern on the 1-hour time frame. A breakout above the handle resistance could signal a bullish move toward the target level. If the price fails to break out, further consolidation or a retest of support levels may be necessary.

NVDA’s Wild Crash Alert: I’m Braced for a Heart-Stopping Drop!NVDA’s like a rocket losing altitude, and I’m on edge! It’s at $95.99, but I’m seeing it tumble to $90, maybe $88.95, then $83.59 if the bears go wild. If that breaks, whoa—$77.48 could hit hard! I’m glued to $90 for the first clue—big selling there, and it’s game on for a slide.
Kris/Mindbloome Exchange
Trade Smarter Live Better

NVDA: Buy the Dip or Miss the Run?NVDA 💥🔥
Let’s be real, the market’s been shaky. Between the spike in volatility and the new tariff chatter coming out of the Trump camp, tech stocks are getting tossed around. But here’s the thing—volatility is where the setups live. And NVDA, sitting at the center of the AI revolution, isn’t going to stay down forever.
This might be the window. We’re talking a solid entry zone between 90 and 70, right where volatility meets opportunity.
Our profit targets?
✅ 110 for a clean bounce
✅ 125 as momentum builds
✅ 145+ if the bulls take the wheel again
It’s not about chasing—this is about timing the wave before it rips. So if you’re into smart risk, layered entries, and riding volatility like a pro… NVDA just rang the bell.
Disclaimer: This is not financial advice. All trading involves risk, especially in volatile conditions. Always do your own research or speak to a licensed financial advisor before making any trading decisions.

NVDA Weekly Options Trade Plan 2025-04-15NVDA Weekly Analysis Summary (2025-04-15)
NASDAQ:NVDA
Below is a synthesized, step‐by‐step quant analysis of NVDA’s weekly options environment based on all model reports and the provided options data:
─────────────────────────────
SUMMARY OF MODEL KEY POINTS
▪ Grok/xAI Report – Price is trading tightly in a range near $112.20 with short‐term oscillation between support (~$111.95) and resistance (~$112.35). – Very mixed short‐term indicators (5‑minute MACD bearish but daily MACD bullish) and overall neutral technicals. – High option volume and open interest around $110 (max pain) and $115, but the report concludes with “no trade recommendation” given the mixed signals.
▪ Llama/Meta Report – Confirms NVDA is at $112.20 and finds 5‑minute charts “neutral/consolidating” while noting the daily chart shows some bullish recovery. – Despite daily technical hints of a potential bullish reversal, overall bias is assessed as moderately bearish. – Recommends a put option trade—specifically a $109 strike put with an ask premium of $0.84—citing a moderately bearish view and a 70% confidence level.
▪ Gemini/Google Report – Acknowledges that while the daily chart is bullish (strong momentum above keys like the 10‑day EMA) short‑term M5 charts show consolidation and the negative news (export restrictions and a possible $5.5B charge) adds significant uncertainty. – Notes that the max pain level is at $110 (below the current price) and that although pre‑market action appears firm, the conflicting signals create high risk. – Concludes strongly to “NO TRADE” at the open given the mixed and conflicting signals (confidence around 30%).
▪ DeepSeek Report – Points out that although NVDA is trading above some key EMAs, the negative news and heavy put open interest (especially near the $110 level) weigh on sentiment. – Using max pain logic and a moderately bearish bias (targeting a move toward $110), recommends buying a $110 strike put at a $1.10 premium with a 68% confidence level. – Provides detailed entry, profit target, and stop‐loss conditions (though the premium is notably above an “ideal” range of $0.30–$0.60).
───────────────────────────── 2. AREAS OF AGREEMENT AND DISAGREEMENT
Agreement: – All models acknowledge that the negative news (export restrictions, potential $5.5B charge) introduces strong bearish pressure. – There is a common observation that options open interest clusters around the $110 level (max pain) with heavy activity on both calls and puts, signaling sensitivities near that price. – Technical indicators in the very short term (5‑minute charts) show consolidation, even though the daily charts lean more bullish in some cases.
Disagreement: – Grok/xAI and Gemini conclude that the mixed signals (technical consolidation with bearish news drag) warrant no immediate trade at open. – Llama/Meta and DeepSeek tilt toward a moderately bearish view and recommend a put trade—though they differ on the exact strike (Llama selects ~$109, DeepSeek prefers $110) and premium levels. – Confidence levels differ substantially (from 0% and 30% up to 68–70%), reflecting uncertainty about whether the news or bullish technicals will dominate intraday.
───────────────────────────── 3. CONCLUSION & RECOMMENDED TRADE
Overall Market Direction Consensus: The environment remains ambiguous. Although the daily charts show some bullish resilience, the weight of recent negative news, the gravitational pull of $110 max pain, and heavy put volumes lean toward a modestly bearish bias. Still, the signals are mixed and the immediate post‑open direction is highly uncertain.
Recommended Trade (if you choose to be opportunistic): Based on Llama/Meta and DeepSeek—if you’re willing to take a moderately bearish bet at open—a put trade might be considered. However, note that Gemini and Grok/xAI advocate waiting for a clearer signal given the uncertainty.
For traders who prefer to have a trade based on a bias toward a downside reaction, one possible trade would be: • BUY a single‑leg, naked weekly PUT option. • Strike: $109.00 (ask premium of $0.84 is close enough given liquidity and moderate bearish distance). • Expiration: April 17, 2025 • Entry: at market open • Rationale: With a moderately bearish tilt from the negative news and max pain considerations, a $109 put offers a risk/reward profile in a premium region slightly above the ideal range (but acceptable given the high-impact catalysts). • Confidence Level: ~70% • Key risks: A continued short‑term consolidation or a “bounce” in price (especially if NVDA moves toward the max pain level and finds support) would hurt a put position. Also, any unexpected bullish catalyst could quickly overturn the bearish bias.
That said, because of the significant conflicting factors and the risk that the negative news may already be priced in, one could also justify sitting on the sidelines (as recommended by two of the models).
───────────────────────────── 4. FINAL RECOMMENDATION
In our view, the market is too conflicted for a high‑confidence directional bet. However, if you are inclined to act on the moderately bearish view—and you accept the risk of an early move against your position—the put side is the only candidate for a single‑leg trade. With that said, given the discord among the models (with two models advising “no trade”), a conservative trader might well decide to wait for clearer price action at the open.
───────────────────────────── TRADE DETAILS (JSON Format)
{ "instrument": null, "direction": null, "strike": null, "expiry": null, "confidence": null, "profit_target": null, "stop_loss": null, "size": null, "entry_price": null, "entry_timing": null }
───────────────────────────── FINAL NOTE: While there is some support for a moderately bearish put trade (for example, buying a $109 put at $0.84), the divergent signals from the models (including strong advice from two reports to avoid trading today) mean that risk management is paramount. Many quant practitioners would prefer to wait until post‑open confirmation before jumping in.
Disclaimer: This newsletter is not trading or investment advice but for general informational purposes only. This newsletter represents my personal opinions based on proprietary research which I am sharing publicly as my personal blog. Futures, stocks, and options trading of any kind involves a lot of risk. No guarantee of any profit whatsoever is made. In fact, you may lose everything you have. So be very careful. I guarantee no profit whatsoever, You assume the entire cost and risk of any trading or investing activities you choose to undertake. You are solely responsible for making your own investment decisions. Owners/authors of this newsletter, its representatives, its principals, its moderators, and its members, are NOT registered as securities broker-dealers or investment advisors either with the U.S. Securities and Exchange Commission, CFTC, or with any other securities/regulatory authority. Consult with a registered investment advisor, broker-dealer, and/or financial advisor. By reading and using this newsletter or any of my publications, you are agreeing to these terms. Any screenshots used here are courtesy of TradingView. I am just an end user with no affiliations with them. Information and quotes shared in this blog can be 100% wrong. Markets are risky and can go to 0 at any time. Furthermore, you will not share or copy any content in this blog as it is the authors' IP. By reading this blog, you accept these terms of conditions and acknowledge I am sharing this blog as my personal trading journal, nothing more.

US President Says All Necessary Permits Will Be Given to NVDAIn shocking turn of events today, US President Donald Trump said "All necessary permits will be expedited delivered to Nvidia."
The asset however, fail to play according to the rhythm of the fundamental, up by 1.51% as of the time of writing with the RSI at 56.27. Nvidia has also been plaque by Trump's tariff rate increment that saw the shares lose about 29% in market value for the past 3 weeks.
For Nvidia Shares ( NASDAQ:NVDA ), a break above the $150 resistant could pave way for a bullish course. Similarly, failure to break pass the resistant point could resort to a bearish reversal bringing it back to the support point.
Analyst Forecast
According to 43 analysts, the average rating for NVDA stock is "Strong Buy." The 12-month stock price forecast is $172.76, which is an increase of 53.68% from the latest price.

Quantum's NVDA Trading Guide 4/13/25Sentiment: Neutral. AI chip dominance drives optimism, but tariff risks and valuation concerns temper enthusiasm. Chatter posts split—bulls see growth, bears eye correction.
Outlook: Neutral, slightly bearish. Options pin $110, with $105 puts active. ICT/SMT eyes $108-$110 buys to $115 if $108 holds. Bearish below $108 risks $105.
Influential News:
Federal Reserve: Two 2025 cuts support growth stocks, positive for $NVDA.
Earnings: Q1 due May; no update today.
Chatter: Debates AI growth vs. tariff/supply chain risks.
Mergers and Acquisitions (M&A): No confirmed NASDAQ:NVDA M&A; AI chip partnerships rumored.
Other: Tariff volatility hit NASDAQ:NVDA ; stock swung (April 3-9).
Indicators:
Weekly:
RSI: ~50 (neutral).
Stochastic: ~45 (neutral).
MFI: ~40 (neutral).
SMAs: 10-day ~$112 (below, bearish), 20-day ~$115 (below, bearish).
Interpretation: Neutral, bearish SMAs signal weakness.
Daily:
RSI: ~48 (neutral).
Stochastic: ~50 (neutral).
MFI: ~45 (neutral).
SMAs: 10-day ~$112 (below, bearish), 20-day ~$115 (below, bearish).
Interpretation: Neutral, bearish SMAs suggest pullback.
Hourly:
RSI: ~45 (neutral).
Stochastic: ~55 (neutral).
MFI: ~50 (neutral).
SMAs: 10-day ~$112 (below, bearish), 20-day ~$115 (below, bearish).
Interpretation: Neutral, stabilizing.
Price Context: $110.93 (April 11), 1M: -9%, 1Y: +28%. Range $105-$120, testing $110 support.
Options Positioning (May 2025):
Volume:
Calls: $115 (12,000, 60% ask), $120 (10,000, 55% ask). Mild bullish bets.
Puts: $105 (8,000, 70% bid), $108 (6,000, 65% bid). Put selling supports $108.
Open Interest:
Calls: $115 (35,000, +6,000), $120 (25,000, +5,000). Bullish interest.
Puts: $105 (20,000, flat), $108 (22,000, +3,000). Hedging. Put-call ~1.0.
IV Skew:
Calls: $115 (40%), $120 (42%, up 3%). $120 IV rise shows upside hope.
Puts: $105 (35%, down 2%), $108 (36%). Falling $105 IV supports floor.
Probability: 60% $105-$120, 20% <$105.
Karsan’s Interpretation:
Vanna: Neutral (~300k shares/1% IV). IV drop could pressure $110.
Charm: Neutral (~150k shares/day). Pins $110.
GEX: +60,000. Stabilizes range.
DEX: +8M shares, neutral.
Karsan view: GEX holds $105-$120; tariff news key.
ICT/SMT Analysis:
Weekly: Neutral, $105 support, $120 resistance. No $NVDA/ NASDAQ:AMD divergence.
Daily: Bullish at $110 FVG, targets $115. Bearish < $108.
1-Hour: Bullish >$110, $115 target. MSS at $108.
10-Minute: OTE ($109-$111, $110) for buys, NY AM.
Trade Idea:
Bullish: 50%. ICT/SMT buys $108-$110 to $115. Options show $115 calls. Fed cuts aid.
Neutral: 35%. RSI (~50), SMAs (bearish), $105-$120 range.
Bearish: 15%. Below $105 possible with tariffs. $105 put volume grows

NVDA TO $176 BY JUNE THEN $1000 END OF YEARNVDA to $176 by June Then $1000 End of Year: A Bold Thesis
Key Points
It seems likely that NVDA could reach $176 by June 2025, supported by strong AI market trends and upcoming earnings, but reaching $1000 by year-end is highly speculative and controversial.
Research suggests Elliott Wave analysis shows a potential bullish trend, but specific price targets like $1000 lack broad analyst support.
The evidence leans toward significant growth potential due to NVDA's leadership in AI and new product launches, yet such aggressive targets involve high uncertainty.
Current Price and Market Context
As of April 9, 2025, NVDA's closing price on April 8 was $96.30, with pre-market trading at $98.22. This reflects recent volatility, with a 52-week range from $75.61 to $153.13. The stock's performance is tied to its dominance in AI and GPU markets, which are experiencing robust growth.
Analysis for $176 by June
Reaching $176 by June 2025, an 83% increase from $96.30, is ambitious but plausible. Upcoming earnings on May 28, 2025, estimate an EPS of $0.93 and revenue of $43.34 billion, with potential beats driving price surges. Elliott Wave analysis suggests NVDA may be completing a corrective phase, with a falling wedge pattern indicating a possible upward breakout, supporting short-term targets around $176.
Analysis for $1000 by Year-End
The prediction of $1000 by December 2025, a 940% increase, is highly speculative. While some analyses, like a Forbes article, suggest NVDA could see a tenfold rise by 2026 due to the Blackwell architecture, most analyst targets range from $170 to $235. This target lacks broad support and involves significant market and fundamental risks.
Unexpected Detail: Stock Split Impact
An unexpected factor is NVDA's 10-for-1 stock split in June 2024, adjusting prices from over $1,000 to current levels, making historical comparisons complex. This split aligns the $1000 target with post-split valuations, but achieving it requires unprecedented growth.
Survey Note: Detailed Analysis of NVDA's Potential Price Surge to $176 by June and $1000 by Year-End
Introduction
NVIDIA Corporation (NVDA), a leader in graphics processing units (GPUs) and artificial intelligence (AI), is currently trading at approximately $96.30 as of April 9, 2025, based on the closing price from April 8, with pre-market activity showing a slight uptick to $98.22. This analysis explores the feasibility of NVDA reaching $176 by June 2025 and an ambitious $1000 by the end of the year, leveraging Elliott Wave theory and other validated analytical methods. Given the stock's recent performance and market context, we examine technical patterns, fundamental catalysts, and long-term growth potential.
Current Market Position and Historical Context
NVDA's stock has shown volatility, with a 52-week range from $75.61 to $153.13, and a year-to-date change of -11.36% over the past week and -12.23% over the past month, per recent data. The all-time high was $153.13 on January 6, 2025, indicating significant upside potential from current levels. The market capitalization stands at $2.35 trillion, with a beta of 2.40, reflecting high volatility. Key financial metrics include an EBITDA of $83.32 billion and an EBITDA margin of 63.85%, underscoring strong profitability.
A critical context is the 10-for-1 stock split in June 2024, which adjusted share prices from over $1,000 to current levels, making historical comparisons complex. This split, detailed in a CNBC article (Nvidia announces 10-for-1 stock split), was aimed at making ownership more accessible, aligning with the user's post-split price targets of $176 and $1000.
Metric Value
Closing Price (Apr 8) $96.30 USD
Pre-Market Price (Apr 9) $98.22 USD
52-Week Range $75.61 - $153.13 USD
Market Cap $2.35T USD
Beta (1Y) 2.40
Earnings Next Report May 28, 2025, EPS Estimate $0.93, Revenue Estimate $43.34B USD
Last Quarter EPS $0.89 (estimated $0.85, +4.96% surprise)
Dividend Yield (TTM) 0.04%
Elliott Wave Analysis: Technical Insights
Elliott Wave theory, a method identifying market psychology through wave patterns, suggests NVDA may be in a corrective phase, potentially completing wave (4) of a larger five-wave structure. Recent analyses, such as those on TradingView (NVIDIA Stock Chart), indicate a falling wedge or ending diagonal formation, often signaling a reversal and start of an upward trend. This could support a move to $176 by June, as wave (5) projections often extend to 1.618 times wave (1), potentially aligning with such targets.
Specific Elliott Wave analyses, like those from ElliottWave-Forecast (Elliott Wave Expects New All Time High), suggest NVDA has completed corrections and is resuming higher, with wave counts indicating impulsive rallies. However, these analyses lack explicit price targets reaching $1000, focusing more on trend continuations.
Short-Term Target: $176 by June 2025
Reaching $176 by June 2025, an 83% increase from $96.30, is ambitious but supported by several factors. The earnings report on May 28, 2025, is a critical catalyst, with estimates for EPS at $0.93 and revenue at $43.34 billion. Given NVDA's history of beating estimates, as seen in the last quarter with EPS of $0.89 against an estimate of $0.85, a strong report could drive significant price appreciation.
Technical indicators, such as a breakout from the falling wedge, align with this target. Analyst price targets, ranging from $125 to $220 with an average of $177.19 per Zacks (NVIDIA Price Target), also support the possibility, with some forecasts reaching $235.92 (NVDA Forecast). However, achieving this in two months requires sustained bullish momentum and favorable market conditions.
Long-Term Target: $1000 by Year-End 2025
The prediction of $1000 by December 2025, a 940% increase from current levels, is highly speculative. Most analyst forecasts, such as those from MarketBeat (NVIDIA Stock Forecast) and TipRanks (Nvidia Stock Forecast), range from $170 to $235, far below $1000. However, a Forbes article from May 25, 2024 (Nvidia Stock Tops $1,000), suggests NVDA could see a tenfold rise by 2026 due to the Blackwell architecture, potentially supporting a $1000 target by late 2025 if growth accelerates.
Blackwell, a new GPU architecture, is expected to enhance NVDA's AI and data center offerings, potentially driving revenue growth. CoinCodex forecasts a high of $260.32 by December 2025 (NVIDIA Stock Forecast), still below $1000, indicating the target is outlier and involves significant risk. Market volatility, competition, and macroeconomic factors, such as tariff impacts noted in CNN reports (NVDA Stock Quote), add uncertainty.
Fundamental Catalysts and Risks
NVDA's fundamentals are strong, with consistent revenue growth and high EBITDA margins. The company's expansion into AI, autonomous systems, and supercomputers, as noted in LiteFinance (Nvidia Stock Price Prediction), supports long-term growth. However, short-term corrections due to overvaluation or market sentiment, especially around tariff concerns, pose risks.
X posts, such as one from @1000xStocks (X post), highlight NVDA's EPS growth reflecting AI monetization, suggesting bullish sentiment, but lack specific $1000 targets. Another from @ravisRealm (X post) notes adding positions at lower prices, indicating confidence but not supporting the $1000 target.
Conclusion
While reaching $176 by June 2025 is plausible with strong earnings and technical breakouts, the $1000 target by year-end is highly speculative, lacking broad analyst support and requiring unprecedented growth. Investors should monitor earnings reports, product launches like Blackwell, and market trends, while employing risk management strategies given the high uncertainty.

$NVDA and NVDA Dominance Fib retracement levelsNASDAQ:NVDA is now already in bear market territory and the next question when this slide in the stock price will stop. Today in our Daily dose of Chart we are looking into NVDA Feb retracement levels in the upward sloping channels and the NVDA Dominance in NASDAQ.
If we plot the upward sloping Fib retracement channel joining the top candles weekly chart within the upward sloping channel and then plot the Fib levels to the lowest levels of 2023 and 2024 then we see that the current price is at the 3.618 Fib level which is at 104 $. The next level is 4.236 and that level lies at approx. 95 USD. So if the sell of continues then the next price target is 95 USD.
In this blog space we have floated the idea of NVDA Dominance ($NVDA.D) which is just the ratio of NASDAQ:NVDA vs NASDAQ QQQ. The dark green line in the chart signifies the NVDA Dominance and it is currently well of its highs. If we simply plot the Fib retracement on the Dominance Line, then we see the next support is @618 which will give us a price of 99 $ on the NASDAQ:NVDA stock. So that means technical speaking we have great support and price memory between 95 $ - 99 $.
Verdict : Accumulate NASDAQ:NVDA here and go extra-long @ 95-99 $

NVDA Silicon Slippage: The Bearish Case for NVDA in 5 ContractsNVDA Bearish Options Thesis — “AI’s Reality Check”
A $500 Bet Against Hype, Headwinds, and a Tired Rally
Underlying: NVIDIA (NVDA)
Current Price: $109.67
Strategy: Buy 5x $90 PUTs expiring May 2, 2025 @ $1.00
Total Cost (Risk): $500
Breakeven: $89.00
Max Value at Expiry: $45,000 (if NVDA → $0)
Target Zone: $85–$95
Risk/Reward Profile: Asymmetric 1:9+
🧠 Thesis Summary: Why NVDA Could Drop
NVIDIA, the undisputed champion of the AI GPU race, now finds itself under increasing pressure from macro forces, competition, and sentiment. This trade capitalizes on a short-term reversal thesis into earnings season and macro repricing.
🚨 Key Catalysts for Downside:
🧬 1. AI Hype Fatigue
The market is cooling on generative AI names after 12+ months of hype.
Investor sentiment is shifting toward monetization over narrative — which hits NVDA’s high-multiple story.
💥 2. DeepSeek & Chinese Competition
The emergence of DeepSeek (a competitive LLM) raises the risk of a hardware shift in the East.
China accelerating self-sufficiency in chips = reduced NVDA demand.
📉 3. Macro Headwinds & Tariffs
Renewed trade war tensions threaten advanced chip exports.
Tariffs and tighter regulations = real demand compression for NVDA’s top-line growth.
📊 4. Technical Breakdown Confirmed
Weekly close below Fib 0.382 ($109.44) — now resistance.
RSI at 41.44 — weak and trending down.
Below VWAP ($113.65), signaling momentum shift.
"NVIDIA isn't breaking down because it's bad — it's breaking down because the market is waking up."
💰 Trade Breakdown: 5x $90 PUTs @ $1.00 (May 2, 2025)
Metric Value
Contracts 5
Cost per Contract $100
Total Premium $500
Breakeven $89.00
Max Gain $45,000
Max Loss $500 (premium only)
📊 P&L Scenarios (5 Contracts)
NVDA Price Drop % Intrinsic Value Total Payout Net Profit ROI (%)
$100 -8.8% $0.00 $0 -$500 -100%
$95 -13.4% $0.00 $0 -$500 -100%
$90 -17.9% $0.00 $0 -$500 -100%
$85 -22.5% $5.00 $2,500 $2,000 400%
$82.70 -24.6% $7.30 $3,650 $3,150 630%
$80 -27.1% $10.00 $5,000 $4,500 900%
🧮 Technical Levels to Watch
Level Price Notes
VWAP $113.65 Rejected
0.382 Fib $109.44 Just breached
0.5 Fib $96.07 Strong support
0.618 Fib $82.70 Bearish target
RSI 41.44 Weak momentum
✅ Summary
Factor Insight
Total Spent $500 (5x $90 PUTs @ $1.00)
Breakeven $89.00
Risk Fully capped at $500
Potential Return Up to $4,500 (900%) if NVDA → $80
Catalyst Market re-rating AI, earnings unknowns, regulatory clouds
Trade Horizon 33 days — high velocity post-breakdown possible
