NVDA: Held Key AreaWatching NVDA to bounce after filling and holding a major gap at 267.84. If we see SOXL start to go green or gaps up, wouldn't be surprised to see NVDA have a move back to 284/285 area. Overall market cannot be going into the gutter for this move to happen. NVDA should find local supply around $280.
If NVDA fails 256 for any reason, swing puts down to 230 may be an absolute monster payday.
Nvdalong

NVDA long NVDA analysis with the use of the fibonacci tool
entry: 267,00
stoploss: 257,50
TP: 300.00
I hope this will help you, i am a beginnig trader, so let me know if you have any tips or tricks

NVDA breakout above $315Similar pattern as other SEMIs. Expected breakout above $315. The important part is the consolidation in the $295-315 range. The perfect pattern would have a volatility contraction after the previous larger correction (check), volume dry-out (check), and then higher than average volume on the breakout to new intermediate highs above $315.

NVDA BEARISH WOLFE WAVE DAILYThere is a bearish wolfe wave setup on the daily time frame that triggered last week Dec 3, 2021. The projected target is calculated by extending a linear line between pivot 1 and 4 and projecting the line. This is represented as the red perforated line, as shown in the chart. The projected target is approx 180 which is represents a 5 standard deviation move. We do not believe NVDA will reach this level in the short term; however, it is probable that NVDA can take out some gaps that have been left open post run-up. Closest gap target is 267. If this tgt were to be achieved, I would expect it to sell off to 267 and lower Dec 14.

$NVDA Trade Idea $NVDA Trade Idea
Contract: 12/3 342.50c
Entry: 335
Targets: 327.20, 328, 339.30, 343.30
Stop loss: 15%

NVDA - STOCKS - 18. OCT. 2021Welcome to our Weekly V2-Trade Setup ( NVDA ) !
-
4 HOUR
Very bullish market structure..
DAILY
Expecting more bullish pa.
WEEKLY
Nvidia doing great overall!
-
STOCK SETUP
BUY NVDA
ENTRY LEVEL @ 221.01
SL @ 204.83
TP @ Open
Max Risk: 0.5% - 1%!
(Remember to add a few pips to all levels - different Brokers!)
Leave us a comment or like to keep our content for free and alive.
Have a great week everyone!
ALAN

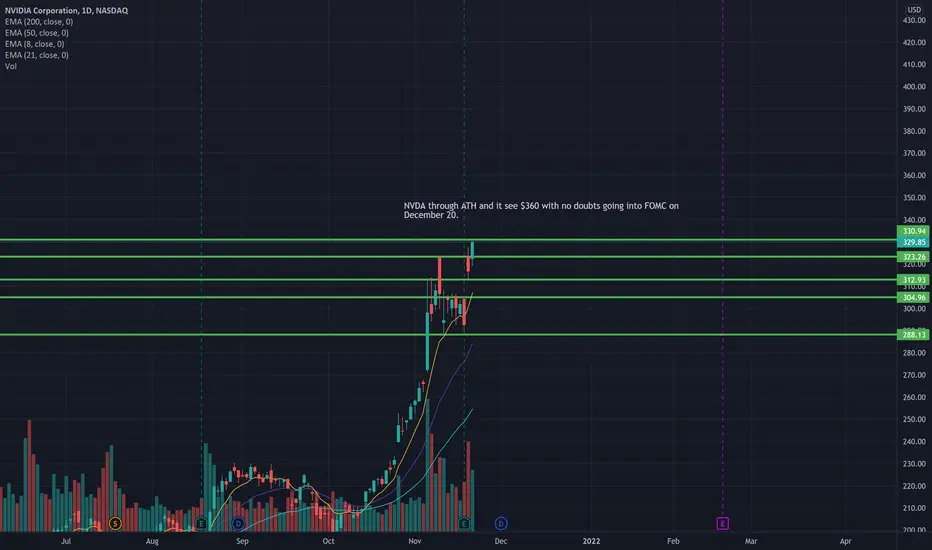
NVDA to $360 by FOMC in December NVDA through ATH and it see $360 with no doubts going into FOMC on December 20.
Solid NVIDIA earnng to Propel RallyRevenue increased more than expected to $7.1 Billion vs $6.83 expected. Demand for Nvidia AI is strong. Gaming Revenue up 42% from last year.
After hours we saw a jump to $306-7 but we have cleared the big risk event and a retest of recent all time highs is likely now the good news is out and behind us. Buying small pullbacks to $300 for test of $322.

$NVDA Trade Idea $NVDA has been really good to me the last few weeks and is still very strong. Had a good run with lots of call flow still coming in. Will be watching to take this back to that 327 level.
Entry: 309
Targets: 317, 323, then re-enter on the break of 327.
Contract: 11/19 320c
Stop Loss: 15%

NVDA: Cool Off Into Continued Active SequenceA date with $270 is in order, but I'm not sure it gets much below that. Could happen by Wednesday, but if $270 hits I will buy a new set of swings as that technically backtests and holds the bull flag.

NVDA: The Stock that Never Goes Down.Nvidia usually goes up around 3-5% per day, even 17% yesterday, and there is absolutely no reason why it shouldn’t continue to do so.
Heavy institutional buying is expected to catch every dip, but it is rather unlikely this stock will experience dips at all.
Elliott wave:
NVDA is unique in that it only has impulse waves 3, but no corrective waves 2/4. Therefore we are currently trading in the everlasting wave (iii) of 3 to the upside.
Gann:
In W.D. Gann’s book “Tunnel Thru the Air” we find a hidden instruction how to trade NVDA, which is to yolo call options whenever Saturn and Jupiter form a 90 degree angle after new moon, or any other angle, or at any other time.
Supports: 300, 299, 298, 297, etc.
Resistance: none
Correlations:
NVDA is correlated with QQQ in an uptrend, and when QQQ is in a downtrend then NVDA is inversely correlated to QQQ.
Fundamentals:
As the Metaverse is expected to replace planet earth after climate collapse, NVDA is well positioned to supply the necessary GPU, since our new existence is best enjoyed in high resolution.
NVDA price currently experiences exponential growth, which is extremely sustainable and can only accelerate, per all the laws of physics.
When Mark Douglas writes “the stock market is an everlasting stream of opportunities”, what he meant was actually the NVDA stock, but this appears to be a well-kept secret of institutional players.
________________
Disclaimer: The above analysis is for educational purpose only (lol) and not financial advice. Obviously it is satire, but I better mention it.
NVIDIA LONGThere was a rise in media consumption during the Covid Pandemic. Game and Electronic sports has grown immensely and Gaming PC's are more flexible and powerful than any console, therefore people that want to participate in gaming will migrate more towards Gaming PC which is where NVIDIA comes in. "inventor of the GPU, which creates interactive graphics on laptops".
Trust me graphics and performance are everything in gaming.
The Technical view would be that price has made a 79% retracement into a Bullish Orderblock , which is a discount array in ICT terms. Following the Orderflow, that is a reasonable price to look for a buy

$NVDAShares of semiconductor manufacturer Nvidia a supplier of chips for everything from playing video games to performing artificial intelligence tasks to mining cryptocurrency, dropped 2.2% through 10 a.m. EDT Friday. It's the last of those three chip uses -- mining cryptocurrency -- that seems to be weighing on the stock.
The People's Bank of China, you see, just announced that it is banning all cryptocurrency transactions in the country, and in particular, banning Bitcoin and Tether from circulating in China.
The move seems likely to weigh on Nvidia's business, but I wouldn't be too concerned for Nvidia stock despite the drop.
Consider: In its first-quarter earnings report earlier this year, Nvidia advised investors that a new line of semiconductors it had developed specifically for crypto mining generated $155 million in incremental revenue. Expand that out, and specific cryptocurrency-related revenue for the company may be as much as $620 million a year.
Now, that sounds like a lot, but as a percentage of Nvidia's $21.9 billion semiconductors business, it really amounts to just 2.7% of total revenue -- and even then, most of this revenue from sales to countries other than China should be unaffected by China's move.
Overall, I’m bullish on NVDA without question.
When we take a look at the daily & weekly chart you can see price has broken out of its ascending triangle to the upside and has also retested to see if it would act as support.
You have the MACD looking strong
& RSI sitting above 50.
Without question, this should be on your watchlist this week.
- Factor Four

Nvidia Stock projection after the drop Hello everyone, as we all know the market action discounts everything :)
_________________________________Make sure to Like and Follow if you like the idea_________________________________
Nvidia Stock starting push back up after the drop caused by the Evergrande problems where we see the stock pushing from 206.27 up to 225.34 in 3 days, That's almost a 10% increase in a very short period of time.
NVDA has an average volume of 26045000. This is a good sign as it is always nice to have a liquid stock.
Both The Long-term trend and Short-term trends are looking positive.
Possible Scenarios for the market :
Scenario 1 :
The market has reached the first resistance line located at 224.58 but a breakout didn't happen yet, Looking at how the trend is moving we should be seeing a breakout soon that will jack the stock price up and the first stop this stock is doing will be at the second resistance at 229.58 where it might have some push back from the Bears that could drive the price back to the 224.58 level, After reaching that point the Bulls will pull up and gather buy power to push the market to the 237.66 level.
Scenario 2 :
The market has reached the first resistance line located at 224.58, The Bears could step in and take control and drop the price here to show the Bulls that it's not gonna be easy for them to gain control which will lead the price dropping to the first support level at 214.42 where the battle over control will happen with Good chances of Bulls winning which will be the start of the push to the 237.66 level
Technical indicators show :
1) The market is above the 5 10 20 50 100 and 200 MA and EMA (Strong Bullish Sign)
2) The RSI is at 58.86 showing good strength in the market. No divergence has been found between the indicator and the market
3) The Stoch is in the upper end of the middle zone showing good momentum, With a positive crossover between the %K (78.31) and %D (52.83)
Daily Support & Resistance points :
support Resistance
1) 214.42 1) 224.58
2) 209.42 2) 229.58
3) 206.84 3) 233.65
Fundamental point of view :
When comparing the yearly performance of all stocks, we notice that NVDA is one of the better performing stocks in the market, outperforming 84% of all stocks and NVDA has a Return On Assets of 18.32%. This is amongst the best returns in the industry NVDA outperforms 88% of its industry peers.
The Earnings Per Share has grown by an impressive 80.78% over the past year.
"One of the reasons the stock is moving up can be seen in the Indicator column. The stock received a boost in its price target from Bank of America on Sept. 17, 2021. If NVDA stock reaches that price target it would be a gain of over 25% from the consensus price target. Bank of America may be reacting to Nvidia’s push to become seen as more than just a chip company and is spending over $1 billion on research and development to support that aim." According to Marketbeat
This is my personal opinion done with technical analysis of the market price and research online from Fundamental Analysts and News for The Fundamental point of view, not financial advice.
If you have any questions please ask and have a great day !!
Thank you for reading.

NVDA CHANNEL SUPPORT , POSSIBLE LONGNVDA is in a bullish uptrend momentum. Stochastic oversold give us an opportunity to enter near to 50 EMA used as support many times. Also 50 EMA coincides with a channel support created after the breakout of resistance at $ 207,34. ADX is above 21 suggesting that the trend is still strong. Moreover the channel support coincides with the 50% Fibonacci.
BUY ENTRY: $ 214.76
TAKE PROFIT: $ 229.54
TAKE PROFIT 2: $ 254.77
STOP LOSS: $ 201.59
____________________________
NOT FINANCIAL ADVICE

NVDA, Elliot Wave Theory: Analysis and StrategiesNvidia, is expected to present earning results today after market.
As undefined signs in the last days, I decided to make an Elliot wave analysis to check where we are at this point as this stock is long one for me.
I was surprised, scanning Fibonacchi’s on Elliot, that 3rd wave is exended.
No doubt as per fundamentals and innovation that this is a long term growth one. The thing now are its technicals to me, meanwhile we enter in a 4th wave, cost of opportunity is going to take an starring place.
Always taking in a dollars positions. Other countrys where money is not that robust one and or devaluated, shall be the same if your money is in an Elliot 4th wave for a long time or not. Also remember 4th could be not that 0.618 worse point but a 0.382 wich is not bad if your money devaluates less at that point. Then, 5th wave and your devaluation will be double key reasons to stay long.
Back in US dollars, think if you are in and the fourth wave takes place, two strategies come to mind: one is to stay into the 4th wave based on the fundamentals and innovation drivers of this stock, and also accumulate to catch the 5th wave, that well prepared. The the other strategie of these two is just stay out until the 5th takes place if you have a better one to invest, repurchasing when the 5th wave starts, only if you feel good at time management without losing the opportunity cost.
Conclusions> if fundamentals and innovation remain strong, there seems to be no room to lose for this growth investing.
If you are not there and the fourth wave takes place, you will have enough time to buy it.
I hope you like this analysis and it is useful for you.
Invest at your own risk.

NVDA - Potential for higher?The stock has broken out of the ascending channel and retested support. Is this confirmation that we are going even higher?

NVDA BreakoutNVDA is primed for a bullish breakout. The squeeze indicator is displaying a shift to bullish momentum, while the oscillator is about to display a ema crossover, allowing for a preempted play to the bullish side. Not only do we have two indications of bullishness, but we also have a stacked ema allowing for a great bull squeeze.
Bullish Signals
-Squeeze indicator
-Oscillator crossover
-Stacked ema
Weekly Support
-1st 194
-2nd 180

NVDA: Breakout of the range up.The range resistance level was broken upwards with the minimum target level around 766.

NVDA Short-term LONG/BULLISHNVDA Short-term LONG/BULLISH - we have seen a bounce off the Fibonacci Retracement 0.5 ($704.44) and a holding support of the 0.382 ($708.45), our next target is the 0.618 of the Fibonacci Extension, a ATH (All-time High) of $724.53! HAVE FUN TRADING!

NVDA Finally BreaksoutPrice broke higher from the consolidation area in play since the 4th of June. For the past week price has traded within 690 to 701 and provided good opportunities to play both sides of the market.
Open drive in Fridays early trading took price beyond the established range to make a new high of 709.30
A short pullback to test the upper range of the boundary presented the only opportunity to join in the move higher.
Has price found the legs to proceed higher in next week's trading?

NVDA broke out of the Descending Channel | NDVA ER Run Up$NVDA recently broke above this descending channel. With ER coming in 6 days, I will be watching closely for a continuation higher leading up to ER.
Today, we closed closely above the 61.80% fib level of $587. It is critical we hold this level, if not - a minor pullback/support at $569 - $571.90 would be a good retracement.
If we move higher, we will climb to the mental number of $600 and $613.27.

