Nvidia Analysis 09.12.2022Hello Traders,
welcome to this free and educational analysis.
I am going to explain where I think this asset is going to go over the next few days and weeks and where I would look for trading opportunities.
If you have any questions or suggestions which asset I should analyse tomorrow, please leave a comment below.
I will personally reply to every single comment!
If you enjoyed this analysis, I would definitely appreciate it, if you smash that like button and maybe consider following my channel.
Thank you for watching and I will see you tomorrow!
Nvdaprediction

Nvda bullish trend in continuationNVDA 1 hour chart seems to be in continuation of the uptrend. Fibonacci retracement shows that the price came and bounced back from the first support so it's a good time to buy. The chart is valid as long as it keeps making higher highs and lower highs.

NVDA | LongThis week was great for semi's NVDA is pending earning calls in Wednesday. As soon as could hold $155+ I estimate it could retest $175-$180 range.

NVDA is in downtrendNVDA is in downtrend pattern so a good time to short. Stoploss is previous LH. Entry point will be when it comes high and them make after making first bearish candle.

NVDA NVIDIA Corporation Strongest SupportNVDA NVIDIA Corporation looks ready for a technical rebound.
A technical rebound refers to a recovery from a prior period of losses when technical signals indicate that the move was oversold.
In this case, the Relative Strength Index momentum indicator of NVDA is below 30.
Even though i am overall bearish on the economy, buying a strong financial instrument when the RSI is below 30, would make a case for a potential short term reversal.
Looking forward to read your opinion about it.

2X $NVDA TP4 HIT for +30%! ($55 MOVE)WHAT A BEAUTIFUL SETUP & PLAYOUT! We executed this perfectly omg if you followed my analysis, you would've made so much profit its crazy!

NVDANot financial advice.
The essence of investing & trading is the intelligent and patient preying on the greed, fear, impatience, addiction and ignorance of the majority. It's definitionally Darwinian.

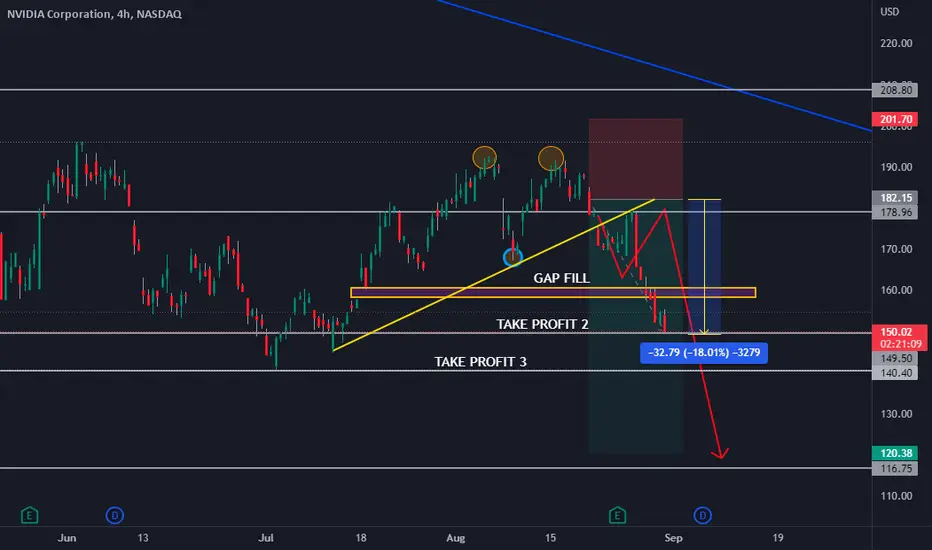
2X $NVDA GAP FILLED & TP2 HIT for 18%!$NVDA is plummeting right now, but my analysis is playing out perfectly! Hold this put if you are still in and dont get out until it pulls back +5%!
NVDA shortDowntrend for 1-2 days to retest pivot low $173/167.
Observe for bounce signal - will check @ $173 and/or $167 point

2X $NVDA 1D Tech. Analysis!NVIDIA is in between a short-term bull trendline and a long-term bear trendline. Being that is close to the bull line we are playing the break and retest or waiting for NVDA to retrace to the bear trendline and load up there!

NVDA WarningNVDA nearing border of pattern. Potential break towards the downside. 24.5 acting as strong resistance on daily chart.

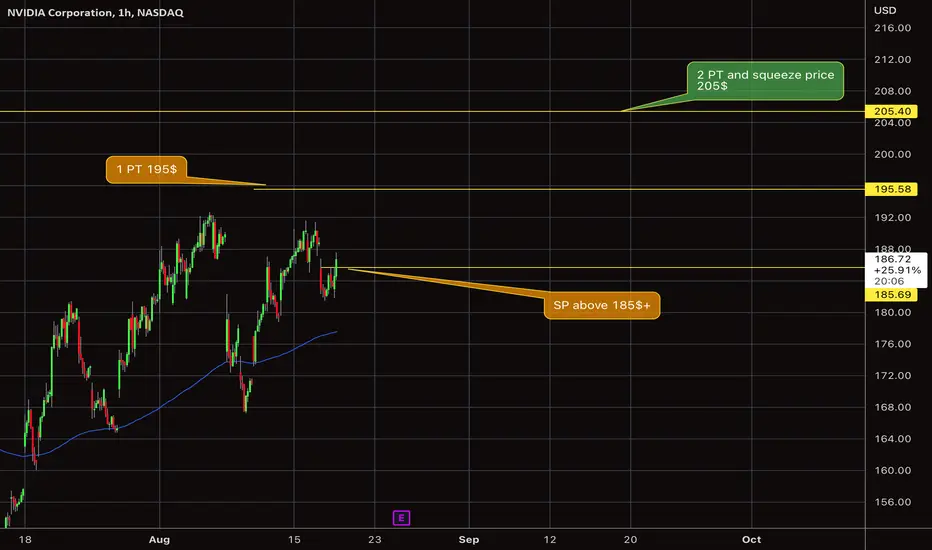
NVDA $ earning Target we need to hold this formed support to confirm the bull run till those 2 profit taking before the earring next week , and 205 will be the explosion level if we broke it .
$NVDA is on a Breaking Point$NVDA is on a short term is Neutral .
but in this market condition we are highly likely to visit 119$ demand level first.
Crypto Down
Stocks Selloff
TradeWise

NVDA Long SwingWith the recent sell off to $158 from earnings, looking for a recovery to the upside for a potential trade.

NVIDIA important levels...210 is in extremely essential level. As you can see, it is the bottom of a major channel.
180 is the next level...
NASDAQ:NVDA

NVDA: Buy zone is 248-258NVDA just completed its W-3 of its move off the March 8 low. Now it needs time to rest. Im seeing bearish divergences in RSI and MACD, indicating that the uptrend is becoming exhausted. Fibonacci extension targets have been reached. I own NVDA, and have sold covered calls against my position to protect my downside. The buy zone is 248-258. Longterm, this stock should be 400+ by EOY.

NVDA, We are moving in up trendHello guys
According to the chart you can see the price is moving downward trend and it has need more correction to have good R/r then we have permission to take short position until the target.
You should take signal at first then dont forget use stop loss and observe to your capital management.
Take a look on volume guys dont forget to check it, And dont forget to risk free and manage your position.
Everything is shown on chart, If you have question send us messages
Good Luck
Abtin

NVDA Buy area got Filled If you haven`t seen my last article about the Buy Area:
Then you should know that Nvidia and Intel might join forces to end Chip Shortage!
In this case, my sell area for NVDA is above the $307 resistance!
Looking forward to read your opinion about it.

NVDA: Descending Triangle Break NVIDIA - Short Term - We look to Sell at 206.22 (stop at 217.69)
Further downside is expected, however, due to the strong support below we prefer to sell a break of 210.00, which will confirm the bearish sentiment. Closed below the 20-day EMA. Short term oscillators have turned negative. Follow through bearish momentum from 346.00 resulted in net losses.
Our profit targets will be 165.54 and 137.15
Resistance: 250.00 / 270.00 / 285.00
Support: 210.00 / 200.00 / 190.00
Disclaimer – Saxo Bank Group. Please be reminded – you alone are responsible for your trading – both gains and losses. There is a very high degree of risk involved in trading. The technical analysis, like any and all indicators, strategies, columns, articles and other features accessible on/though this site (including those from Signal Centre) are for informational purposes only and should not be construed as investment advice by you. Such technical analysis are believed to be obtained from sources believed to be reliable, but not warrant their respective completeness or accuracy, or warrant any results from the use of the information. Your use of the technical analysis, as would also your use of any and all mentioned indicators, strategies, columns, articles and all other features, is entirely at your own risk and it is your sole responsibility to evaluate the accuracy, completeness and usefulness (including suitability) of the information. You should assess the risk of any trade with your financial adviser and make your own independent decision(s) regarding any tradable products which may be the subject matter of the technical analysis or any of the said indicators, strategies, columns, articles and all other features.
Please also be reminded that if despite the above, any of the said technical analysis (or any of the said indicators, strategies, columns, articles and other features accessible on/through this site) is found to be advisory or a recommendation; and not merely informational in nature, the same is in any event provided with the intention of being for general circulation and availability only. As such it is not intended to and does not form part of any offer or recommendation directed at you specifically, or have any regard to the investment objectives, financial situation or needs of yourself or any other specific person. Before committing to a trade or investment therefore, please seek advice from a financial or other professional adviser regarding the suitability of the product for you and (where available) read the relevant product offer/description documents, including the risk disclosures. If you do not wish to seek such financial advice, please still exercise your mind and consider carefully whether the product is suitable for you because you alone remain responsible for your trading – both gains and losses.

NVDA Buy AreaI`ve noticed that from time to time NVDA does some intraday retracements from which it recovers.
If you want to buy the sell-off wicks, you can put buy orders between $198 and $215.
In this choppy market there are chances for NVDA to hit the support areas more often before going up again.
Looking forward to read your opinion about it.

NVIDA: Heading to 200Hello friends, here is a fresh NVDA update. The structure has become quite clear. NVDA should be heading to the 190-210 region. I find it most probable that it will bottom at 200, because that is where the .5 fib retracement lies from this larger degree move. After this, it should move towards 400+ through the rest of the year. Good luck traders :)

NVDA: Back up the truck at 230The structure for NVDA is becoming more clear. It looks like we have one final low to make to about the 230 region to fill the gap. At that juncture, I will "back up the truck". Very bullish setup moving forward.

$NVDA Technical Analysis Two outcomes in the next few weeks.
ER beat 👉Re-test resistance.
ER miss👉 Break support - Re-test $205-$208
