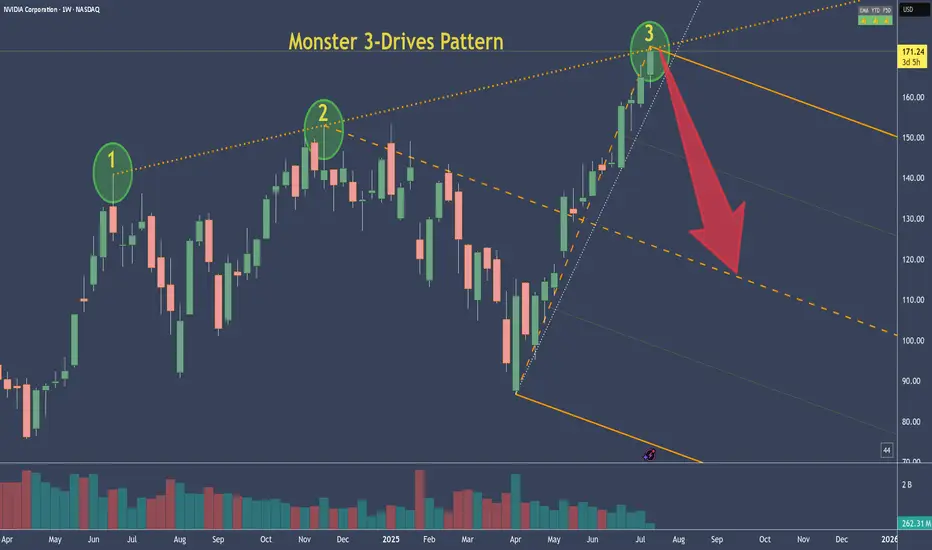
NVDA - NVIDIA's 3-Drive Pattern target if it plays outThis is the weekly chart of NVDA.
We can clearly see a 3-Drives pattern forming.
If this pattern plays out, the centerline would be my target. Of course, it's still too early to short.
But I’ve got my hunting hat on and I'm watching for signals on the daily chart.
One would be a break of the slanted trendline—but there are a couple of other conditions that need to align as well.
Always ask yourself: What if?
Nvdashort
SHORT Nvidia, Bearish Chart Setup, Resistance ConfirmedThe resistance from 21-May has been confirmed 28-May.
The same level has been working as resistance since 14-May.
After two weeks, this resistance level continues to hold and it is now confirmed.
In November 2024 NVDA produced a high.
Later in January 2025 NVDA produced an all-time high.
18-February 2025 NVDA went to produced a lower high; a rejection that led to a major drop.
The major drop resulted in a recovery and the recovery found resistance earlier this month. This resistance, the same from 14-May, 21 and 28-May, is also a lower high compared to the previous levels just mentioned.
The signal here is double: (1) Resistance confirmed and (2) a lower high.
There is one more. 28-May produced a volume breakout day. The day ended up closing red. So, Nvidia is confirmed bearish now.
Thank you for reading.
Namaste.

$NVDA - head and shoulders + possible bull shark harmonicOn my chart, NVDA appears to be potentially forming a head and shoulders pattern.
At the same time, an almost perfect bullish shark harmonic woukd comple around the target for the head and shoulders pattern.
Could be something, could be nothing.
But I'll be careful and not spend my money on NVDA just yet.
Positive earnings might invalidate this idea and send NASDAQ:NVDA to the moon instead.
Let's see what happens.

NVDA Weekly Options Trade Plan 2025-05-25NVDA Weekly Analysis Summary (2025-05-25)
Model Summaries Grok/xAI: Mixed technical signals—bullish on daily, bearish on 5-minute; neutral overall; no trade recommended (55% confidence). Claude/Anthropic: Moderately bearish; recommends buying the $128 put at ~$3.60 for a 50–100% profit target; confidence 72%. Llama/Meta: Moderately bearish but views premium/risk as unfavorable for buying; instead suggests selling the $130 put; confidence 70%. Gemini/Google: Strong intraday bearish technicals and negative sentiment; recommends buying the $120 put at ~$1.24 as a day trade; confidence 65%. DeepSeek: Moderately bearish but sees premiums >$1 as too rich; no trade recommended (55% confidence). Areas of Agreement and Disagreement Agreement: • Overall moderately bearish bias for NVDA into weekly expiry. • Rising VIX, max-pain near $126, and negative news support downside. Disagreement: • Trade/no-trade: Grok and DeepSeek pass, Claude, Gemini and Llama propose trades. • Strike selection: Claude prefers $128 put; Gemini $120 put; Llama sells $130 put. • Strategy type: All bearish ideas are buy puts except Llama, which suggests naked put selling. Conclusion Overall Market Direction: Moderately Bearish for the week ending 2025-05-30. Recommended Trade: Buy a weekly put to capture the expected pull toward the $126 max-pain level. • Instrument: NVDA 2025-05-30 $128 Put • Entry Timing: At market open • Entry Price: $3.65 (ask) • Profit Target: $5.48 (≈50% gain ⇒ midpoint sell or scale) • Stop Loss: $2.56 (≈30% loss) • Size: 1 contract Confidence Level: 70% Key Risks and Considerations: • Intraday oversold conditions could trigger a short-term bounce. • Theta decay accelerates late in the week—need timely exit. • Holiday-shortened week may damp momentum. • Liquidity is good at the $128 strike but bid-ask spread and slippage can impact execution.
TRADE_DETAILS (JSON Format)
{ "instrument": "NVDA", "direction": "put", "strike": 128.0, "expiry": "2025-05-30", "confidence": 0.70, "profit_target": 5.48, "stop_loss": 2.56, "size": 1, "entry_price": 3.65, "entry_timing": "open", "signal_publish_time": "2025-05-25 10:57:51 UTC-04:00" } 📊 TRADE DETAILS 📊 🎯 Instrument: NVDA 🔀 Direction: PUT (SHORT) 🎯 Strike: 128.00 💵 Entry Price: 3.65 🎯 Profit Target: 5.48 🛑 Stop Loss: 2.56 📅 Expiry: 2025-05-30 📏 Size: 1 📈 Confidence: 70% ⏰ Entry Timing: open 🕒 Signal Time: 2025-05-25 10:58:05 EDT
Disclaimer: This newsletter is not trading or investment advice but for general informational purposes only. This newsletter represents my personal opinions based on proprietary research which I am sharing publicly as my personal blog. Futures, stocks, and options trading of any kind involves a lot of risk. No guarantee of any profit whatsoever is made. In fact, you may lose everything you have. So be very careful. I guarantee no profit whatsoever, You assume the entire cost and risk of any trading or investing activities you choose to undertake. You are solely responsible for making your own investment decisions. Owners/authors of this newsletter, its representatives, its principals, its moderators, and its members, are NOT registered as securities broker-dealers or investment advisors either with the U.S. Securities and Exchange Commission, CFTC, or with any other securities/regulatory authority. Consult with a registered investment advisor, broker-dealer, and/or financial advisor. By reading and using this newsletter or any of my publications, you are agreeing to these terms. Any screenshots used here are courtesy of TradingView. I am just an end user with no affiliations with them. Information and quotes shared in this blog can be 100% wrong. Markets are risky and can go to 0 at any time. Furthermore, you will not share or copy any content in this blog as it is the authors' IP. By reading this blog, you accept these terms of conditions and acknowledge I am sharing this blog as my personal trading journal, nothing more.

US President Says All Necessary Permits Will Be Given to NVDAIn shocking turn of events today, US President Donald Trump said "All necessary permits will be expedited delivered to Nvidia."
The asset however, fail to play according to the rhythm of the fundamental, up by 1.51% as of the time of writing with the RSI at 56.27. Nvidia has also been plaque by Trump's tariff rate increment that saw the shares lose about 29% in market value for the past 3 weeks.
For Nvidia Shares ( NASDAQ:NVDA ), a break above the $150 resistant could pave way for a bullish course. Similarly, failure to break pass the resistant point could resort to a bearish reversal bringing it back to the support point.
Analyst Forecast
According to 43 analysts, the average rating for NVDA stock is "Strong Buy." The 12-month stock price forecast is $172.76, which is an increase of 53.68% from the latest price.

FREE Day Trade Setup 15April: $NVDA🚨 FREE Day Trade Setup: NASDAQ:NVDA 🚨
🚀 Bullish Scenario:
Entry: Break above $111.88 (S/R Area)
🎯 Targets: 10% / $112.70, $114.05, PDH
📈 Instruments:
Options: April 18th $112 Calls
🚪 Exit: Close below H5 on chosen timeframe (2m / 5m / 15m)
📉 Bearish Scenario:
Entry: Break below PDL at $109.07
🎯 Targets: 10% / $108.01, $106.92, $105.77
📉 Instruments:
Options: April 18th $109 Puts
🚪 Exit: Close below H5 on chosen timeframe (2m / 5m / 15m)
Not Financial Advice

NVIDIA At The 1/4 Line - Secure Profits Now?
Currently at the 1/4 line, we can expect a potential pullback. So, if you want to secure some of your fat profits, just do it.
Why not 50% ?
If it goes up again, you have secured 50%.
If it goes down, you still have 50% for a runner.
However, I'm still follow the rule-set and the trading-framework of the Medianlines. Doing this, I know that prices PTG is the Center-Line.

NVDA - Do it again Sam - Insider only sold, not boughtI have posted enough about what's going on in NVDA. It's important in this Stock, to not going crazy, not matter what one thinks it "will" or "could" happen.
A great Hint by Unusual Whales is, that insiders had only sold in the last year, never bought their one Stock.
...what does that telly us?
May profits be with us §8-)

NVDA : Good shopping pointshello friends
We have analyzed these stocks for you in a very simple way. In the long term...
We have identified good shopping points where you can shop.
Note that the price is at the ceiling of the channel and it is not logical to buy at the ceiling of the channel, so either we buy in case of correction or if the channel is broken and its failure is valid, we can buy.
*Trade safely with us*

NVDA - Back again, now down again?The pattern seems to repeat.
Again, we had a HAGOPIAN, which sais, that price goes back more than from where it came, and this rule was right.
Up in here, I'm not that confident anymore that price will reach the Centerline. But, it's not about what I think, or how confident I'm are. I just have to follow my Strategy and act according to the Rules, the trading framework of the Medianlines.
That said, we either shoot up on earnings, or we definitely tank down. For now, there is no trade, only a Gamble. I rarely gamble, so I'll sit on the sidelines and let it happen whatever will come out on earnings.
As for a Lotto-Ticket, I would buy some Puts and just have fun to watch how they get burned, or how I get a Christmas Moment in the beginning of the new year §8-)

Seems like buying pressure will fall for a while in NVDAFollowing the negative news recently, including fears of a trade war between USA and China, and the concern about the cheaper AI moder DeepSeek, made the shares of Nvidia fall. Shares of other hight-tech companies also fell including Alphabet, Apple and Microsoft.
On the technical the price broke the strong support trendline from beginning of 2024 while also making a big gap down at the start of the week. The 100EMA is also broken down, indicating the beginning of a short/mid-term pullback.
The selling idea here is interesting, but risky. I will be looking for sell setups with small lots in the coming days.

NVDA - 25% correction ahead!NVDA looks bearish in 3d chart as it shows a breakdown of the rising wedge pattern.
continuation of decline is expected!
The price is expected to target the 0.618 Fibonacci level, which implies a 25% decline
Best regards Ceciliones🎯

NVDA: Looks like bottom to me!NASDAQ:NVDA : Looks like bottom to me!
- Volume shelf
- 50D MA
- S/R Zone
- Almost at Green support beam on Wr%
- Above bull flag breakout retest
$135▶️$160 inbound 🎯
Not financial advice

NVDA - Waiting for a pullback to add to my short exposureThe first NVDA analysis went pretty well.
Let's see what we can do from here.
Over the weekend the world was going crazy once more. This knocked the markets down and they opened in the red, and so does NVDA.
I would like to see a pullback to the 1/4 line. Because this would give me the chance to load the short even more.
Target is the Center-Line.
(Former analysis linked)

Mr.Million | NVDA Chart and potential Buy AreaIn my last post, I shared three (3) reasons why I was bearish on NVDA 📉:
Thanks to China and #DeepSeek_AI challenging NVDA’s monopolistic dominance in AI-related graphics chips, NVDA has since nosedived to ~$120.
What now? I believe there’s still more room to fall (and I’ll be waiting). 📉
🔥~$90-100 = Strong Buy 🚛🚛🚛

Mr.Million | Why I am Bearish on NVDA Near TermNVDA appears to have completed Wave (3) and could drop to ~$100.
A potential ending diagonal forming + DOUBLE bearish divergence. 🚨
NVDA feels heavy. Unlike the past two breakouts that blasted through resistance like a 🚀, the latest breakout at ~$141 feels like it’s stuck in the mud! 😞
So, where would I go long?
🔥~$100 = Very Strong Buy 🚛🚛🚛
Remember: if NVDA falls, so will Nasdaq (and BTC)! I am holding lots of cash! 💰💰

NVDA Stock Update: Downtrend Alert!📉 NVDA Stock Update: Downtrend Alert! 🚨
Attention traders!
As we analyze the current market structure for NVIDIA (NVDA), it's crucial to note the recent developments on the daily chart.
Key Observations:
Market Behavior Since December 20, 2024: NVDA has been in a ranging market, characterized by significant volatility.
Bearish Signal: We witnessed a huge bearish engulfing pattern, indicating strong selling pressure. This is a critical signal for traders to consider.
Break of Key Level: The recent higher high can now be defined as a Lower High (LH) as the base of the order block at $129.60 has been broken.
Expected Support Levels:
As we move forward, we anticipate the following support levels:
$124.94
$120.33
$115.78
We are particularly focused on potential accumulation within this Demand Zone. It's essential to stay vigilant and adapt your strategies accordingly!
Happy trading, and stay safe! 📊💼

NVDA - Same Pattern, Same ShortWe have the same pattern going on in NVDA as last time.
1. Hagopian
2. Break of the U-MLH
and 3. potentially back into the Fork again.
I'm prepared for the next short with profit targets at the 1/4 line and the Centerline.

NVIDIA's Momentum A Breakout Story in Progress1. Trend and Structure
The chart showcases an upward momentum, breaking out of a prior resistance level, indicating bullish pressure. The breakout aligns with the upward-sloping trendline, which serves as a strong support structure.
2.Breakout Confirmation
The price has successfully broken through a resistance level, confirming a bullish breakout. This signals potential continuation toward the marked target zone.
3.Entry Point
The entry appears to have been taken near the breakout point, at approximately $141.60, aligning with the bullish momentum.
4. Target (Take Profit)
The take-profit level is marked at $152.94, representing a reasonable upward move from the breakout point. This target aligns with the continuation of the trend.
5. Stop Loss
The stop-loss level is placed at $133.46, below the recent support and trendline. This level ensures protection in case the breakout fails.
6.Risk-Reward Ratio
The setup demonstrates a healthy risk-to-reward ratio, with potential gains outweighing the risks. This indicates a well-calculated trade.
7. Technical Indicators
The momentum of the candles breaking the resistance shows strong bullish interest. No immediate signs of bearish divergence or reversal are visible in the chart.
The chart reflects a bullish breakout setup in NVIDIA's stock price. With strong momentum and a clear trendline breakout, the trade aligns well with the current upward movement. The target and stop-loss levels are well-placed, adhering to a disciplined trading strategy.

Nvidia Wyckoff Distribution- Volume Decreasing
- Reversal Descending Wedge
- Wyckoff Entered Phase E
If this Scenario comes true, AI Bubble will Burst and we will see Market Crash.
Or at least a recession.
Any Upside Move Wil Invalidate This Analysis.

NVDA - A 90% Short fall to the centerline ($100-$104) or lowerDouble top, failed breakout of the high—call it what you will.
Fact is, NVIDIA has taken a brutal hit and is now trading back inside the fork.
Hagopian—what on earth is a HAGOPIAN?
According to the Fork Framework rulebook, if the market fails to reach its next target (the next line, such as the centerline, lower median line parallel, etc.), it reverses and moves further back than where it started.
This is (not so exactly) what happened in December. Instead of reaching the centerline, the market turned, shot beyond the upper median line parallel (U-MLH), and was supposed to break above the November 21st high. It missed that target as well. And this, my friends, is....?
...again, a HAGOPIAN!
Now, it’s heading south again. But this time, we have an over 90% probability of reaching the centerline. Why? Because when the market breaks above the U-MLH and then falls back into the fork, it’s a very bearish signal.
Of course, nothing works 100%. The market could turn around today and push past the high. But statistically, we’re aiming for the centerline—and there’s an over 90% chance we’ll hit it.
When will it happen?
Sorry, my crystal ball is broken.
All I do is follow the Fork/Median Line rulebook and rely on my experience.
As for me, I’m opening a short position in NVIDIA today and may add to it on the way down to the centerline. And I play this game with Options, so no hard price level stop for me.

NVIDIA - Arguments For BearsAs in my last post "Arguments For Bulls" I do my Analysis for NVDA with eyes of a Bear.
We see the red down sloping Pendulum Swing Pitchfork. Because the A-Point is LOWER than the C Point, it's a Pullback Fork that would give us the potential downfall target at the Center-Line, before the Pendulum of price would swing to the upside again.
- the "Trend Barrier Dow" was breached
- price reacted to the tick multiple times at the U-MLH (White Rectangle) (Upper-Medianline-Parallel). This is clear resistance.
- Price just filled the GAP from 3 Days ago, so it can continue in the opposite direction (down) again.
So, that's it.
You have 3 ways to play this:
Long, Short, Flat.
Earnings of such a Market influential underlying is a pure gamble. I grab some Pop-Corn and watch the show and see, which of the cases is wrong and right. §8-)
Happy Profits all

$NVDA Short OpportunitiyReasons I am bearish on NASDAQ:NVDA
4-hour trendline resistance
4-hour bearish order block
Entry: 131.98
Take Profit: 100.27 (scale profits on the way down)
Stop Loss: 140.80
