NVDA Long - short term Expecting a short-term boost next week towards $98-100-109
A pull back to retest $100/95/85/73 is expecting later next week and following week for a consolidation.
Long term -- Bull
Nvdashort

$NVDA is on a Breaking Point$NVDA is on a short term is Neutral .
but in this market condition we are highly likely to visit 119$ demand level first.
Crypto Down
Stocks Selloff
TradeWise

NVDA Nvidia Buy NowAccording to my chart analysis , NVDA Nvidia Show strong signal to buy , buy max as you can . wave five !

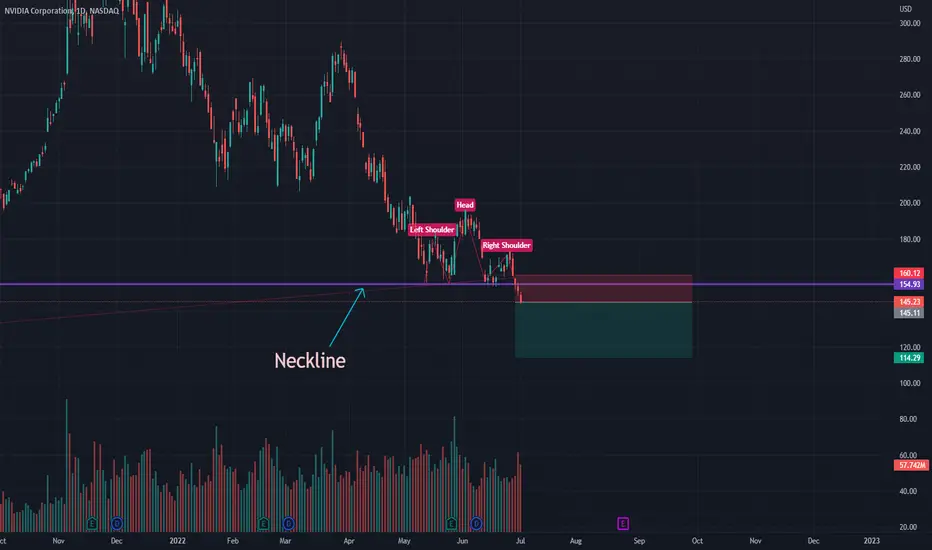
NVDA time to sellafter the creation of the reversal figure ''Head and Shoulders'' and the confirmation of the breakout of the ''Neckline'' we can take the sell position after the opening of the market
NVIDIA: Fangs still down!!NVIDIA
Short Term - We look to Sell at 179.80 (stop at 197.51)
The primary trend remains bearish. A move higher faces tough resistance and we remain cautious on upside potential. Selling spikes offers good risk/reward. Further downside is expected.
Our profit targets will be 141.02 and 130.00
Resistance: 180.00 / 190.00 / 200.00
Support: 170.00 / 160.00 / 150.00
Please be advised that the information presented on TradingView is provided to Vantage (‘Vantage Global Limited’, ‘we’) by a third-party provider (‘Signal Centre’) . Please be reminded that you are solely responsible for the trading decisions on your account. There is a very high degree of risk involved in trading. Any information and/or content is intended entirely for research, educational and informational purposes only and does not constitute investment or consultation advice or investment strategy. The information is not tailored to the investment needs of any specific person and therefore does not involve a consideration of any of the investment objectives, financial situation or needs of any viewer that may receive it. Kindly also note that past performance is not a reliable indicator of future results. Actual results may differ materially from those anticipated in forward-looking or past performance statements. We assume no liability as to the accuracy or completeness of any of the information and/or content provided herein and the Company cannot be held responsible for any omission, mistake nor for any loss or damage including without limitation to any loss of profit which may arise from reliance on any information supplied by Signal Centre.

It's broken through support - whats next for Nvidia? NVIDIA
Short Term - We look to Sell at 212.65 (stop at 225.34)
Our bespoke support of 210.00 has been clearly broken. Closed below the 20-day EMA. Mixed and choppy price action resulted in the early move lower being sustained and prices closing lower. The 61.8% fibonacci extension level is the target.
Our profit targets will be 160.25 and 124.10
Resistance: 210.00 / 250.00 / 290.00
Support: 190.00 / 160.00 / 150.00
Disclaimer – Saxo Bank Group. Please be reminded – you alone are responsible for your trading – both gains and losses. There is a very high degree of risk involved in trading. The technical analysis, like any and all indicators, strategies, columns, articles and other features accessible on/though this site (including those from Signal Centre) are for informational purposes only and should not be construed as investment advice by you. Such technical analysis are believed to be obtained from sources believed to be reliable, but not warrant their respective completeness or accuracy, or warrant any results from the use of the information. Your use of the technical analysis, as would also your use of any and all mentioned indicators, strategies, columns, articles and all other features, is entirely at your own risk and it is your sole responsibility to evaluate the accuracy, completeness and usefulness (including suitability) of the information. You should assess the risk of any trade with your financial adviser and make your own independent decision(s) regarding any tradable products which may be the subject matter of the technical analysis or any of the said indicators, strategies, columns, articles and all other features.
Please also be reminded that if despite the above, any of the said technical analysis (or any of the said indicators, strategies, columns, articles and other features accessible on/through this site) is found to be advisory or a recommendation; and not merely informational in nature, the same is in any event provided with the intention of being for general circulation and availability only. As such it is not intended to and does not form part of any offer or recommendation directed at you specifically, or have any regard to the investment objectives, financial situation or needs of yourself or any other specific person. Before committing to a trade or investment therefore, please seek advice from a financial or other professional adviser regarding the suitability of the product for you and (where available) read the relevant product offer/description documents, including the risk disclosures. If you do not wish to seek such financial advice, please still exercise your mind and consider carefully whether the product is suitable for you because you alone remain responsible for your trading – both gains and losses.

NVDA short should drop in price to 190-195NVDA SHORT 21/04/22 07:00 GMT
14 year old English trader trading on demo accounts currently gaining experience in the markets.
NASDAQ:NVDA should drop to around the 200-205 price mark because of many factors such as inflation, monetary policy tightening, and current market sentiment.
NVDA has been deeply affected by the current market sentiment dropping 19.65% in the last month. This large price drop was caused by many things such as inflation, inflation usually negativity impacts growth stocks and positively or neutrally impacts value stocks and as NVDA is a high growth stock it has some of the best growth aspects in its sector. So, inflation has caused a large downfall for NVDA and the way the fed is aggressively trying to combat inflation suggests there is a hard landing coming for the markets. Soring electricity prices has caused NVDA to have higher operating costs. One single semiconductor factor takes up 100 megawatts per hour and usually run between 10-12 hours in a day taking around 1,100 megawatts per day. Which means it could deeply affect their earnings this quarter causing their stock price to fall. NVDA will continue to drop because of these reasons and as the Ukraine war continues on NVDA earnings will continued to be affected. NVDA is a strong buy for longer term but during this bear market with potential of recession of 35% in the next to year (predicted by Goldman Sachs) and the aggressive fed combating inflation has never been done before without a full-blown recession which suggests a tough period for the market is coming as well as NVDA
Market wrap 9:00 GMT
NVDA is currently at 20.65 which I predicted earlier the chance that NVDA ends up in the positive quite high as it is classed as oversold by the RSI which could pick up a lot of potential buyers but I can see NVDA trading between 205-195 price region over the next few days. The main reason why NVDA’s stock dropped 6.05% today was because of the death cross which is when the 50-day moving average moves below the 200-day moving average which suggest this bear market is here to stay and NVDA’s stock will continue to drop. This suggest to us that this market is not going to be short term and as the us ten-year bond rose 2.93% today which will negatively impact stocks because they usually are inversely propionate. This is why I believe NVDA should drop even further to around the 190-195 price level which could be another opportunity for a buy position I believe over the next few days the stock could rally 3 or 4% which could be a good opportunity to short.
Semiconductors stocks such as AMD or intel. AMD has dropped by 22.05 % in the last month and suggests a strong sell signal as it hit below 90 per share today. Intel has dropped 2.03% in the last month but as it is a more mature company this is expected. This suggests to us that the semiconductor market is set to fall even further as the reason I mentioned early about high energy prices causing semiconductor companies to have a negative impact on their earnings. Causing people to take short positions in these companies. This also shows the impact of inflation on growth stocks as I talked about earlier
To conclude I do not believe that NVDA will have a complete trend reversal against the S&P in this current bear market and will continue to fall has an influx of negative news continues to be delivered on inflation and energy prices. As well as the increasing fear of a recession approaching.

NVDA: Buy zone is 248-258NVDA just completed its W-3 of its move off the March 8 low. Now it needs time to rest. Im seeing bearish divergences in RSI and MACD, indicating that the uptrend is becoming exhausted. Fibonacci extension targets have been reached. I own NVDA, and have sold covered calls against my position to protect my downside. The buy zone is 248-258. Longterm, this stock should be 400+ by EOY.

NVDA: Descending Triangle Break NVIDIA - Short Term - We look to Sell at 206.22 (stop at 217.69)
Further downside is expected, however, due to the strong support below we prefer to sell a break of 210.00, which will confirm the bearish sentiment. Closed below the 20-day EMA. Short term oscillators have turned negative. Follow through bearish momentum from 346.00 resulted in net losses.
Our profit targets will be 165.54 and 137.15
Resistance: 250.00 / 270.00 / 285.00
Support: 210.00 / 200.00 / 190.00
Disclaimer – Saxo Bank Group. Please be reminded – you alone are responsible for your trading – both gains and losses. There is a very high degree of risk involved in trading. The technical analysis, like any and all indicators, strategies, columns, articles and other features accessible on/though this site (including those from Signal Centre) are for informational purposes only and should not be construed as investment advice by you. Such technical analysis are believed to be obtained from sources believed to be reliable, but not warrant their respective completeness or accuracy, or warrant any results from the use of the information. Your use of the technical analysis, as would also your use of any and all mentioned indicators, strategies, columns, articles and all other features, is entirely at your own risk and it is your sole responsibility to evaluate the accuracy, completeness and usefulness (including suitability) of the information. You should assess the risk of any trade with your financial adviser and make your own independent decision(s) regarding any tradable products which may be the subject matter of the technical analysis or any of the said indicators, strategies, columns, articles and all other features.
Please also be reminded that if despite the above, any of the said technical analysis (or any of the said indicators, strategies, columns, articles and other features accessible on/through this site) is found to be advisory or a recommendation; and not merely informational in nature, the same is in any event provided with the intention of being for general circulation and availability only. As such it is not intended to and does not form part of any offer or recommendation directed at you specifically, or have any regard to the investment objectives, financial situation or needs of yourself or any other specific person. Before committing to a trade or investment therefore, please seek advice from a financial or other professional adviser regarding the suitability of the product for you and (where available) read the relevant product offer/description documents, including the risk disclosures. If you do not wish to seek such financial advice, please still exercise your mind and consider carefully whether the product is suitable for you because you alone remain responsible for your trading – both gains and losses.

A little more pain ahead for SemisLooking for a fill of the gap at 232 which coincides with the 2.0 extension of this 5-wave move down. Head & Shoulders pattern with negative MACD divergence.

NVDA Short at Resistance SetupNVIDIA - Short Term - We look to Sell at 251.38 (stop at 266.57)
We look to sell rallies. 50 1day EMA is at 248.00. Trend line resistance is located at 252.00. Short term oscillators have turned negative. The daily chart technicals suggests further upside before the downtrend returns. Further downside is expected although we prefer to set shorts at our bespoke resistance levels at 250.00, resulting in improved risk/reward.
Our profit targets will be 210.70 and 201.15
Resistance: 250.00 / 270.00 / 285.00
Support: 210.00 / 200.00 / 190.00
Disclaimer – Saxo Bank Group. Please be reminded – you alone are responsible for your trading – both gains and losses. There is a very high degree of risk involved in trading. The technical analysis, like any and all indicators, strategies, columns, articles and other features accessible on/though this site (including those from Signal Centre) are for informational purposes only and should not be construed as investment advice by you. Such technical analysis are believed to be obtained from sources believed to be reliable, but not warrant their respective completeness or accuracy, or warrant any results from the use of the information. Your use of the technical analysis, as would also your use of any and all mentioned indicators, strategies, columns, articles and all other features, is entirely at your own risk and it is your sole responsibility to evaluate the accuracy, completeness and usefulness (including suitability) of the information. You should assess the risk of any trade with your financial adviser and make your own independent decision(s) regarding any tradable products which may be the subject matter of the technical analysis or any of the said indicators, strategies, columns, articles and all other features.
Please also be reminded that if despite the above, any of the said technical analysis (or any of the said indicators, strategies, columns, articles and other features accessible on/through this site) is found to be advisory or a recommendation; and not merely informational in nature, the same is in any event provided with the intention of being for general circulation and availability only. As such it is not intended to and does not form part of any offer or recommendation directed at you specifically, or have any regard to the investment objectives, financial situation or needs of yourself or any other specific person. Before committing to a trade or investment therefore, please seek advice from a financial or other professional adviser regarding the suitability of the product for you and (where available) read the relevant product offer/description documents, including the risk disclosures. If you do not wish to seek such financial advice, please still exercise your mind and consider carefully whether the product is suitable for you because you alone remain responsible for your trading – both gains and losses.

NVIDIA to Sell-off? NVIDIA - Short Term - We look to Sell at 269.00 (stop at 291.43)
We look to sell rallies. Previous resistance located at 270.00. Previous support located at 210.00. Trading within a Bearish Channel formation. The daily chart technicals suggests further upside before the downtrend returns. Further downside is expected although we prefer to set shorts at our bespoke resistance levels at 270.00, resulting in improved risk/reward.
Our profit targets will be 211.24 and 201.15
Resistance: 270.00 / 285.00 / 330.00
Support: 210.00 / 200.00 / 190.00
Disclaimer – Saxo Bank Group. Please be reminded – you alone are responsible for your trading – both gains and losses. There is a very high degree of risk involved in trading. The technical analysis, like any and all indicators, strategies, columns, articles and other features accessible on/though this site (including those from Signal Centre) are for informational purposes only and should not be construed as investment advice by you. Such technical analysis are believed to be obtained from sources believed to be reliable, but not warrant their respective completeness or accuracy, or warrant any results from the use of the information. Your use of the technical analysis, as would also your use of any and all mentioned indicators, strategies, columns, articles and all other features, is entirely at your own risk and it is your sole responsibility to evaluate the accuracy, completeness and usefulness (including suitability) of the information. You should assess the risk of any trade with your financial adviser and make your own independent decision(s) regarding any tradable products which may be the subject matter of the technical analysis or any of the said indicators, strategies, columns, articles and all other features.
Please also be reminded that if despite the above, any of the said technical analysis (or any of the said indicators, strategies, columns, articles and other features accessible on/through this site) is found to be advisory or a recommendation; and not merely informational in nature, the same is in any event provided with the intention of being for general circulation and availability only. As such it is not intended to and does not form part of any offer or recommendation directed at you specifically, or have any regard to the investment objectives, financial situation or needs of yourself or any other specific person. Before committing to a trade or investment therefore, please seek advice from a financial or other professional adviser regarding the suitability of the product for you and (where available) read the relevant product offer/description documents, including the risk disclosures. If you do not wish to seek such financial advice, please still exercise your mind and consider carefully whether the product is suitable for you because you alone remain responsible for your trading – both gains and losses.

NVDA daily.Strong company with financial strength. Not an attractive price for myself, I think people pay currently too much for NVDA.
+ Potentially forming a divergence
+ Still over 200dayMA and 50WeeklyMA
- Downtrend
- Potential ABCDE ?
- Still not over neutral OBV RSI
- Moving averages crossing down
- Below 20ema aka mid kelt

NVIDA: Heading to 200Hello friends, here is a fresh NVDA update. The structure has become quite clear. NVDA should be heading to the 190-210 region. I find it most probable that it will bottom at 200, because that is where the .5 fib retracement lies from this larger degree move. After this, it should move towards 400+ through the rest of the year. Good luck traders :)

NVDA: Back up the truck at 230The structure for NVDA is becoming more clear. It looks like we have one final low to make to about the 230 region to fill the gap. At that juncture, I will "back up the truck". Very bullish setup moving forward.

NVDA Downtrend.Looks like in downtrend.
hoping to hit ~270 range to support the earnings and post which it would come to ~200 range.
May be in FEB last to March timeframe.
Somehow I have feeling during this transient bear market almost all scripts would hit pre-pandemic levels.
Note : Not an investment/trading advise. Please do you own DD.

NVDA: Set your buy orders for 235-240NVDA made a nice 5-wave move off the low, but now it is time to take a rest and digest some of the gains. We may still get one more small push up to the 270 level, but it is not worth chasing right now. The price target for this swing trade is 400+, which would translate to a 60-70% return by the end of the year.

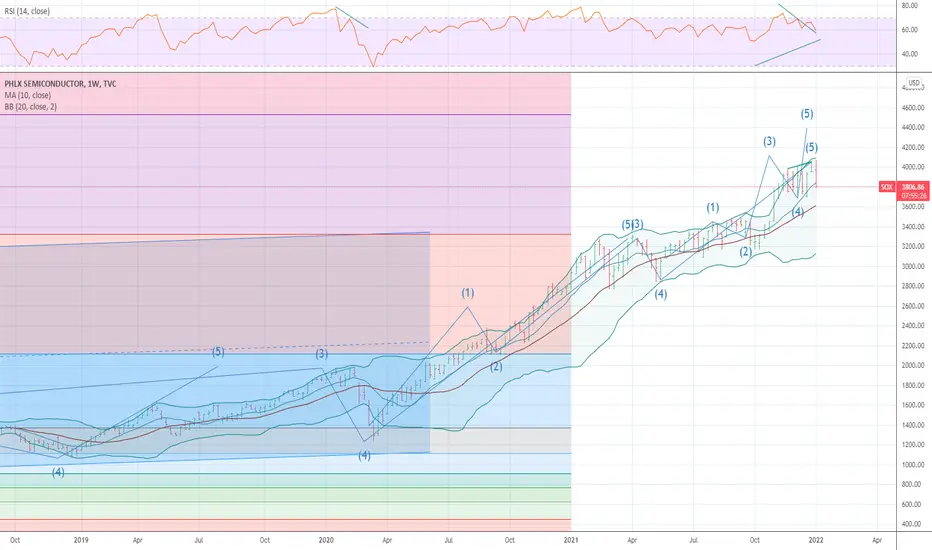
5 WAVES UP ENDED LOOK FOR A CRASH We have ended into a Month in history with the highest level of major market tops outside of late aug 17 to sept 10 thru out the markets history . at THIS POINT and the wave structure as well as fib relationships within the the wave structure . I can now say we are setup for a CRASH cycle I think it has started and will see it over the next few days . the weekly rsi has not confirmed this rally as well as the nysi and nymo models put/call/ are not at any bottom or value nor is the naz dsi or fear greed index . BEST OF TRADES WAVETIMER
NVDA BEARISH WOLFE WAVE DAILYThere is a bearish wolfe wave setup on the daily time frame that triggered last week Dec 3, 2021. The projected target is calculated by extending a linear line between pivot 1 and 4 and projecting the line. This is represented as the red perforated line, as shown in the chart. The projected target is approx 180 which is represents a 5 standard deviation move. We do not believe NVDA will reach this level in the short term; however, it is probable that NVDA can take out some gaps that have been left open post run-up. Closest gap target is 267. If this tgt were to be achieved, I would expect it to sell off to 267 and lower Dec 14.

Bear Bias on NVDANVDA looks like it wants to break below support here.
Key level to watch. Below 218.30.
Target: 5 points to the downside.

NVDA - diamond?Good evening?
According to the classical technical analysis, a diamond gives a minimal correction for the height of the diamond - to $739. The maximum is a full-scale trend reversal.
However, such models are ideally viewed on the daily chart.
not a recommendation, not a tip.

NVDA Trading IdeaGday Guys. Hope everyone generate huge profit...
Let's analyse NVDA Stocks today.
Uptrend Market Structure since Mar 8,2021 created a low price at 463.18. The stock rise break previous low at 615.38(Feb 16, 2021) which creating New High at 648.12 on (April 15, 2021).
Price continue to create a Highlow at 538.72 (May 13,2021) which is unable to reach previous low that created on Mar 8, 2021 (463.18). This happen due to previous Demand Zone hard to break which is make the price move upside breaking previous high at 648.50 and price rally
bullish on the peak of 712.50 New High.
We expecting the price will be creating new HL as some correction need to be done before its continue bullish rally.
As long current price hold and not break 712.50 area, this pair still valid for some correction 625.35 Minor Demand Zone and maximum level of creating new HL at 587.74. If the price break below 587.74, we expecting price trying to reach previous LOW area.
In upside zone. If 712.50 broken, this price will continue to create new high and in return, we expecting a deep correction.
Let's see what happen next.

