NVDA 0DTE TRADE SIGNAL – JULY 25, 2025
⚡ NVDA 0DTE TRADE SIGNAL – JULY 25, 2025 ⚡
🚀 Strong Bullish Momentum – But Friday Expiration = Gamma Trap?
⸻
📊 Market Stats:
• 💰 Call Volume: Strong
• 🔻 Weak Volume Overall
• ⚖️ Call/Put Ratio: Bullish
• 📈 RSI: Overbought but still pushing
• ⏳ Time Decay: Accelerating
• ☠️ Gamma Risk: 🔥 MAX today (0DTE)
⸻
🧠 Model Summary:
• Grok/xAI: 🔒 NO TRADE today – wait for Monday
• Claude: 🛑 Caution – avoid entries today
• DeepSeek: ⏸️ 4/5 Bullish, wait for cleaner setup
• Gemini: 💡 Suggests $180C next week
• Llama: ✅ Bullish bias, but gamma risk = no go for Friday
⸻
📌 TRADE IDEA: Wait for Monday
📍 Strike: $175 Call
📆 Expiry: Today (0DTE)
💵 Entry Price: $0.56
🎯 Target: $0.95
🛑 Stop: $0.30
📈 Confidence: 65%
🕒 Entry Timing: Monday open IF support holds
⸻
⚠️ Key Warning:
Don’t get trapped by 0DTE gamma swings. Momentum says yes, time decay says no…
✅ Best move? Watch NVDA closely, then strike on Monday if volume confirms.
⸻
👍 Like & save if you’re tracking NVDA.
🔁 Repost if you’re waiting for the perfect Monday setup!
#NVDA #OptionsTrading #0DTE #GammaRisk #BullishSetup #TradingView #TechStocks #WeeklyOptions
Nvdastock

$NVDA WEEKLY TRADE IDEA – JULY 21, 2025
💥 NASDAQ:NVDA WEEKLY TRADE IDEA – JULY 21, 2025 💥
🔥 Bullish Options Flow + Weekly RSI Strength = Controlled Momentum Play
⸻
📊 Trade Details
🔹 Type: Long Call
🎯 Strike: $180.00
📆 Expiry: July 25, 2025 (4DTE)
💰 Entry: $0.51
🎯 Target: $1.02 (💯% Gain)
🛑 Stop: $0.20 (~40% Risk)
📈 Confidence: 65%
🕰️ Timing: Monday Open
📦 Size: 1 Contract (Adjust based on risk tolerance)
⸻
📈 Why This Trade?
✅ Call/Put Ratio = 1.48 → Bullish bias confirmed
📈 Weekly RSI = 77.0 → Strong momentum
🔻 Daily RSI = 80.8 (falling) → Short-term pullback risk
📉 Volume = flat (1.0x) → Weak confirmation = tighter risk mgmt
🧠 Strike Clustering: $177.50 & $180 = strong OI zones
🌬️ VIX = 16.7 → Favorable for long premium plays
⸻
⚠️ Risks & Strategy Notes
❗ Daily RSI = caution: short-term exhaustion possible
📉 Weak volume = lack of institutional chase
⏳ Exit before Friday – avoid IV crush and gamma slam
🔐 Set alerts at $178.75 and $179.80 – pre-breakout signals
⸻
🎯 Plan:
• Enter Monday open
• Scale partials if price hits +30–50%
• Full exit by Thursday unless price is breaking through $180 early with strong volume
⸻
🏁 Quick Verdict:
This is a momentum continuation setup, not a fresh breakout.
Play the trend, respect RSI signals, and cut fast if flow dries up.
NASDAQ:NVDA 180C — Risk $0.20 to Target $1.02
Let the call ride… just don’t overstay.
⸻
#NVDA #OptionsTrading #CallOption #WeeklyPlay #MomentumTrade #FlowBasedSetup #TradingViewIdeas #GammaPlay #BullishBias #NVIDIA

NVIDIA Robbery Plan: Bullish Swing Trade to Millions!🔥 NVIDIA (NVDA) Stock Heist Blueprint: Unlock Bullish Profits with Thief Trading Style! 🚀💰
🌟 Greetings, Wealth Warriors! 🌟
Hello, Ciao, Salaam, Bonjour, Hola, and Hallo to all you savvy traders and market masterminds! 🤑💸 Get ready to execute a high-octane trading plan with our Thief Trading Style—a bold fusion of technical precision and fundamental insights designed to crack the NVIDIA (NVDA) stock market vault! 💥📈
📝 The NVIDIA Heist Plan: Swing & Day Trading Mastery 🏆
Based on our proprietary Thief Trading Style, this plan targets NVIDIA (NVDA), currently riding a bullish wave fueled by strong fundamentals and technical setups. Follow the strategy outlined below to navigate the high-risk Red Zone—where overbought conditions, consolidation, and potential trend reversals create opportunities for sharp traders. 💪 Stay alert, as bearish players may set traps at key levels! 🕵️♂️
Entry Strategy: Crack the 🙂Vault! 🏦
Go long with confidence! The market is primed for a bullish breakout. Enter at current prices or set buy limit orders near recent swing lows/highs on the 15-minute or 30-minute timeframe. 📅
Pro Tip: Set price alerts on your chart to catch the optimal entry. Timing is everything in this heist! ⏰
Swing Traders: Look for pullbacks to key support levels for safer entries.
Scalpers: Focus on quick long-side trades with tight stops to maximize gains. 💨
Stop Loss: Protect Your Loot! 🔒
Place your stop loss (SL) below the recent swing low on the 30-minute timeframe (e.g., $162.00 for swing trades).
Adjust your SL based on your risk tolerance, position size, and number of orders. For larger accounts, consider tighter stops to lock in gains early. 🛡️
Scalpers: Use a trailing stop to secure profits while riding short-term momentum.
Take Profit Target: Cash Out Big! 💰
Aim for $191.00 as the primary target, or exit early if momentum slows.
Swing Traders: Hold for the full target if the trend remains strong.
Scalpers: Grab quick profits on smaller price spikes and re-enter on dips.
Pro Move: Use a trailing stop to let profits run while safeguarding gains. 🚀
📌Key Levels & Risk Management
Entry Zone: Market price or swing low – ideal for long positions. 📈
Stop Loss: $162.00 – based on 30m timeframe swing low. 🛑
Take Profit Target: $191.00 – primary target for swing/day trades. 🎯
Risky Red Zone: Overbought levels – watch for consolidation or reversal traps. ⚠️
💡 Why NVIDIA? The Bullish Case 📡
NVIDIA (NVDA) is powering through a bullish phase, driven by:
Fundamentals: Strong demand for AI, gaming, and data center chips. 📊
Macro Factors: Positive market sentiment and tech sector momentum. 🌍
COT Data (Latest Friday Update, UTC+1): Large speculators are increasing bullish positions, signaling confidence in NVDA’s upside (data sourced from reliable platforms). 📅
Geopolitical & News: Monitor upcoming earnings and industry developments for catalysts. 📰
Intermarket Analysis: Tech-heavy indices like the NASDAQ are trending higher, supporting NVDA’s rally. 📈
For a deeper dive, check fundamental reports, COT data, and sentiment analysis to align your trades with the bigger picture. 🔍
⚠️ Trading Alert: Navigate News & Volatility 🗞️
News releases can spark sharp price swings. To protect your capital:
Avoid new trades during major news events (e.g., earnings or Fed announcements). 🚫
Use trailing stops to lock in profits and limit downside risk. 🔐
Stay updated with real-time market developments to adjust your strategy dynamically. 📡
🚀 Boost the Heist! Support the Thief Trading Community 🤝
Love this plan? Hit the Boost Button to amplify our Thief Trading Style and empower our community to conquer the markets! 💥 Every like and share fuels our mission to make money with precision and style. 💪 Join us daily to unlock more high-profit heist plans! 🏴☠️
📌 Important Disclaimer
This analysis is for educational purposes only and not personalized investment advice. Always conduct your own research, assess your risk tolerance, and verify market conditions before trading. Markets move fast—stay sharp and adapt! ⚡
🌟 Stay tuned for the next heist plan, traders! Let’s keep stealing profits together! 🤑🐱👤🎉

$NVDA - $270 PT in BULL ChannelThe stock is currently bouncing off of the lower channel line of the rising Bull Channel. Price action has created a Cup and Handle. The projected Price Objective sits at around $270. Remember, the height of the cup is the project target which from current stock price extends to around $270.

Nvidia Market Capitalisation Reaches $4 TrillionNvidia Market Capitalisation Reaches $4 Trillion
Yesterday, Nvidia’s (NVDA) share price surpassed $162 for the first time in history. As a result, the company’s market capitalisation briefly exceeded $4 trillion during intraday trading (according to CNBC), making Nvidia the first publicly listed company to reach this milestone.
The rise in NVDA’s share price is being driven by both bullish sentiment across the broader equity market—which appears optimistic ahead of the upcoming Q2 earnings season—and evidence of sustained demand for Nvidia’s products, as artificial intelligence technologies continue to gain widespread adoption.
Noteworthy developments include:
→ Nvidia may begin producing a specialised AI chip for the Chinese market this autumn, potentially circumventing current export restrictions;
→ Perplexity, a company backed by Nvidia, is launching an AI-powered browser aimed at competing with Google Chrome.
Technical Analysis of NVDA Chart
In our previous analysis of NVDA’s price action, we:
→ Drew an ascending channel;
→ Highlighted bullish conviction in overcoming the $145–150 resistance zone.
The channel remains valid, with the current price trading near its upper boundary. However, the RSI indicator is showing signs of bearish divergence, suggesting that the stock may be vulnerable to a near-term correction—potentially towards the median line of the existing upward channel.
At the same time, a major shift in the prevailing bullish trend appears unlikely. The $145–150 range may serve as a key support zone for NVDA in the foreseeable future.
This article represents the opinion of the Companies operating under the FXOpen brand only. It is not to be construed as an offer, solicitation, or recommendation with respect to products and services provided by the Companies operating under the FXOpen brand, nor is it to be considered financial advice.

Nvidia (NVDA) Share Price Soars to Record HighNvidia (NVDA) Share Price Soars to Record High
Yesterday, Nvidia’s (NVDA) share price surged by over 4%, with the following key developments:
→ It broke through the psychological $150 per share level;
→ It reached a new all-time high;
→ It also contributed to the Nasdaq 100 index hitting a record peak, as we reported earlier this morning.
As a result, Nvidia has reclaimed its status as the world’s most valuable company. Demand for its shares is being fuelled by the CEO’s optimism.
“We have many growth opportunities across our company, with AI and robotics the two largest, representing a multitrillion-dollar growth opportunity,” said Jensen Huang at Nvidia’s annual investor conference.
Technical Analysis of the NVDA Chart
The last three candlesticks reflect strong demand, as:
→ There are bullish gaps between the candles;
→ Lower wicks are either absent or minimal;
→ Candles are closing near their highs with progressively widening spreads.
This suggests strong momentum as the price confidently breaks through the key $150 resistance level. It is reasonable to assume that the current imbalance in favour of buyers around the $146–150 area (highlighted in purple) may form a support zone in the event of a pullback — for instance, within the existing upward channel (shown in blue).
This article represents the opinion of the Companies operating under the FXOpen brand only. It is not to be construed as an offer, solicitation, or recommendation with respect to products and services provided by the Companies operating under the FXOpen brand, nor is it to be considered financial advice.

Fundamental and technical analysis on NVDA (Chicken Nugget) soonFundamental Analysis
NVIDIA Corporation (NVDA) remains a key player in the tech sector, benefiting from the rise of artificial intelligence, data centers, and gaming. With sustained growth, constant innovation, and strong demand for its graphics chips, the company continues to deliver solid financial results.
Recent reports indicate revenue growth and expansion in key markets. Product diversification, particularly in supercomputers and embedded systems, strengthens NVDA’s position against competitors. Investor interest in the semiconductor industry helps maintain the stock’s positive momentum.
Technical Analysis
The chart analysis highlights key technical levels for investors:
- Key Resistance: $150 USD – This level must be broken to confirm a strong bullish trend. A breakout with volume could signal a gradual rise toward higher targets.
- Support Level: $131.50 USD – Strong demand and low supply are identified at this level, making it an excellent entry point for investors looking for buying opportunities before a potential rebound.
Targets & Strategy
- Short-term target (late June/early July): The target range of $170-$175 USD is possible if the bullish trend is confirmed. This level aligns with technical extensions and favorable market dynamics.
- July buyback (-5% to -10%): A moderate correction could occur, offering another buying opportunity before an upward recovery.
- Selling target (September to November): The next selling target is between $200-$240 USD, depending on market developments and investor sentiment.
Conclusion
NVDA stock presents interesting prospects, with well-defined technical levels and a strong fundamental outlook. Investors should monitor these thresholds to adjust their strategy based on market fluctuations.
If you want to refine this analysis or explore other scenarios, I'm here to dive deeper into key points! 🚀 Subscribe! TSXGanG
I hold a CCVM and MNC (Certificate of Competence to become a securities broker anywhere in Canada) and have been working as a trader for five years.
It’s a pleasure for me to help people optimize their trading strategies and make informed financial market decisions.

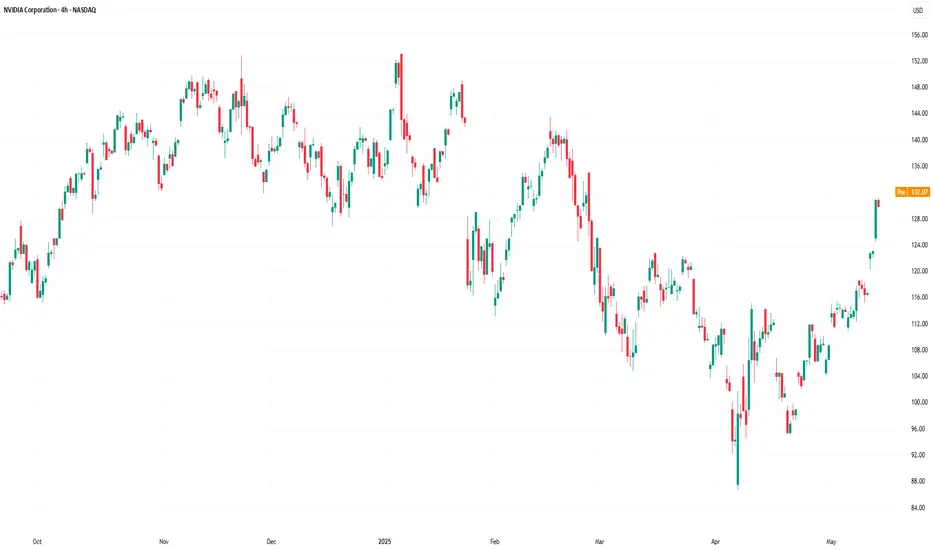
Potential Reversal Zone for NVDAThis chart of NVIDIA Corporation (NVDA) as of June 3, 2025, shows a technical analysis scenario forecasting a possible bearish reversal. The price action, zones, and arrows suggest a setup based on supply and demand zones.
Key Elements in the Chart:
🔴 Supply Zone (Resistance Area)
Location: Around $141.73 to ~$144
Observation: The price recently entered this red-shaded area, indicating strong historical resistance.
Implication: The area is expected to act as a ceiling, where sellers may overwhelm buyers, causing a reversal.
⚫ Price Reaction:
The chart shows price approaching and briefly piercing the supply zone, followed by a bearish candle or rejection (as indicated by the top arrow).
Arrows project a downward movement, suggesting bearish sentiment.
🟢 Demand Zone (Support Area)
Location: Approximately $114–$121
Observation: This green-shaded area acted as a base for a previous upward move.
Implication: It is likely to act as a strong support if the price drops significantly.
Projected Price Path:
Short-term reversal from the resistance zone (~$144).
Initial drop to mid $130s (likely a lower high or minor support).
Continuation to demand zone around $116, completing the projected bearish move.
Technical Interpretation:
This setup is a classic supply and demand reversal strategy.
Confirmation of the short setup may require:
A clear rejection candle at resistance.
Break of minor support levels on the way down.
Risk for bulls is high near resistance; short sellers may find opportunities targeting the demand zone.

Nvidia Posts Another Blowout Quarter. What Can Slow It Down?Hint: Not much.
🚀 Earnings So Good You Can’t Ignore ‘Em
Another quarter, another jaw-dropper from Nvidia NVDA . In what has basically become a quarterly ritual at this point (congrats to all who celebrate!), Jensen Huang’s silicon empire posted revenue of $44.1 billion , soaring past the $43.3 billion consensus.
That’s a 69% year-over-year gain, in case anyone’s still doing the math. Adjusted earnings of 81 cents per share also easily crushed expectations.
Shares popped 5% in after-hours trading Wednesday and then pulled back a little bit during the cash session on Thursday — not quite a moonshot, but a confirmation that even if Nvidia’s guidance was meh, this earnings report was meh’gnificent.
So what exactly is fueling this unstoppable juggernaut? And is there anything that could actually throw a wrench in the gears? Grab your chips (there’s your pun), let’s break it down.
💾 Data Centers: The Company’s Cash Cow
If Nvidia is famous for anything, it’s that it’s really able to see the trend before the crowds pick it up. From gaming, to crypto… and now? The star of the show now is data centers. But there's not just any growth. We’re talking $39.1 billion in data center revenue, up 73% from last year. That’s nearly 90% of Nvidia’s entire business. Not exactly fans of revenue diversification, are we?
Big Tech is gorging on Nvidia’s AI chips like it’s an all-you-can-eat GPU buffet. Amazon NASDAQ:AMZN , Google NASDAQ:GOOGL , and Microsoft NASDAQ:MSFT alone account for nearly half of that segment.
Basically, if you’re building anything with the words “large language model,” “AI agent,” or “sovereign compute,” you’re probably writing big checks to Nvidia.
🇨🇳 About That $10.5 Billion Problem
Thanks to Trump’s H20 export ban, Nvidia’s revenue from China is expected to take a $10.5 billion hit over two quarters. That’s an $8 billion crater forecasted for the current quarter, on top of a $2.5 billion gap in the previous one.
Is that bad? Maybe. Does anyone care right now? Not really.
Because here’s the kicker: demand outside China is so nuclear that even subtracting ten billion bucks over six months doesn’t materially derail the bullish narrative. Nvidia’s still forecasting $45 billion in revenue this quarter, which is basically flat — but considering what’s missing, that’s a win in disguise.
📦 Blackwell to the Rescue
The forward guidance may have missed the Street’s expectations — Nvidia projected Q2 revenue of $44–$46 billion, versus the $45.9 billion consensus — but CEO Jensen Huang already served the antidote: Blackwell Ultra.
These next-gen chips are already shipping to early customers. They promise to be leaner, meaner, and more power-efficient — basically, think McLaren but for AI accelerators. And they’re expected to ramp up aggressively in the back half of the year.
That means Nvidia has a new growth lever just waiting to be pulled. Some overly bullish analysts say it could eclipse the H100’s success.
💡 The Real Moat? It’s Not Just the Chips
What makes Nvidia such a rare beast isn’t just its hardware. It’s the ecosystem — CUDA, software stacks, developer tools, APIs, vertical integrations. It’s like Apple, but for the AI industrial complex.
Everyone wants to build an AI empire, but good luck doing it without Nvidia’s infrastructure. It’s not just expensive — it’s essential.
In the meantime, AMD NASDAQ:AMD and Intel NASDAQ:INTC are trying. There’s chatter about custom silicon from OpenAI (still a private company) and Meta $META. But for now, the moat around Nvidia looks more like a canyon.
🧨 So What Could Slow It Down?
But let’s not get carried away — there are still some real risks on the radar. Here’s what might actually trip up the AI king:
Geopolitical shocks: More export bans? Chinese retaliation? Taiwan tension? Any of these could make markets twitchy.
Supply chain constraints: As demand grows, so does pressure on foundries like TSMC 2330 . Any hiccups in advanced packaging or wafer starts could pinch margins.
Rising competition: AMD’s MI300 is no slouch. And Big Tech is building in-house chips to lessen reliance on Nvidia.
AI fatigue: If the AI hype cycle fizzles out or hits a plateau (remember the metaverse?), that could cool capital spending. It only takes 3-4 tech titans to pull their capex and Nvidia’s reign is over.
But until any of that materializes, the narrative for many is "Buy the dip — Jensen’s grip won’t slip."
💫 What’s Priced In?
The stock’s P/E is still sky-high, and the multiple implies several more years of 50–60% annual revenue growth. That’s hard to sustain indefinitely. But then again, so was becoming the second-largest company in the world… (and the biggest one, if only for a while ) and here we are.
Nvidia’s valuation is steep, but not unjustified — as long as it keeps executing. And judging by any of the previous quarters going back to 2023, execution isn’t a problem.
👩🏻🚀 More Than a Stock — Macro Theme
At this point, Nvidia has transcended chipmaker status. It’s now a macro story. Betting on Nvidia is betting on AI. It’s betting on infrastructure. It’s betting on the next industrial revolution in software, automation, and language models.
So… what can stop it? Share your thoughts in the comment section!

What’s Happening with Nvidia (NVDA) Ahead of Earnings?What’s Happening with Nvidia (NVDA) Ahead of Earnings?
After an extended weekend due to Veterans Day in the US (observed on Monday), financial markets are returning to active trading. The highlight of the week will be Nvidia’s (NVDA) earnings report, scheduled for Wednesday after the close of the main trading session.
What You Need to Know Ahead of Nvidia’s Earnings
According to media reports, market participants are concerned about:
→ escalating trade tensions between the US and China;
→ increasing competition;
→ Nvidia’s premium pricing at a time when the GPU market is shifting towards more affordable alternatives;
→ downward revisions to earnings per share, which some interpret as a sign that Nvidia’s report may fall short of expectations.
On the other hand, Reuters reports that Nvidia is set to unveil a new processor that:
→ is designed specifically for AI applications;
→ is based on the Blackwell architecture;
→ will not be subject to US export restrictions on chips sent to China;
→ is expected to be cost-effective.
Technical Analysis of Nvidia (NVDA) Stock
Today’s NVDA price chart suggests that the descending channel (marked in red) may be forming a large bullish flag — a continuation pattern that typically indicates a potential resumption of the uptrend after a corrective phase.
Price action in Nvidia stock has slowed near the upper boundary of the channel — a sign of temporary equilibrium between supply and demand (this could also be interpreted as traders adopting a wait-and-see stance ahead of the earnings release).
Given that the earnings report is a potentially strong price catalyst, a breakout from the bullish flag cannot be ruled out. Such a move could signal the start of a new phase in NVDA’s long-term upward trend (as indicated by the arrow on the chart).
This article represents the opinion of the Companies operating under the FXOpen brand only. It is not to be construed as an offer, solicitation, or recommendation with respect to products and services provided by the Companies operating under the FXOpen brand, nor is it to be considered financial advice.

$NVDA bull flag potentialNASDAQ:NVDA setting up with a bull flag formation on the daily. A strong ER with good guidance can get us to 140-145. A less than stellar guidance can break the bull flag thesis and send it back to the 120-125 range, with some gaps below.

Nvidia (NVDA) Share Price Jumps Over 5%Nvidia (NVDA) Share Price Jumps Over 5%
Nvidia (NVDA) shares surged to the $130 mark yesterday – a level not seen since late February 2025. This strong rise, marked by a wide bullish candlestick, helped Nvidia reclaim its status as a company valued at over $3 trillion.
Why Nvidia (NVDA) Shares Are Rising
The bullish sentiment has been driven by several factors, including:
→ Price increases on products: Nvidia has raised prices on its graphics cards and data centre chips. The GeForce RTX 5090 has risen by more than 10%, while the RTX 50 series is up by 5–10%.
→ News of a major contract: The company will supply chips to an AI start-up backed by Saudi Arabia. In addition, media reports suggest that the US government is considering a deal allowing the UAE to purchase up to 500,000 Nvidia chips annually until 2027.
All of this could positively impact Nvidia’s revenue, encouraging investors to buy NVDA shares.
Technical Analysis of Nvidia (NVDA) Stock Chart
Yesterday’s sharp rally suggests a breakout from the descending channel (marked in red), which had remained in place since late last year.
The breakout occurred near the $123 level, which had previously acted as resistance. It is therefore possible that if there is a pullback in the NVDA stock price, this level could act as support (“breakout retest” pattern), confirming the breakdown of the descending channel and strengthening the outlook for further growth.
This article represents the opinion of the Companies operating under the FXOpen brand only. It is not to be construed as an offer, solicitation, or recommendation with respect to products and services provided by the Companies operating under the FXOpen brand, nor is it to be considered financial advice.
NVDA’s Wild Crash Alert: I’m Braced for a Heart-Stopping Drop!NVDA’s like a rocket losing altitude, and I’m on edge! It’s at $95.99, but I’m seeing it tumble to $90, maybe $88.95, then $83.59 if the bears go wild. If that breaks, whoa—$77.48 could hit hard! I’m glued to $90 for the first clue—big selling there, and it’s game on for a slide.
Kris/Mindbloome Exchange
Trade Smarter Live Better

NVDA TO $176 BY JUNE THEN $1000 END OF YEARNVDA to $176 by June Then $1000 End of Year: A Bold Thesis
Key Points
It seems likely that NVDA could reach $176 by June 2025, supported by strong AI market trends and upcoming earnings, but reaching $1000 by year-end is highly speculative and controversial.
Research suggests Elliott Wave analysis shows a potential bullish trend, but specific price targets like $1000 lack broad analyst support.
The evidence leans toward significant growth potential due to NVDA's leadership in AI and new product launches, yet such aggressive targets involve high uncertainty.
Current Price and Market Context
As of April 9, 2025, NVDA's closing price on April 8 was $96.30, with pre-market trading at $98.22. This reflects recent volatility, with a 52-week range from $75.61 to $153.13. The stock's performance is tied to its dominance in AI and GPU markets, which are experiencing robust growth.
Analysis for $176 by June
Reaching $176 by June 2025, an 83% increase from $96.30, is ambitious but plausible. Upcoming earnings on May 28, 2025, estimate an EPS of $0.93 and revenue of $43.34 billion, with potential beats driving price surges. Elliott Wave analysis suggests NVDA may be completing a corrective phase, with a falling wedge pattern indicating a possible upward breakout, supporting short-term targets around $176.
Analysis for $1000 by Year-End
The prediction of $1000 by December 2025, a 940% increase, is highly speculative. While some analyses, like a Forbes article, suggest NVDA could see a tenfold rise by 2026 due to the Blackwell architecture, most analyst targets range from $170 to $235. This target lacks broad support and involves significant market and fundamental risks.
Unexpected Detail: Stock Split Impact
An unexpected factor is NVDA's 10-for-1 stock split in June 2024, adjusting prices from over $1,000 to current levels, making historical comparisons complex. This split aligns the $1000 target with post-split valuations, but achieving it requires unprecedented growth.
Survey Note: Detailed Analysis of NVDA's Potential Price Surge to $176 by June and $1000 by Year-End
Introduction
NVIDIA Corporation (NVDA), a leader in graphics processing units (GPUs) and artificial intelligence (AI), is currently trading at approximately $96.30 as of April 9, 2025, based on the closing price from April 8, with pre-market activity showing a slight uptick to $98.22. This analysis explores the feasibility of NVDA reaching $176 by June 2025 and an ambitious $1000 by the end of the year, leveraging Elliott Wave theory and other validated analytical methods. Given the stock's recent performance and market context, we examine technical patterns, fundamental catalysts, and long-term growth potential.
Current Market Position and Historical Context
NVDA's stock has shown volatility, with a 52-week range from $75.61 to $153.13, and a year-to-date change of -11.36% over the past week and -12.23% over the past month, per recent data. The all-time high was $153.13 on January 6, 2025, indicating significant upside potential from current levels. The market capitalization stands at $2.35 trillion, with a beta of 2.40, reflecting high volatility. Key financial metrics include an EBITDA of $83.32 billion and an EBITDA margin of 63.85%, underscoring strong profitability.
A critical context is the 10-for-1 stock split in June 2024, which adjusted share prices from over $1,000 to current levels, making historical comparisons complex. This split, detailed in a CNBC article (Nvidia announces 10-for-1 stock split), was aimed at making ownership more accessible, aligning with the user's post-split price targets of $176 and $1000.
Metric Value
Closing Price (Apr 8) $96.30 USD
Pre-Market Price (Apr 9) $98.22 USD
52-Week Range $75.61 - $153.13 USD
Market Cap $2.35T USD
Beta (1Y) 2.40
Earnings Next Report May 28, 2025, EPS Estimate $0.93, Revenue Estimate $43.34B USD
Last Quarter EPS $0.89 (estimated $0.85, +4.96% surprise)
Dividend Yield (TTM) 0.04%
Elliott Wave Analysis: Technical Insights
Elliott Wave theory, a method identifying market psychology through wave patterns, suggests NVDA may be in a corrective phase, potentially completing wave (4) of a larger five-wave structure. Recent analyses, such as those on TradingView (NVIDIA Stock Chart), indicate a falling wedge or ending diagonal formation, often signaling a reversal and start of an upward trend. This could support a move to $176 by June, as wave (5) projections often extend to 1.618 times wave (1), potentially aligning with such targets.
Specific Elliott Wave analyses, like those from ElliottWave-Forecast (Elliott Wave Expects New All Time High), suggest NVDA has completed corrections and is resuming higher, with wave counts indicating impulsive rallies. However, these analyses lack explicit price targets reaching $1000, focusing more on trend continuations.
Short-Term Target: $176 by June 2025
Reaching $176 by June 2025, an 83% increase from $96.30, is ambitious but supported by several factors. The earnings report on May 28, 2025, is a critical catalyst, with estimates for EPS at $0.93 and revenue at $43.34 billion. Given NVDA's history of beating estimates, as seen in the last quarter with EPS of $0.89 against an estimate of $0.85, a strong report could drive significant price appreciation.
Technical indicators, such as a breakout from the falling wedge, align with this target. Analyst price targets, ranging from $125 to $220 with an average of $177.19 per Zacks (NVIDIA Price Target), also support the possibility, with some forecasts reaching $235.92 (NVDA Forecast). However, achieving this in two months requires sustained bullish momentum and favorable market conditions.
Long-Term Target: $1000 by Year-End 2025
The prediction of $1000 by December 2025, a 940% increase from current levels, is highly speculative. Most analyst forecasts, such as those from MarketBeat (NVIDIA Stock Forecast) and TipRanks (Nvidia Stock Forecast), range from $170 to $235, far below $1000. However, a Forbes article from May 25, 2024 (Nvidia Stock Tops $1,000), suggests NVDA could see a tenfold rise by 2026 due to the Blackwell architecture, potentially supporting a $1000 target by late 2025 if growth accelerates.
Blackwell, a new GPU architecture, is expected to enhance NVDA's AI and data center offerings, potentially driving revenue growth. CoinCodex forecasts a high of $260.32 by December 2025 (NVIDIA Stock Forecast), still below $1000, indicating the target is outlier and involves significant risk. Market volatility, competition, and macroeconomic factors, such as tariff impacts noted in CNN reports (NVDA Stock Quote), add uncertainty.
Fundamental Catalysts and Risks
NVDA's fundamentals are strong, with consistent revenue growth and high EBITDA margins. The company's expansion into AI, autonomous systems, and supercomputers, as noted in LiteFinance (Nvidia Stock Price Prediction), supports long-term growth. However, short-term corrections due to overvaluation or market sentiment, especially around tariff concerns, pose risks.
X posts, such as one from @1000xStocks (X post), highlight NVDA's EPS growth reflecting AI monetization, suggesting bullish sentiment, but lack specific $1000 targets. Another from @ravisRealm (X post) notes adding positions at lower prices, indicating confidence but not supporting the $1000 target.
Conclusion
While reaching $176 by June 2025 is plausible with strong earnings and technical breakouts, the $1000 target by year-end is highly speculative, lacking broad analyst support and requiring unprecedented growth. Investors should monitor earnings reports, product launches like Blackwell, and market trends, while employing risk management strategies given the high uncertainty.

NVDA Stock: Under $120 pressured? $111 Break Signals $100 RiskIs NVIDIA (NVDA) stock in trouble? As long as NVDA stays under the 120 area, it’s under serious pressure, and the red flag is a drop below 111, opening the door to a fall to the 100 area. In this video, we dive into the latest NVDA stock analysis, breaking down how U.S. export controls have slashed sales to China—now just 15% of total revenue—spooking investors. Could this be the catalyst for a bigger crash? We explore technical levels (120, 111, 100), the impact of CEO Jensen Huang’s sales warning, and what it means for NVDA stock price in near term. Don’t miss this critical update— Drop your thoughts in the comments: Is NVDA a buy or a sell at these levels?

NVDA : Good shopping pointshello friends
We have analyzed these stocks for you in a very simple way. In the long term...
We have identified good shopping points where you can shop.
Note that the price is at the ceiling of the channel and it is not logical to buy at the ceiling of the channel, so either we buy in case of correction or if the channel is broken and its failure is valid, we can buy.
*Trade safely with us*

NVDA - 25% correction ahead!NVDA looks bearish in 3d chart as it shows a breakdown of the rising wedge pattern.
continuation of decline is expected!
The price is expected to target the 0.618 Fibonacci level, which implies a 25% decline
Best regards Ceciliones🎯

$NVDA Dominance in NASDAQ: $NVDA vs NASAD IndexAll of us in crypto are used to looking at the BTC.D Chart (Bitcoin Dominance). With BTC.D stuck in a range between 57% and 60% we try to look at a new dominance chart which no one is talking about. Same as DeFI in TradFI we can look at one of the most famous Asset which is NASDAQ:NVDA vs its dominance in tech heavy NASDAQ index. Let’s call it ‘ NASDAQ:NVDA Dominance’ (NVDA.D) © 😉. Further usage of the ticker should be copyrighted to me. 😊
$NVDA.D is now below its 200 Day SMA. If we plot NASDAQ:NVDA vs NASDAQQ Index, we get $NVDA.D and there we see that NVDA.D is making multi months lows and below 200 Day SMA. We have not seen this kind of weakness in $NVDA.D since CHAT GPT was launched in Nov 2022. The last time $NVDA.D was below the 200 Day SMA it spent almost 6 months consolidating during the 2022 Tech bear market before AI sparked the new bull market.

NVDA LONG SET UPEntry 1 $118.00
Entry 2 $108.00
Stop loss $93.00
Take profit 1- $128.00
(Close 33%)
Take profit 2- $138.00
(Close 66%)
Take profit 3-$148.00
(Close 100%)

Nvidia: FluctuationOver the past two weeks, NVDA has exhibited increased fluctuation within the boundaries of the current key levels: the resistance at $152.89 and the support at $126.34. Initially, the price seemed to favor our alternative scenario, but it managed to reverse just in time. Following a dip to $129, the stock rebounded swiftly. Our primary assumption remains that the beige wave III should eventually break above the $152.89 resistance. However, there is still a 33% chance that the expected rises will be delayed by a new low of the blue wave alt.(IV). This alternative scenario will prevail if the stock falls below the $126.34 support level.

NVDA - Up trend ?NVDA - Up trend in a rising channel + Above the average line 150. Only an idea and not a recommendation for trading

What’s Next for NVDA: $142 or $123?Good morning Trading Family
Here’s the game plan: if NVDA moves above $133.50, we could see it climb to $134.50, then correct back down to $123. If it breaks $129.33, it might drop to the $123 range. But if it pushes past $137, we could see it head toward $142.
This Sunday, I’m hosting a webinar on how emotions can hurt your trading and how to take control of your mindset for better results.
Send me a message or check out my profile for details. If this added value to your trading, like, comment, and share it with someone who needs it.
Kris/Mindbloome Exchange
Trade What You See

Daily Halftime Report: NVDA Continuation Buy-InDaily Halftime Update: NVDA gapped up on this morning's session to retest it's ATHs at $152.89 which was tested back in Nov 21, 2024. Looking for a entry between $149.5-$149.95 (Target: $149.73) and a close above $148.98 for confirmation of Continuation to retest those ATHs in the weeks to come. Looking for a $160 Price Target on the Long Trade here.
