NVDA Set to Make Waves: Big Levels Ahead!Update:
Good morning, trading family. Here to break this down nice and easy for you. Let’s ride the NVDA waves together:
1️⃣ First scenario: NVDA climbs to $154–$156. From there, it could either break higher or pull back to $150, maybe lower. Watch for a bounce if it dips.
2️⃣ Second scenario: A move to $168 is on the table, but expect a pullback to $164 before the next push higher. If the pullback goes deeper, it’s just a chance to reset.
3️⃣ Third scenario: If NVDA powers through all those levels, $179 is next, with a potential correction back to $168 along the way.
Mindbloome Trading/ Kris
Trade What You See
Nvidia

Navigating the Surge: Entry Now or Await a Pullback ?Overview: NVIDIA Corporation (NASDAQ: NVDA)
Current Price: $146.43 (as of November 7, 2024)
Sector/Industry: Technology / Semiconductors
NVIDIA has experienced a significant surge, reaching new highs. Investors are now contemplating: Is it prudent to enter at current levels, or should one wait for a potential pullback to optimize the risk/reward profile?
Key Levels and Price History
52-Week Range: $108.13 - $146.43
One-Month Range: $130.25 - $146.43
Support Level: $135.00
Resistance Level: $150.00
Upcoming Dates to Watch
Next Earnings Date: December 15, 2024
Dividend Payment Date: December 20, 2024
Ex-Dividend Date: December 5, 2024
Valuation and Metrics
P/E Ratio: 65.55 (above industry average)
Free Cash Flow:
Recent Quarter: $1.5 billion
TTM: $6 billion
Dividend Yield: 0.02%
Institutional Holdings: 70%
Short Interest: 3% of float
Recent Price Action & Technical Indicators
Weekly Trend: +5%
Monthly Trend: +10%
RSI: 68 (approaching overbought territory)
Moving Averages:
50-Day: $140.00
200-Day: $125.00
MACD: Positive divergence, indicating upward momentum
The RSI nearing overbought levels suggests caution, as a pullback may be imminent.
Comparative Valuation
P/E Ratio (NVDA): 65.55 vs. Industry Average: 30.00
P/B Ratio (NVDA): 20.00 vs. Industry Average: 8.00
EV/EBITDA (NVDA): 40.00 vs. Industry Average: 15.00
NVIDIA's premium valuation underscores its growth potential but also indicates higher risk if market sentiment shifts.
Growth & Financial Health
Revenue Growth (3-Year CAGR): 25%
Projected Revenue Growth (Next 2 Years): 20% annually
Debt-to-Equity Ratio: 0.3 (moderate leverage)
Cash Reserves: $10 billion
Current Ratio: 2.5
Notable News & Social Sentiment
News Highlight: November 6, 2024 – NVIDIA announced a strategic partnership with a leading cloud provider, boosting investor confidence.
Social Buzz: Positive discussions on platforms like Twitter and Reddit, with investors optimistic about NVIDIA's future prospects.
Competitive Comparison
Advanced Micro Devices, Inc. (AMD): $145.07, P/E 40.00, Revenue Growth 30%
Intel Corporation (INTC): $24.95, P/E 15.00, Revenue Growth 5%
Investment Analysis: Entry Now or Wait for a Pullback?
1. Entry at $146.43 (Current Price)
Target Price (TP): $160.00
Potential Upside: $160.00 - $146.43 = $13.57
Percentage Gain: ~9.27%
Stop Loss (SL): $135.00
Potential Downside: $146.43 - $135.00 = $11.43
Percentage Loss: ~7.80%
Risk/Reward Ratio: 9.27% (reward) / 7.80% (risk) ≈ 1.19
Entering at $146.43 offers a moderate risk/reward ratio, with potential gains slightly outweighing potential losses. However, the proximity to overbought RSI levels suggests a cautious approach.
2. Entry at $135.00 (Wait for Pullback)
Target Price (TP): $160.00
Potential Upside: $160.00 - $135.00 = $25.00
Percentage Gain: ~18.52%
Stop Loss (SL): $125.00
Potential Downside: $135.00 - $125.00 = $10.00
Percentage Loss: ~7.41%
Risk/Reward Ratio: 18.52% (reward) / 7.41% (risk) ≈ 2.50
Waiting for a pullback to $135.00 provides a more favorable risk/reward ratio, offering greater potential gains relative to potential losses. This strategy aligns with a more conservative investment approach.
Price Forecast Scenarios
Optimistic: $160.00 (assuming continued bullish momentum)
Neutral: $150.00 (aligning with current resistance levels)
Pessimistic: $125.00 (testing lower support levels)
Conclusion
NVIDIA's recent performance reflects strong growth and positive market sentiment.
Aggressive Entry (Today's Price, $146.43): Offers potential for short-term gains but carries higher risk due to near overbought conditions.
Conservative Entry (Pullback to $135.00): Provides a better risk/reward balance, ideal for those seeking a more cautious approach.
Verdict: While both strategies have merit, waiting for a pullback to $135.00 offers a more balanced entry point, allowing investors to capitalize on NVIDIA's growth potential with reduced risk.
Disclaimer: This analysis is for informational purposes only and does not constitute financial advice. Investing in stocks involves risk. Always conduct your own research and consult with a financial advisor before making any investment decisions. Use this information at your own risk; I am not responsible for any outcomes that do not align with expectations.

The 3 New Rules For Trading Nvidia StockIts been a long night i really feel
the night was very long and tiring.
I had a cup of coffee around 17 hours
Almost before the sunset.
I knew I should not drink coffee near
The sunset its a bad habit of mine.
I was trying to convince myself
that by the time
When the market closes I will have enough
energy to sleep
Of course, I will do a little exercise before
bedtime to help
With insomnia.
Watching the financial market can be a stress
especially if you
are doing it full-time like myself.
But with a system things become easier
The only challenge is in the
beginning because you have to develop this
mindset of always studying the market
And then finally once you know the market you
seem not to want to stop
This is why I have developed the 3 rules for
trading NASDAQ:NVDA
Rule 1:The price has to be above the 50 ma
Rule 2:The price has to be above the 200 ma
Rule 3:The price should gap up in a trend
Now I do love dip-buying stock prices
but sometimes you need a strategy that
can adapt to the market
this strategy is called the rocket booster
it will help you adapt to any market
like seriously
any market
This is the basis strategy for beginners
and experts
To learn more Rocket boost
this content
Disclaimer: Trading is risky you will
lose money whether you like it or not
Please learn risk management and profit-taking
strategies, Because you will lose money
whether you like it or not.

Nvidia Is Following This Simple 3 Step SystemThe time has come again for NASDAQ:NVDA
to shine again..you see it was
during the pandemic when This
stock started to shine..everyone was talking
about it...i still remember it
like yesterday..it was the A.I. Boom!!
It was crazy..people were buying
it and making money
It was crazy times..last week I saw Amazon
Hit new highs..
So this year Nvidia
is left behind but there's still hope
With this 3-step system
you can still hop on the Nvidia train
to profit taking.
The 3-step system is very simple
and yes it works.
Its as follows:
Step#1 - The price has to be above the 50 EMA
Step#2 - The price has to be above the 200 MA
Step#3 - The price has to gap up
Now on this chart, you will see
the William % This indicator
is an oscillator
Meant to show you whether the price
is undervalued or not
In this case, Nvidia is undervalued--meaning its
cheap this is why you won't hear about it
In mainstream media.
Because when the stock price is cheap no one talks about it
in mainstream media
In fact you may actually even
get huge backlash for recommending it
on mainstream media.
By the time the stock hits mainstream media
it's too late to profit from it am sorry
Anyway, if you want to learn more
rocket boost this content
Disclaimer: Trading is risky
please learn risk management and profit taking
strategies
because you will lose money whether
you like it or not.

Intel in Trouble or Ready for Redemption?There is growing potential for QUALCOMM Incorporated to acquire Intel.
I now believe that this development has advanced enough to warrant a fresh look at the stock
Qualcomm recently approached Intel about a takeover. According to WSJ , Qualcomm has expressed interest in acquiring Intel, which, if realized, would mark one of the most significant deals in recent history
Initially, this seemed like a long shot, with limited details emerging from the report. However, QCOM has continued to pursue the idea. Also QCOM has been in contact with Chinese antitrust regulators over the past month about this potential deal and is waiting until after the US presidential election to decide on making a formal offer. Since the election is just less than a month away, I believe this acquisition is becoming more of a possibility that investors should factor into their assessment of INTC. If a deal goes through, it’s likely that the acquisition will come at a premium to the current stock price, creating an opportunity for significant short term gains for investors
There is always a chance that no deal will occur. In that case, potential investors should evaluate whether the stock is worth holding as a long-term investment. My outlook here is not optimistic, and I’ll delve into INTC's competitive position, as indicated by its latest inventory data, in the next section
Given these two potential scenarios, I am upgrading my rating from "Sell" to "Hold." In summary, the possibility of QCOM acquiring INTC introduces a major upside catalyst that I hadn’t accounted for in my previous analysis. This potential acquisition helps offset some of the concerns about INTC as a standalone company.
Unlike many financial metrics that can be interpreted in different ways, inventory levels are more straightforward. He also explained that inventory trends can provide early indicators of business cycles. For cyclical industries, rising inventories can signal overproduction as demand wanes, while shrinking inventories can indicate strong demand
As shown in INTC’s most recent balance sheet, its inventory levels have generally been on the rise. For instance, in December 2014, inventory was valued at $ 4.273 billion, while the most recent figures show an increase to $ 11.244 billion. In some cases, rising inventory can signal business growth with increasing demand and production capacity, which was true for Intel in the early part of the last decade.
When inventory growth exceeds the pace of business growth, it becomes a red flag. In this scenario, rising inventory suggests weakened competitiveness and declining market position—an issue that Intel currently faces, in my opinion. The following chart helps illustrate this point, showing a comparison of days of inventory outstanding (DIO) for Intel and NVIDIA over the last five years, from 2020 to 2024. DIO is a measure of how many days it takes a company to sell its inventory
Given Intel's inventory buildup and declining competitive edge, I find its current valuation multiples hard to justify. Specifically, the chart highlights a comparison of price-to-earnings (P/E) ratios between Intel, NVIDIA, and AMD. Focusing on non-GAAP earnings estimates for fiscal years FY1 through FY3, Intel is currently trading with the highest P/E ratio for FY1 at 87.7 almost twice the multiple of NVIDIA and AMD, which are at 46.29 and 46.25, respectively
That said, the outlook changes somewhat when considering the years further ahead. For instance, in FY2, NVIDIA’s expected P/E ratio rises to the highest at 32.77, compared to Intel's 20.02 and AMD's 29.02. However, I want to emphasize the substantial uncertainty in Intel's earnings forecasts. As shown in the next chart, the consensus estimates for Intel's earnings per share (EPS) in FY 2024 range from a low of $0.15 to a high of $0.31 (a more than twofold variation) and from a low of $0.65 to a high of $2.1 (an almost fourfold variation). Given such uncertainty, I believe investors should be cautious about relying too heavily on forward P/E ratios too far into the future.
Both Intel and NVIDIA have experienced significant fluctuations in DIO over the years. Notably, both companies saw a spike in 2023 due to the COVID pandemic, which disrupted global supply chains. As the disruption faded, both firms saw a recovery (ie, a reduction in DIO). the difference in recovery is striking. Intel's DIO peaked at over 150 days in 2023 and has since decreased to 125 days a modest reduction but still above its historical average of 114 days. In contrast, NVIDIA's DIO surged to over 200 days but has rapidly dropped to 76 days, which is not only below its four-year average of 97.9 days but also near its lowest level in four years.
I expect Intel to face increasing competitive pressure as rivals like NVIDIA and AMD roll out their next-generation chips, particularly NVIDIA’s Blackwell chips. I recommend potential investors keep a close eye on inventory data, as it can signal changes in competitive dynamics for the reasons discussed here.
In addition to inventory issues and valuation risks, Intel faces a few other specific challenges. A significant portion of Intel’s current product lineup is concentrated in certain segments, such as PCs, which I believe are nearing market saturation plus a large share of Intel’s revenue comes from China. Given the ongoing trade tensions between the US and China, this heavy reliance on China poses a considerable geopolitical risk. These factors may limit Intel’s ability to adapt to technological advancements and shifting geopolitical conditions
The potential for a QUALCOMM acquisition has emerged as a new major upside catalyst. While my outlook on Intel’s business remains pessimistic based on the latest inventory data, the acquisition possibility partially offsets these negatives, leading me to upgrade my rating from Sell to Hold or if you are risk taker like Me, load the dip

NVDA (NVDL) BIG MOVE BREWING, BUY THE DIP! 100%+ MOVE INBOUNDNASDAQ:NVDA NASDAQ:NVDL
BIG MOVE BREWING, BUY THE DIP! 100%+ MOVE INBOUND
In this video, we discuss the following:
1.) My #HIGHFIVESETUP trading strategy which incorporates charting patterns, volume profiles, MACD, RSI, and TREND.
Notable recent winners with my strategies include NASDAQ:TSLA NASDAQ:SOFI NASDAQ:MBLY NASDAQ:AMZN NYSE:HIMS
2.) Go in-depth on how to tell when an investment or trade will go against you and what you should be looking for. We go over my favorite indicator for this, which is the Williams R%.
We primarily discuss the 2X levered ETF NASDAQ:NVDL which has the same setup as it's parent NASDAQ:NVDA . So feel free to use this setup for either one depending on your risk tolerance.
Thanks for all the support! Over 500 TV followers in such a short period of time, you all are amazing!
LIKE l FOLLOW l SHARE for more great content and analysis!
NFA

Nvidia [NVDA] Top is in!! [S #1]----------------------------------------------------------------------------------------------
**First off, I have not posted in a while but the good news is I plan to become active and post consistently!
I will be providing high quality signals, and only signals and analysis that I personally find worth showing. Any smaller less likely to succeed trades I will be avoiding.
This will be a new series of content, I will label posts depending on category:
= Signal (Expect clear and direct post, I will not be showing or explaining much of the TA)
= Educative Post (I will be showing my Technical Analysis (TA) and teaching how it works)
Since this is a new series of posts, I will label this post as the first signal (S #1)
----------------------------------------------------------------------------------------------
***ALL ANALYSIS, SIGNALS, AND ANY CONTENT IS FOR EDUCATIONAL PURPOSES
ONLY AND ARE NOT MEANT TO BE PROFITED OFF.***
----------------------------------------------------------------------------------------------
----------------------------------------------------------------------------------------------
Current Price which is $140,25 at market close, and $140.30 during the pre market.
It is already starting to dip a bit during the pre market!
This Signal is based from bearish divergences, price action, miscellaneous bear flags, and my special indicator.
$135.24
$127.87
$122.71
Tight Stop loss: $142.52
Good Stop loss: $144.50
Loose Stop loss: $146.20
----------------------------------------------------------------------------------------------
***ALL ANALYSIS, SIGNALS, AND ANY CONTENT IS FOR EDUCATIONAL PURPOSES
ONLY AND ARE NOT MEANT TO BE PROFITED OFF.***
----------------------------------------------------------------------------------------------

NVIDIA on the Move: Key Levels to Watch! NVIDIA’s setting up for some action: we’re looking at a run to $143.60, but if we break through, we could be cruising up to the $150–$153 range! On the flip side, if we slip below $129.72, brace yourself—$117 could be on deck. Let’s keep it simple and see how it plays out!"
Easy Breakdown for the Trade
Current Target: $143.60
Right now, NVIDIA’s aiming at $143.60. If buyers keep stepping in, this is the first level we’re likely to hit. Think of it as the “first checkpoint” for our bullish move.
The Bullish Range: $150–$153
Breaking past $143.60 could open up a fresh wave of momentum. If we get through this level with some energy, then NVIDIA could quickly head up to the $150–$153 range. This is the zone where we’d see if buyers are still strong, so keep it on your radar if we reach it.
Critical Support at $129.72
Now, here’s the key to the downside. $129.72 is the level holding NVIDIA up right now. If we lose this support, it’s a signal that sellers have taken control. This could mean a strong dip is in the works.
Downside Target: $117
If we break $129.72, the next realistic target to the downside is $117. It’s a significant drop, but definitely within range if support doesn’t hold.
Trading Tip
Mark your levels and watch for those breaks! $143.60 is our short-term target, and if we clear it, we’re looking up to $150–$153. But if NVIDIA slips below $129.72, $117 becomes a real possibility. Keep it flexible, and trade the levels!
Mindbloome Trading / Kris
Mindbloome Exchange

Nvidia So close to earnings report ! here is my analysis... In this chart, I haven't moved anything at all since my previous analysis of Nvidia. The price is making its natural movement just as we’ve been predicting.
As you can see, the last candle closed by bouncing off my order block and following the pattern of my forecast arrow.(yellow dotted arrow) Based on the price behavior, we can predict that as it gets closer to November 20 — the earnings report date — it will simply be accumulating.
Nvidia's last earnings reports have been phenomenal, and I don’t doubt that this report will be a trigger for the price to make a decision.
But for now, we’ll only see the price in a range until a few days before the report, when we’ll see those high-volume candles that will drive the price in a single direction.
Which direction? The one the report indicates.
Best regards!

NVDA lets go DOWNNASDAQ:NVDA
I would like to ask you to support me and subscribe to me on tg. The link is in the signature.
I continue to believe that the short on this stock will quite reach the lower values. Let's open shorts and take our profit soon.

NVDA Revving Engine UpA nice Consolidation over the last 2 weeks with declining Volume.
An easy move to 155-160 is imminent.
#nvda #NVIDIA #semis #chips #nasdaq

Since incorporating the Bitcoin StrategySince incorporating the Bitcoin Strategy, Michael Saylor has outperformed every single stock in the entire S&P500, including Nvidia. Big shoutout to him, well done sir.
NVIDIA Waiting for the big day !!!! Although we closed last week with a candlestick pattern called an 'Inside Candle,' the following candle was green, but it didn’t exceed the last high (see slanted yellow arrow).
Nvidia is stronger than ever, but that doesn’t mean the price won’t take a pause or make a small pullback before its report; rather, the price is likely entering an accumulation phase, as everyone expects Nvidia’s upcoming quarterly report to show excellent earnings results.
So my forecast for Nvidia is that it will fluctuate between my point of interest as resistance and the yellow order block as support, but the most important moment here will be its earnings report day—that’s when the price will make a decision and direction.
Thank you for supporting my analysis.
TRADE SAFE
Best regards!"

NVIDIA weekly and logHello,
A quick look at the past.
Well, it's been going up since 2012!
A short-term trend has resumed in the long-term trend as shown by the regression line channels.
The orange line represents the 200-period simple average.
Make your own opinion, before placing an order.
► Thank you for boosting, commenting, subscribing!

Take 40% profit and going downNASDAQ:NVDA
The stock has reached our target zone, bringing us a 40% profit.
For long-term holders – don’t sell; after a correction, it will generate more returns as it’s trending and set for further growth.
For swing traders, consider closing positions as a correction is likely to push prices down. I’ll give you a buy signal again afterward.

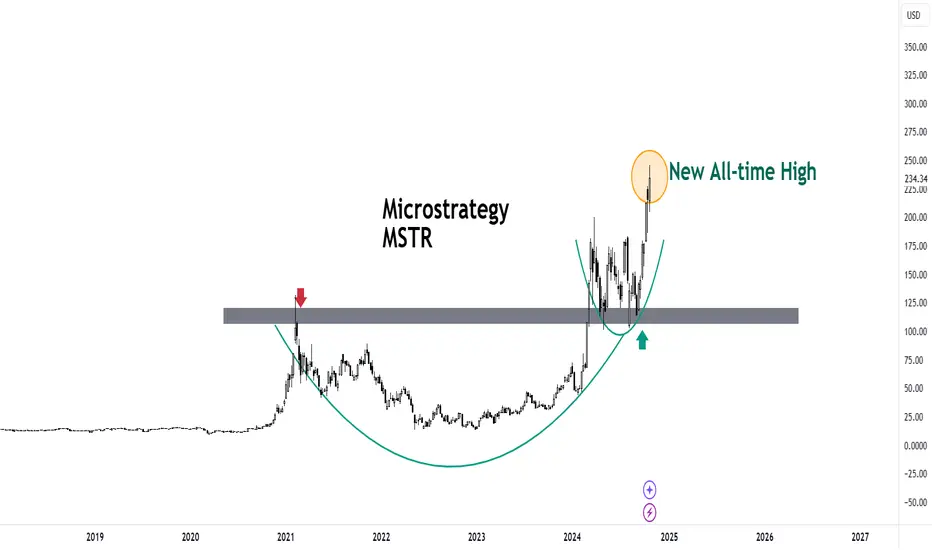
MicroStrategy's Bullish Run: A Closer LookMicroStrategy, a business intelligence company, has been making significant strides in the cryptocurrency market, particularly with its substantial Bitcoin holdings. The company's market capitalization is inching closer to that of Coinbase, a major cryptocurrency exchange. This surge in valuation has sparked interest and speculation among investors and analysts alike.
A Strategic Bitcoin Bet
MicroStrategy's aggressive Bitcoin buying strategy, spearheaded by CEO Michael Saylor, has positioned the company as a major player in the cryptocurrency space. The company's belief in Bitcoin's long-term potential as a store of value and a hedge against inflation has driven its decision to allocate a significant portion of its treasury to the cryptocurrency.
This strategic move has paid off handsomely, as Bitcoin's price has soared recently. As a result, MicroStrategy's stock price has also experienced substantial growth, attracting the attention of investors seeking exposure to the cryptocurrency market without directly owning Bitcoin.
Market Cap Milestone Looms
With its market capitalization steadily rising, MicroStrategy is on the cusp of a major milestone: overtaking Coinbase's market cap. At the time of writing, MicroStrategy is just $3.9 billion away from achieving this feat. This would be a significant achievement for a company that was once primarily known for its business intelligence software.
Factors Driving MicroStrategy's Success
Several factors have contributed to MicroStrategy's impressive performance:
1. Bitcoin's Price Appreciation: The continued rise in Bitcoin's price has directly benefited MicroStrategy, as the company's Bitcoin holdings have increased in value.
2. Institutional Adoption of Bitcoin: Growing institutional interest in Bitcoin has legitimized the cryptocurrency and increased its appeal to mainstream investors.
3. MicroStrategy's Strong Balance Sheet: The company's solid financial position has enabled it to weather market volatility and continue its Bitcoin accumulation strategy.
4. Investor Confidence in Michael Saylor's Vision: Saylor's unwavering belief in Bitcoin and his ability to execute on his strategy have instilled confidence in investors.
Technical Analysis: A Bullish Outlook
Technical analysis of MicroStrategy's stock chart reveals a bullish trend. The stock has been forming higher highs and higher lows, indicating a strong uptrend. Additionally, the recent surge in trading volume relative to Nvidia, a tech giant, suggests increased investor interest and potential for further price appreciation.
The MicroStrategy stock-to-BTC ratio has also hit an all-time high, surpassing the levels seen during the 2021 bull run. This indicates that investors increasingly value MicroStrategy's Bitcoin holdings, which could further drive the stock price higher.
Potential Risks and Challenges
While MicroStrategy's future looks promising, it is important to acknowledge the potential risks and challenges that could impact the company's performance:
1. Bitcoin Price Volatility: Bitcoin's price is highly volatile, and any significant decline could negatively impact MicroStrategy's valuation.
2. Regulatory Uncertainty: Changes in cryptocurrency regulations could create uncertainty and hinder the company's operations.
3. Competition from Other Bitcoin-Focused Companies: Other companies may emerge as strong competitors, challenging MicroStrategy's dominance in the Bitcoin investment space.
Conclusion
MicroStrategy's impressive performance and its strategic focus on Bitcoin have positioned it as a major player in the cryptocurrency market. As the company continues to execute its strategy and benefit from Bitcoin's long-term growth potential, its market capitalization could surpass that of Coinbase, marking a significant milestone. However, investors should be mindful of the inherent risks associated with cryptocurrency investments and conduct thorough research before making any investment decisions.

We can extend into the Target Box, But below $128.73 = $95 BucksNvidia has arrived in the target box for our intermediate (B) wave high. Can we extend in the target box? Yes.
However, two things are top of mind to this analyst.
1) The earnings catalyst mid-November is a "keep hope alive event". Therefore, I do not see big trader commitments prior to that. If we go up further into the target box...it will be an overlapping grinding pattern. I see the earnings catalyst as positive fundamentally, but a technical sell event.
2) If price breaches $128.74...that should yield us $95.
If this is how the price action plays out...then at $95, you would do well consider NVDA longs.
Best to all,
Chris

UPSIDE TARGETS for NVIDIA #NVDA ...As you can see Nvidia has already triggered a Hunt Volatility Funnel pattern #HVF
Target 1 has already been made ($134.93)
Target 2 is in progress coming in at $157.93
Target 3 is at $188.98
With the US election uncertainty almost out of the way.
WallSt can then get behind a Santa rally.
Don't be surprised if you see Nvidia get close to (buy probably not reach) $200
$188.98 gives Nvidia a $4.6T marketcap
@TheCryptoSniper

BIG POST! | How To Beat SP500?
S&P 500 Performance: +35% since 2022.
My Selected Portfolio Performance: +62%, with an 82% hit rate.
Top Performing Stocks: NVDA (+735%), ANET (+343%), META (+209%), and more.
Technical Analysis Tools Used: Price action, trendlines, Fibonacci levels, round numbers, and more.
It’s been nearly three years since I posted my analysis of S&P 500 stocks on February 23, 2022. Back then, I reviewed all 500 stocks, applied some quick technical analysis, and identified 75 stocks that stood out for me. Importantly, I relied solely on technical analysis to make my picks. Fast forward to today, and the results speak for themselves. Most of these selections have significantly outperformed the broader market, proving the power and importance of technical analysis.
While many investors rely solely on fundamentals, technical analysis brings a dynamic edge that’s often underestimated. By focusing on price action and market behavior, technical analysis allows us to spot opportunities that others might miss, especially it gives a massive psychological edge while the markets are making corrections. The market doesn't care what you know, the market cares what you do!
Here’s what I used for my analysis:
It's kind of pure price action - previous yearly highs, trendlines, a 50% retracement from the top, round numbers, Fibonacci levels, equal waves, and channel projections. For breakout trades, determined strong and waited for confirmation before pulling the trigger.
The Results
While the S&P 500 has gained around 35% over this period , my selected stocks from the same list have made +62%! Out of the 75 stocks I picked, 67 have hit my target zones and 54 are currently in the green. That’s an 82% hit rate, and for me, that’s a good number!
Now, for those who favor fundamental analysis, don’t get me wrong, it has its place. But remember, fundamentals tell you what to buy, while technicals tell you when to buy - to be a perfect investor, you need them both. You could hold a fundamentally strong stock for years, waiting for it to catch up to its "true value," while a technical analyst might ride multiple trends and capture far superior returns during that same time. Also, the opposite can happen – you may see a great technical setup, but if the fundamental factors are against it, you could end up with your money stuck in a bad trade.
To put these ideas in perspective, starting with a simulated portfolio of $76,000, where each stock had an equal investment of around $1,000–$1,100, the portfolio is now worth around $124,000. The results are based on buying at marked zones and holding until today. I calculated entries from the middle of the target zone, as it’s a more realistic and optimal approach compared to aiming for perfect lows (which, frankly, feels a bit scammy) to get much(!) higher returns. This method reflects real-world trading.
Before we dive in, here are the current Top 5 stocks from My Picks:
NVDA: +735%
ANET: +343%
TT: +227%
META: +209%
LEN: +164%
These numbers demonstrate the effectiveness of a solid technical strategy. Many say it's tough to beat the market with individual stock picks, but these results show it’s not just possible, it’s absolutely achievable with the right tools and approach.
Now, let's dive into the charts!
1. Apple (AAPL) - a load-it-up type of setup has worked out nicely. Used previously worked resistance levels. If the stocks performing well and the market cap is big enough then these levels can help you to get on board.
Current profit 65%
Before:
After:
---------------------------
2. Adobe (ADBE) - came down sharply, but the price reached the optimal area and reversed.
Current profi 38%.
Before:
After:
---------------------------
3. Advanced Micro Devices (AMD) - round number, strong resistance level becomes support and the climb can continue.
Current profit 101%
Before:
After:
---------------------------
4. Amazon (AMZN) - came down from high prices to the marked levels and those who were patient enough got rewarded nicely.
Current profit 66%
Before:
After:
---------------------------
5. Arista Networks (ANET) - retest of the round nr. worked perfectly, as a momentum price level, after the strong breakout.
Current profit 343%
Before:
After:
---------------------------
6. Aptiv PLC (APTV): Came down quite sharply and it will take some time to start growing from here, if at all. The setup was quite solid but probably fundamentals got weaker after the all-time high.
Current loss -24%
Before:
After:
---------------------------
7. American Express (AXP) - firstly the round nr. 200 worked as a strong resistance level. Another example is to avoid buying if the stock price approaches bigger round numbers the first time. Came to a previous resistance level and rejection from there…
Current profit 104%
Before:
After:
---------------------------
8. Bio-Rad Laboratories (BIO) - in general I like the price action, kind of smoothly to the optimal zone. It might take some time to start growing from here but also fundamentals need to look over.
Current loss 6%
Before:
After:
---------------------------
9. BlackRock (BLK) - kind of flawless. All criteria are in place and worked perfectly.
Current profit 81%
Before:
After:
---------------------------
10. Ball Corporation (BALL) - a perfect example of why you should wait for a breakout to get a confirmed move. No trade.
Before:
After:
---------------------------
11) Berkshire Hathaway (BRK.B) - Buy the dip. Again, as Apple, a big and well-known company - all you need to do is to determine the round numbers, and small previous resistances that act as support levels, and you should be good.
Current avg. profit from two purchases 64%
Before:
After:
---------------------------
12) Cardinal Health (CAH) - the retest isn't as deep as wanted but still a confirmed breakout and rally afterward. Still, the bias was correct!
Before:
After:https://www.tradingview.com/x/83OmlWuv/
---------------------------
13) Ceridian HCM Holding (DAY) - found support from the shown area but not much momentum.
Current profit 20%
Before:
After:
---------------------------
14) Charter Communications (CHTR) - technically speaking it is a quite good price action but kind of slow momentum from the shown area. Probably came too sharply and did not have enough previous yearly highs to support the fall.
Current loss -10%
Before:
After:
---------------------------
15) Comcast Corp. (CMCSA) - got liquidity from new lows, pumped up quickly, and is currently fairly solid.
Current profit 10%
Before:
After:
---------------------------
16) Cummins (CMI) - got rejected from 2028 and 2019 clear highs, fairly hot stock, and off it goes.
Current profit 80%
Before:
After:
---------------------------
17) Salesforce.com (CRM) - perfect. 50% drop, strong horizontal area, and mid-round nr did the work.
Current profit 83%
Before:
After:
---------------------------
18) Cisco Systems (CSCO) - worked and slow grind upwards can continue.
Current profit 30%
Before:
After:
---------------------------
19) Caesars Entertainment (CZR) - not in good shape imo. It has taken too much time and the majority of that is sideways movement. Again, came too sharply to the optimal entry area.
Current loss -16%
Before:
After:
---------------------------
20) Devon Energy (DVN) - inside the area and actually active atm. Still, now I’m seeing a bit deeper correction than shown.
Before:
After:
---------------------------
21) Electric Arts (EA) - 6 years of failed attempts to get a monthly close above $150 have ended here. It got it and we are ready to ride with it to the higher levels.
Current profit: kind of BE
Before:
After:
---------------------------
22) eBay (EBAY) - it took some time but again, worked nicely.
Before:
After:
---------------------------
23) Enphase Energy (ENPH) - got a breakout, got a retest, and did a ~76% rally after that! If you still hold it, as I do statistics, then…
Current loss -59%
Before:
After:
---------------------------
24) Expeditors International of Washington (EXPD) - kind of worked but didn't reach. No trade.
Before:
After:
---------------------------
25) Meta Platforms (META) - the bottom rejection from the round number $100 is like a goddamn textbook :D At that time 160 and 200 were also a good area to enter. Here are several examples of the sharp falls/drops/declines - watch out for that, everything should come fairly smoothly. Still, it ended up nicely and we have a massive winner here...
Current profit 209%
Before:
After:
---------------------------
26) FedEx (FDX) - I love the outcome of this. Very solid price action and multiple criteria worked as they should. Perfect.
Current profit 60%
Before:
After:
---------------------------
27) First Republic Bank (FRC) - firstly got a solid 30 to 35% gain from the shown area but...we cannot fight with the fundamentals.
Current loss 99%
Before:
After:
---------------------------
28) General Motors (GM) - finally found some liquidity between strong areas and we are moving up.
Current profit 47%
Before:
After:
---------------------------
29) Alphabet (GOOG) - load it up 3.0, a good and strong company, and use every previous historical resistance level to jump in.
Current avg. profit after three different price level purchases 63%
Before:
After:
---------------------------
30) Genuine Parts (GPC) - coming and it looks solid.
Before:
After:
---------------------------
31) Goldman Sachs (GS) - really close one.
Current profit 86%
Before:
After:
---------------------------
32) Hormel Foods (HRL) - quite bad performance here. Two trades, two losses.
The current loss combined these two together is 35%
Before:
After:
---------------------------
33) Intel (INTC) - at first perfect area from where it found liquidity, peaked at 65%. Still, I make statistics if you still holding it then…
Current loss -21%
Before:
After:
---------------------------
34) Ingersoll Rand (IR) - beautiful!
Current profit 144%
Before:
After:
---------------------------
35) Intuitive Surgical (ISRG) - the trendline, 50% drop, strong horizontal area. Ready, set, go!
Current profit 157%
Before:
After:
---------------------------
36) Johnson Controls International (JCI) - second rest of the area and then it started to move finally..
Current profit 55%
Before:
After:
---------------------------
37) Johnson & Johnson (JNJ) - Buy the dip and we had only one dip :)
Current profit 13%
Before:
After:
---------------------------
38) CarMax (KMX) - the area is strong but not enough momentum in it so I take it as a weakness.
Current profit kind of BE
Before:
After:
---------------------------
39) Kroger Company (KR) - without that peak it is like walking on my lines
Current profit 15%
Before:
After:
---------------------------
40) Lennar Corp. (LEN) - strong resistance level becomes strong support. Beautiful!
Current profit 164%
Before:
After:
---------------------------
41) LKQ Corp. (LKQ) - just reached and it should be solid. Probably takes some time, not the strongest setup but still valid I would say.
Before:
After:
---------------------------
42) Southwest Airlines (LUV) - no breakout = no trade! Don’t cheat! Your money can be stuck forever but in the meantime, other stocks are flying as you also see in this post. If there is a solid resistance, wait for the breakout and possibly retest afterward! Currently only lower lows and lower highs.
Before:
After:
---------------------------
43) Las Vegas Sands (LVS) - channel inside a channel projection ;) TA its own goodness!
Current profit 70%
Before:
After:
---------------------------
44) Microchip Technology Incorporated (MCHP) - worked!
Current profit 37%
Before:
After:
---------------------------
45) Altria Group (MO) - got a bit deeper retest, liquidity from lower areas, and probably a second try..
Currently kind of BE
Before:
After:
---------------------------
46) Moderna (MRNA) - "seasonal stocks", again too sharp and we are at a loss…
Current loss -37%
Before:
After:
---------------------------
47) Morgan Stanley (MS) - the first stop has worked, and got some nice movements.
Current profit 62%
Before:
After:
---------------------------
48) Microsoft (MSFT) - Load it up 4.0, buy the dip has worked again with well-known stock.
Three purchases and avg. return from these are amazing 70%
Before:
After:
---------------------------
49) Match Group (MTCH) - it happens..
Current loss -53%
Before:
After:
---------------------------
50) Netflix (NFLX) - almost the same as Meta. Came quite sharply but the recovery has been also quick. Another proof is that technical analysis should give you a psychological advantage to buy these big stocks on deep corrections.
Current profit 153%
Before:
After:
---------------------------
51) NRG Energy (NRG) - Perfect weekly close, perfect retest…
Current profit 90%
Before:
After:
---------------------------
52) NVIDIA (NVDA) lol - let this speak for itself!
Current profit 735%
Before:
After:
---------------------------
53) NXP Semiconductors (NXPI) - usually the sweet spot stays in the middle of the box, and also as I look over these ideas quite a few have started to climb from the first half of the box. Touched the previous highs.
Current profit 74%
Before:
After:
---------------------------
54) Pfizer (PFE) - actually quite ugly, TA is not the strongest. Probably results-oriented but yeah..
Current loss -25%
Before:
After:
---------------------------
55) PerkinElmer - “after” is EUR chart but you get the point.
Current profit 25%
Before:
After:
---------------------------
56) Pentair (PNR) - worked correctly, 50% drop combined with the horizontal area, easily recognizable, and the results speak for themselves.
Current profit 124%
Before:
After:
---------------------------
57) Public Storage (PSA) - again, previous yearly highs and the trendline did the job.
Current profit 36%
Before:
After:
---------------------------
58) PayPal (PYPL) - the area just lowers the speed of dropping, but slowly has started to recover.
Current loss -14%
Before:
After:
---------------------------
59) Qorvo (QRVO) - slow, no momentum.
Current profit 10%
Before:
After:
---------------------------
60) Rockwell Automation (ROK) - previous yearly high again, plus some confluence factors.
Current profit 32%
Before:
After:
---------------------------
61) Rollins (ROL) - after posting it didn’t come to retest the shown area. Being late for a couple of weeks. Worked but cannot count it in, the only thing I can count is that my bias was correct ;)
Before:
After:
---------------------------
62) Snap-On Incorporated (SNA) - same story!
Before:
After:
---------------------------
63) Seagate Technology (STX) - firstly it came there! Look how far it was, the technical levels are like magnets, the price needs to find some liquidity for further growth and these areas can offer it. I like this a lot, almost all the criteria are in place there.
Current profit 73%
Before:
After:
---------------------------
64) Skyworks Solutions (SWKS) - one of the textbook examples of how trendline, 50% drop, round nr. and strong horizontal price zone should match. Still a bit slow and it will decrease the changes a bit.
Kind of BE
Before:
After:
---------------------------
65) TE Connectivity (TEL) - came down, and got a rejection. “Simple” as that.
Current profit 37%
Before:
After:
---------------------------
66) Thermo Fisher Scientific (TMO) - mister Ranging Market.
Current profit 19%
Before:
After:
---------------------------
67) Trimble (TRMB) - finally has started to move a bit. Got liquidity from previous highs again and..
Current profit 45%
Before:
After:
---------------------------
68) Tesla (TSLA) - made a split. Have been successfully recommended many times after that here and there but two years ago we traded in these price levels and..
Current profit 19%
Before:
After:
---------------------------
69) Train Technologies (TT) - dipped the box and off it goes! Epic!
Current profit 227%
Before:
After:
---------------------------
70) Take-Two Interactive Software (TTWO) - I like this analysis a lot. Worked as a clockwork.
Current profit 60%
Before:
After:
---------------------------
71) United Rentals (URI) - WHYY you didn’t reach there :D Cannot count it.
Before:
After:
---------------------------
72) Waters Corp. (WAT) - came to the box as it should be slow and steady. As the plane came to the runway.
Current profit 41%
Before:
After:
---------------------------
73) Exxon Mobil Corp. (XOM) - another escaped winner. Didn’t come down to retest my retest area so, missed it.
Before:
After:
---------------------------
74) Xylem (XYL) - perfect trendline, good previous highs, 50% drop from the peak and..
Current profit 76%
Before:
After:
---------------------------
75) Autodesk (ADSK) - took a bit of time to start climbing but everything looks perfect. Nice trendline, 50% drop from ATH, previous yearly highs - quite clean!
Current profit 66%
Before:
After:
The strategies above show how useful price action, key levels, and psychology can be for investing. By spotting breakouts, and pullbacks, or focusing on round numbers and past highs, technical analysis helps give traders an edge in understanding the market.
Regards,
Vaido

Exploring Nvidia's India Strategy: AI and LanguageNvidia, a leading technology company, has solidified its commitment to India with a series of significant announcements. The company unveiled a Hindi language model and forged strategic partnerships with major Indian corporations, underscoring its ambition to drive AI innovation and language technology in the country.
One of the most notable partnerships announced by Nvidia is with Reliance Industries, led by billionaire Mukesh Ambani. The two companies have outlined plans to build AI infrastructure in India, leveraging Nvidia's cutting-edge hardware and software solutions. This collaboration aims to accelerate AI research, development, and deployment across various sectors, including healthcare, agriculture, and education.
In addition to the partnership with Reliance, Nvidia also launched Nemotron-4-Mini-Hindi 4B, a small language model specifically designed for the Hindi language. Hindi, as the most widely spoken language in India, holds immense cultural and economic significance. The availability of a powerful Hindi language model will enable developers to create innovative applications and services tailored to the needs of Hindi-speaking users.
Nvidia's investment in India comes at a time when the country is experiencing a surge in AI adoption and development. The government's initiatives to promote digital transformation and innovation have created a favorable environment for technology companies to thrive. By partnering with leading Indian firms and investing in language technology, Nvidia is positioning itself as a key player in India's AI ecosystem.
The launch of the Hindi language model is a significant step towards bridging the language gap in AI. While English has dominated the AI landscape, there is a growing recognition of the importance of developing language models for regional languages. By investing in Hindi, Nvidia is demonstrating its commitment to making AI accessible to a wider audience and empowering local communities.
Beyond the immediate benefits of language technology, Nvidia's India strategy also has broader implications. By fostering partnerships and investing in AI infrastructure, the company is contributing to the development of a skilled workforce and promoting innovation in the country. This could have a long-term impact on India's economic growth and competitiveness on the global stage.
In conclusion, Nvidia's announcement of a Hindi language model and partnerships with major Indian companies marks a significant milestone in its India strategy. By investing in AI and language technology, the company is positioning itself as a key player in the country's digital transformation. As India continues to embrace AI, Nvidia's commitment to the region is likely to yield substantial benefits for both the company and the nation.

NVDA Weekly to Four Hour In Depth Analysis Where Are We Going Good evening Traders
So in this video I go into the weekly and down to the four hour and 30 minute identifying key levels to look out for and where the market is going.
Currently where we are I really thought we were going to have a shorter correction and punch back up but hey I dont assume and I only trade what the market gives me.
What is currently happening is if we can break and close above 140.65 to me that would be a great entry for this bull run up to 150's
However we can correct back into the zone of 138.40 and then go back into the full bull swing of things
And Lastly we are sinking further to the 129.64 level looking for a entry on another bull run up, if we break lower then I dont know what to tell you other than our bull run maybe over ???
If you like the video: please share, boost, and follow or comment: give me feedback on what you currently see and why.
Hope you have a great day trading
Mindbloome Trading
Trade What You See

S&P 500 Is Higher Than Ever. Can Earnings Support the Growth?Tech giants are in the waiting room, prepping their financial updates while investors drool over prospects of AI-fueled revenues. The season kicked off with Wall Street banks posting some convincing numbers for the September quarter, painting an optimistic outlook for Corporate America’s biggest and brightest players.
The S&P 500 is hot, hot, hot. Investors just can’t get enough of the 500-strong index and last Friday they pushed it to its 47th record closing high of the year. And they did it with finesse — on the eve of the 37th anniversary of the “Black Monday” market crash. (On Oct. 19, 1987, the S&P 500 wiped out a record 20% and the Nasdaq shed 12%.) Broadly, US indexes are having a bumper year, with most of them up double digits or more.
With no time to waste, markets are shifting their attention to the looming slate of big tech earnings reports . Here’s what’s going to be turning heads this week:
📌 On Wednesday , EV maker Tesla TSLA will be the main character in the world of corporate updates. Wall Street is eyeballing earnings north of $25.4 billion, up from $23.4 billion in the year-ago quarter. Besides Elon Musk’s EV giant, Wednesday will bring earnings from Coca Cola KO , Boeing BA , IBM IBM and telecoms mainstays T-Mobile TMUS and AT&T T .
📌 On Thursday , the earnings roll keeps rolling in with e-commerce and cloud computing juggernaut Amazon AMZN reporting after the closing bell.
But all that earnings action looks fairly light — wait till you see what’s cooking for next week. *drumroll please* … 🥁
The Magnificent Seven club of tech highflyers will be represented by four of its members. (Tesla and Amazon report the prior week and Nvidia NVDA reports in about a month from now.)
📌 On October 29 , Google parent Alphabet GOOGL is scheduled to report earnings figures. Shares of the tech heavyweight are up about 18% on the year but got stuck recently after the Department of Justice filed a range of possible changes aimed at reducing Google’s search dominance.
📌 On October 30 , Facebook parent Meta META and Microsoft MSFT will reveal how they fared in the three months through September. Mark Zuckerberg’s Meta flaunts a massive 65% year-to-date increase (and some new glow-up for its loose-shirt-wearing tech bro founder.) Microsoft, on the other hand, is up by a more modest clip of 12%.
📌 On October 31 , Apple AAPL will release its highly-anticipated earnings data that will include a glimpse into how well the new iPhone 16 is selling . Shares of Apple are up roughly 27% for the year.
These seven mega-cap corporate giants are expected to show an 18% rise in third-quarter profits, according to Bloomberg Intelligence. If materialized, that would be substantially slower than the 36% seen in the second quarter. The sheer size of the pack accounts for about 30% of the total market cap of the S&P 500 (which not long ago celebrated its $50 trillion milestone .) Nvidia and Apple alone are worth more than $7 trillion combined.
What’s on your radar for this earnings season? Are you waiting for a tech giant to dip or maybe you're after a bank stock or a car conglomerate? Share your comments below!

NVIDIA (NVDA) Rockets Higher! TP1 Hit, Eyes on More Gains!NVIDIA (NVDA) Long Trade (15m time frame)
Entry: $135.03
Current Price: $145.21 – Momentum strong as first target hit.
Key Levels:
Stop-Loss (SL): $131.88 – Below key support level to manage risk.
Take Profit 1 (TP1): $138.92 – First target hit, confirming upward trend.
Take Profit 2 (TP2): $145.21 – Next target likely to be reached soon.
Take Profit 3 (TP3): $151.50 – Key level for continued bullish momentum.
Take Profit 4 (TP4): $155.38 – Final target for this strong upward move.
Trade Outlook:
NVIDIA has surged after a clear entry signal at $135.03. With TP1 already achieved, bullish momentum remains intact, and we're aiming for the remaining targets as the stock pushes higher. The trend and technical setup suggest further gains are possible.
