How many times we need to get 1000%+ on this? Here's 3 more...NASDAQ:NVDA
We are currently trading above a significant Fibonacci retracement level of $143. We want to see price consolidate above $145, where we will target $194-$200 next. There are several ways to trade this from here.
* Short-term range from $145 to $150
* Breakout momentum trade over $153 targeting $193
* Long-term range between $103 to $140
Nvidia

NVIDIA Can Go PARABOLICMartyBoots here , I have been trading for 18 years and sharing my thoughts on NVIDIA here.
People are scared with war and high stock market but NVDA could go parabolic
Watch Video for more info

Nvidia - The breakout will eventually follow!Nvidia - NASDAQ:NVDA - will break out soon:
(click chart above to see the in depth analysis👆🏻)
Over the course of the past couple of days, we saw a quite strong rally of +50% on Nvidia. Considering the market cap of this company, such a move is quite impressive. Following this overall very strong bullish momentum, an all time high breakout is quite likely to happen soon.
Levels to watch: $150
Keep your long term vision!
Philip (BasicTrading)

AMD - Inverted Head & Shoulders (Bullish Reversal)Let´s see if we can break the neckline (White trendline) and stay above with a close and possibly a retest on the neckline to confirm this pattern. If so, Im looking for the previous top on daily which is the all time high (So far).
This is not a financial advise. Always do your own research and decision before investing.

NVDA to $240 by 2026NASDAQ:NVDA is bullish still, anyone can see that, however I wanted to find some targets once it's in price discovery mode, well the golden pocket happpens to be $240 ($225-$250)
on weekly trend is confirmed extremely bullish so I'll continue holding and NASDAQ:NVDA should break $240 before 2026
Even a buy signal went off at the bottom in April. Let's see how much gas NASDAQ:NVDA has after it breaks the famous $150 resistance level

5 stocks that shook the market in MayMay 2025 turned out to be a landmark month for the U.S. stock market. Several top companies posted impressive gains driven by explosive demand for AI technologies, advancements in autonomous transport, and strong corporate strategy.
Here are the five market leaders that set the tone in May:
1. Nvidia – The AI Powerhouse
Nvidia (#NVIDIA) surged 25% in May, becoming the most valuable U.S. company with a market cap of $3.45 trillion — surpassing even Microsoft. The rally was fueled by stunning data center results, with revenue hitting $39.1 billion (+427% YoY). Its new Blackwell chip series has already sparked massive interest from leading AI developers. UBS analysts raised their price target to $175, predicting further growth in high-performance computing.
2. Apple – A return to growth
Apple (#Apple) saw a solid 7% gain, rebounding from earlier struggles. The company announced $500 billion in long-term investments over the next five years to create new jobs and manufacture AI servers in the U.S. This move restored investor confidence and supported the stock’s recovery.
3. Tesla – Robotaxis drive momentum
Tesla (#Tesla) jumped 25%, boosted by the announcement of its robotaxi launch in Austin, Texas, scheduled for June 12. Combined with improving market conditions and a pause in EU tariff pressure, Tesla shares reclaimed center stage. Wedbush analysts see potential for the stock to hit $500 as the company expands its autonomous and AI-driven initiatives.
4. Moderna – Biotech breakthroughs
Moderna (#Moderna) gained 7% following positive results from new cancer drug trials. The company also revealed plans to cut operational costs by $1.7 billion by 2027, aiming to boost overall efficiency. Investors welcomed the strategic pivot beyond COVID-related products.
5. Alcoa – Aluminum and geopolitics
Alcoa (#Alcoa) rose 6.5% on reports that the U.S. may ban aluminum imports from Russia. This geopolitical development, along with steady dividends and renewed investor interest in commodities, positioned Alcoa as a top-performing metals stock for the month.
May 2025 confirmed the market’s focus on AI, autonomous transport, biotech, and raw materials. Nvidia, Tesla, Apple, Moderna, and Alcoa led the charge — and FreshForex analysts recommend riding this momentum for active trading on high-performing stocks.

NVIDIA: 4H Golden Cross starting new Channel Up Leg.NVIDIA is bullish on its 1D technical outlook (RSI = 65.736, MACD = 5.860, ADX = 49.646) as it has established and maintained a Channel Up since its April bottom. The completion of a 4H Golden Cross has validated the start of the pattern's new bullish wave. The previous one topped at +30.58%. With the price already rebounding, we are bullish, aiming for a new HH (TP = 169.00).
See how our prior idea has worked out:
## If you like our free content follow our profile to get more daily ideas. ##
## Comments and likes are greatly appreciated. ##

Decentralized AI Infrastructure in a trade war between US/ChinaThe AI revolution is real, but it has a critical weakness: GPU scarcity.
NVIDIA's H100s are sold out to specific countries around the world, serving as crucial hardware for AI development. Cloud costs are skyrocketing. Access to compute is being gatekept by Big Tech. Meanwhile, China is no longer allowed to purchase these GPUs from the US due to the ongoing trade war and the escalating AI arms race between the two countries.
Enter $CRYPTO: IONEUSD — a decentralized GPU network on Solana aiming to become the infrastructure layer for AI, machine learning, and high-performance computing.
Just like Helium tokenized wireless infrastructure, IO is tokenizing global compute power.
-AI is the fastest-growing sector globally, but compute remains the biggest bottleneck.
-Cloud GPU costs are 4–10x higher than decentralized alternatives.
-IO.Net positions itself at the intersection of AI, Web3, and tokenized infrastructure.
-IO is early in its growth curve, currently holding a market cap of $131 million.
I believe that IO.Net could represent a way for China to compete with the US in the AI race, offering a high-demand substitute for expensive and sanctioned chips — helping China stay competitive in AI development.
Because IO.Net is decentralized, it cannot be easily shut down. I believe IO.Net is here to stay and has strong potential to grow significantly from its current market cap of $131 million.
COINBASE:IOUSD
NASDAQ:NVDA
NASDAQ:AMD
NYSE:TSM
BITSTAMP:BTCUSD
BINANCE:SOLUSD
AMEX:SPY

NVIDIA Massive Cup and Handle targets $200.NVIDIA Corporation (NVDA) is pulling back aggressively following yet another positive Earnings report, where they beat the estimates again but the market is reacting with selling. That has been a 'norm' in the past 12 months but even from a technical standpoint, the price reached the 143.60 Resistance level (made of the February 18 High), so profit taking is technically normal market behavior here.
On the longer term however, this Resistance test potentially forms the top f a very powerful pattern, the Cup and Handle (C&H). At the moment, the market has the support of both the 1D MA200 (orange trend-line) and 1D MA50 (blue trend-line) and the Handle, which has just started, has some room to safely consolidate for a while before the pattern break-out upwards.
Technically, C&H patterns reach their 2.0 Fibonacci extensions after the break-out, so our medium-term Target is set at $200.
Notice also the Bearish Divergence on the 1D RSI, which is similar to that of late October 2024. A break below the 1D MA50 risks the bullish structure on this pattern.
-------------------------------------------------------------------------------
** Please LIKE 👍, FOLLOW ✅, SHARE 🙌 and COMMENT ✍ if you enjoy this idea! Also share your ideas and charts in the comments section below! This is best way to keep it relevant, support us, keep the content here free and allow the idea to reach as many people as possible. **
-------------------------------------------------------------------------------
💸💸💸💸💸💸
👇 👇 👇 👇 👇 👇

Nvidia Posts Another Blowout Quarter. What Can Slow It Down?Hint: Not much.
🚀 Earnings So Good You Can’t Ignore ‘Em
Another quarter, another jaw-dropper from Nvidia NVDA . In what has basically become a quarterly ritual at this point (congrats to all who celebrate!), Jensen Huang’s silicon empire posted revenue of $44.1 billion , soaring past the $43.3 billion consensus.
That’s a 69% year-over-year gain, in case anyone’s still doing the math. Adjusted earnings of 81 cents per share also easily crushed expectations.
Shares popped 5% in after-hours trading Wednesday and then pulled back a little bit during the cash session on Thursday — not quite a moonshot, but a confirmation that even if Nvidia’s guidance was meh, this earnings report was meh’gnificent.
So what exactly is fueling this unstoppable juggernaut? And is there anything that could actually throw a wrench in the gears? Grab your chips (there’s your pun), let’s break it down.
💾 Data Centers: The Company’s Cash Cow
If Nvidia is famous for anything, it’s that it’s really able to see the trend before the crowds pick it up. From gaming, to crypto… and now? The star of the show now is data centers. But there's not just any growth. We’re talking $39.1 billion in data center revenue, up 73% from last year. That’s nearly 90% of Nvidia’s entire business. Not exactly fans of revenue diversification, are we?
Big Tech is gorging on Nvidia’s AI chips like it’s an all-you-can-eat GPU buffet. Amazon NASDAQ:AMZN , Google NASDAQ:GOOGL , and Microsoft NASDAQ:MSFT alone account for nearly half of that segment.
Basically, if you’re building anything with the words “large language model,” “AI agent,” or “sovereign compute,” you’re probably writing big checks to Nvidia.
🇨🇳 About That $10.5 Billion Problem
Thanks to Trump’s H20 export ban, Nvidia’s revenue from China is expected to take a $10.5 billion hit over two quarters. That’s an $8 billion crater forecasted for the current quarter, on top of a $2.5 billion gap in the previous one.
Is that bad? Maybe. Does anyone care right now? Not really.
Because here’s the kicker: demand outside China is so nuclear that even subtracting ten billion bucks over six months doesn’t materially derail the bullish narrative. Nvidia’s still forecasting $45 billion in revenue this quarter, which is basically flat — but considering what’s missing, that’s a win in disguise.
📦 Blackwell to the Rescue
The forward guidance may have missed the Street’s expectations — Nvidia projected Q2 revenue of $44–$46 billion, versus the $45.9 billion consensus — but CEO Jensen Huang already served the antidote: Blackwell Ultra.
These next-gen chips are already shipping to early customers. They promise to be leaner, meaner, and more power-efficient — basically, think McLaren but for AI accelerators. And they’re expected to ramp up aggressively in the back half of the year.
That means Nvidia has a new growth lever just waiting to be pulled. Some overly bullish analysts say it could eclipse the H100’s success.
💡 The Real Moat? It’s Not Just the Chips
What makes Nvidia such a rare beast isn’t just its hardware. It’s the ecosystem — CUDA, software stacks, developer tools, APIs, vertical integrations. It’s like Apple, but for the AI industrial complex.
Everyone wants to build an AI empire, but good luck doing it without Nvidia’s infrastructure. It’s not just expensive — it’s essential.
In the meantime, AMD NASDAQ:AMD and Intel NASDAQ:INTC are trying. There’s chatter about custom silicon from OpenAI (still a private company) and Meta $META. But for now, the moat around Nvidia looks more like a canyon.
🧨 So What Could Slow It Down?
But let’s not get carried away — there are still some real risks on the radar. Here’s what might actually trip up the AI king:
Geopolitical shocks: More export bans? Chinese retaliation? Taiwan tension? Any of these could make markets twitchy.
Supply chain constraints: As demand grows, so does pressure on foundries like TSMC 2330 . Any hiccups in advanced packaging or wafer starts could pinch margins.
Rising competition: AMD’s MI300 is no slouch. And Big Tech is building in-house chips to lessen reliance on Nvidia.
AI fatigue: If the AI hype cycle fizzles out or hits a plateau (remember the metaverse?), that could cool capital spending. It only takes 3-4 tech titans to pull their capex and Nvidia’s reign is over.
But until any of that materializes, the narrative for many is "Buy the dip — Jensen’s grip won’t slip."
💫 What’s Priced In?
The stock’s P/E is still sky-high, and the multiple implies several more years of 50–60% annual revenue growth. That’s hard to sustain indefinitely. But then again, so was becoming the second-largest company in the world… (and the biggest one, if only for a while ) and here we are.
Nvidia’s valuation is steep, but not unjustified — as long as it keeps executing. And judging by any of the previous quarters going back to 2023, execution isn’t a problem.
👩🏻🚀 More Than a Stock — Macro Theme
At this point, Nvidia has transcended chipmaker status. It’s now a macro story. Betting on Nvidia is betting on AI. It’s betting on infrastructure. It’s betting on the next industrial revolution in software, automation, and language models.
So… what can stop it? Share your thoughts in the comment section!

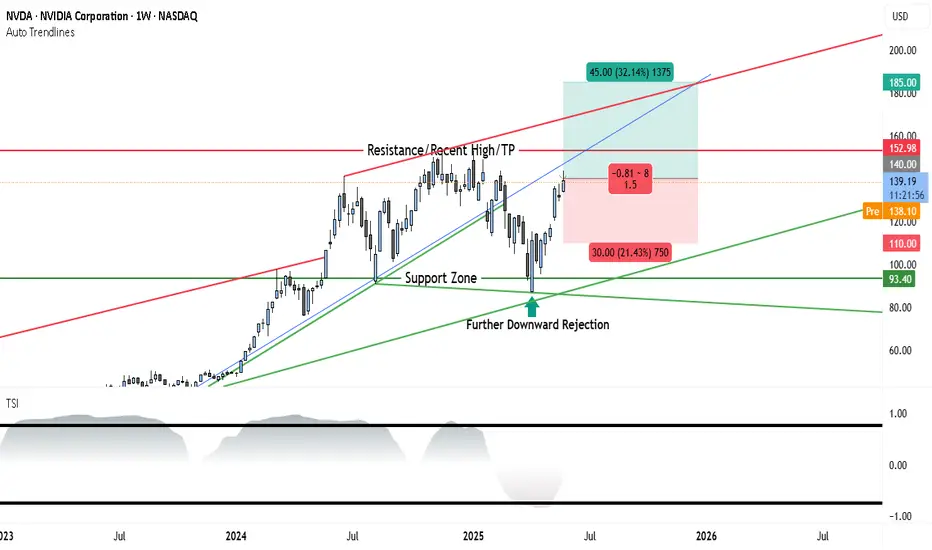
NVIDIA Stock Weekly Outlook: Support Holds Strong as $185 TargetThe weekly chart of NVDA shows a strong continuation pattern forming after a period of consolidation and a healthy pullback. The recent price action confirms a bullish stance, with a fresh bounce off support and momentum gradually shifting in favor of the bulls.
________________________________________
Long-Term Uptrend Confirmed
The blue ascending trendline drawn from early 2023 remains intact, showing that the overall trend is still bullish. NVDA has respected this trendline multiple times, with each touch followed by a renewed upward move. This week, the price rebounded once again near this trendline, confirming its role as dynamic support and signaling renewed buying interest.
________________________________________
Resistance and Breakout Potential
The key resistance level is marked at $152.98, which represents the recent weekly high and a psychological barrier. This level has acted as a ceiling in past attempts, but the current structure and momentum suggest a potential breakout if volume confirms. Above this level, there's clear air up to $185, where the next major resistance sits, and which also acts as the projected target in this trade setup.
________________________________________
Support Holding Strong
A strong support zone around $93.40 is clearly defined and has already triggered multiple rejections. NVDA recently saw a sharp bounce from this zone after a downward rejection, signaling that institutional buyers may be active here. This area is the foundation of the current bullish case.
________________________________________
Momentum Turning Favorably
The True Strength Index (TSI), shown at the bottom of the chart, is emerging from a low region. While not yet fully bullish, the indicator is starting to turn upward, suggesting early signs of momentum building. If TSI crosses above the midline in coming weeks, it could confirm the start of a sustained upward move.
________________________________________
Trade Setup
• Entry Zone: $138 to $140 (current price range)
• Stop-Loss: $110 (beneath the last significant swing low)
• Target: $185 (aligns with the next major resistance and top of risk-reward box)
• Risk-Reward Ratio: Approximately 1.5:1
• Setup Bias: Swing to mid-term bullish continuation
________________________________________
Conclusion
NVIDIA’s weekly chart is aligning in favor of the bulls after a healthy consolidation and support retest. The price remains within a strong uptrend channel, and momentum is gradually improving. A breakout above $152.98 would likely attract more volume and set the stage for a rally toward $185. The risk-reward setup is favorable, making this a strong candidate for bullish swing positioning heading into Q3 2025.
NVDA: Ascending triangle break, bull flag on S/R retestHey traders! I'm back and once again, I've spent almost the whole evening (lol) trying to figure out the odd, strange price action we've seen from NASDAQ:NVDA over the past few weeks, and especially today!
As we all know (I assume), Nvidia failed to disappoint on earnings once again, and we saw a HUGE gap up overnight, as far as up to the $143 mark. However, we soon began to see a dip. That's fair, as traders will likely sell and take profit.
However, the dip became a larger dip, and Nvidia finished the day basically at 3.2%. But it seems that the pullback may been pretty healthy.
Because as you can see from the chart, Nvidia has been forming an ascending triangle ever since the 14th May. That was after the sweet run it had prior to that. It has tested the £136-137 area as a major resistance line ever since until finally, a strong earnings report sent Nvidia above the line.
After the gap up, throughout the day, the stock went into a controlled, composed downward channel which what we like to call, a bull flag. This is taking into consideration market hours, not extended hours. This bull flag is bullish in its own way, but it is also a sign of a retest of the $136-137 resistance zone. This is officially a support zone now.
A successful retest from this support zone will cause a bounce, especially from the support trendline, and likely send the stock towards $140+, possibly extending its reach to $150 if broader market strength (Nasdaq) continues.
On the contrary, a dip below the support line and a crash below the red support trendline, would likely send the stock lower to $133 as next support.
As long as Nvidia maintains $136-137, the bulls are in control.
Note: Not financial advice. Please do your DD.

Nvidia - The bullish consolidation flag!Nvidia - NASDAQ:NVDA - is still quite bullish:
(click chart above to see the in depth analysis👆🏻)
After Nvidia retested a major horizontal support just last month, we witnessed an extremely strong bullish reversal candle which resulted in a strong +50% rally. Considering the bullish flag consolidation, a breakout is much more likely, but not in the immediate future.
Levels to watch: $150
Keep your long term vision!
Philip (BasicTrading)

Nvidia Maintains Bearish Bias After EarningsNvidia released its quarterly earnings yesterday, and since then, market confidence triggered a significant bullish gap that pushed the stock price up by nearly 5%. However, in recent hours, a new bearish bias has started to emerge, steadily closing the gap as the market digests the company’s latest report.
Nvidia reported $44 billion in revenue, slightly above the $43 billion expected, while earnings per share (EPS) came in at $0.77, below the $0.87 forecast. Nevertheless, the most notable aspect of the report was the announcement of an estimated $8 billion revenue loss due to U.S. export restrictions. In response, CEO Jensen Huang strongly criticized these measures, warning that they could negatively impact the company’s performance in the coming months.
Uptrend Channel Remains Intact
Since early April, Nvidia has maintained a steady upward channel. Although a slight bearish bias has emerged recently, it is not yet strong enough to pose a threat to the broader bullish trend seen in recent months. Therefore, this technical structure remains the most important pattern for the upcoming sessions.
Technical Indicators:
RSI: The Relative Strength Index has begun to show signs of a possible bearish divergence, as lower highs on the RSI contrast with higher highs in the stock price. This mismatch could signal short-term corrective movements.
MACD: The MACD, meanwhile, continues to oscillate around the zero line, indicating a balance between buying and selling pressure. As long as the histogram remains near this level, it suggests neutral momentum in price direction.
Key Levels to Watch:
$140 USD: Current resistance level where short-term selling pressure may emerge.
$150 USD: Distant resistance around January highs. A breakout toward this level could support a stronger bullish channel.
$125 USD: Important support that coincides with the 200-period moving average. A bearish move toward this level could break the current bullish formation.
Written by Julian Pineda, CFA – Market Analyst

Nvidia Earnings Boost, Trade Tariffs Legitimacy, NQ trade ideaCME_MINI:NQ1!
Big Picture Context: .
NQ futures rallied after NVIDIA posted an earnings beat and after the Manhattan-based Court of International Trade blocked President Trump's Liberation Day tariffs.
Goldman Sachs noted that the ruling on Liberation Day tariffs gives the administration 10 days to halt tariff collection, but does not affect sectoral tariffs. The administration can still impose across-the-board and country-specific tariffs under other legal authorities.
Jobless claims and continuing claims have come in higher.
What has the market done?
The rally faded in the overnight session. However, the catalysts provided energy for prices to move higher. Currently, price is trading above the prior week’s high, yesterday’s high, and it is also trading above the yearly open, and 2025 VPOC and mcVPOC for the last 3 weeks.
What is it trying to do?
The market is negating the recent bear market territory sell-off and negating a bear market rally. It is propelling higher.
How good of a job is it doing?
The market has created good structure and micro composites, despite some gaps left open, and it has created higher lows since last Friday.
What is more likely to happen from here?
Scenario 1: Long Continuation
In this scenario, we are looking for NQ to turn at the immediate 2025 LVN support area. If it edges higher, we will be looking for potential long opportunities above the 21710–21720 area, targeting overnight highs and potentially the next HVN.
Scenario 2: Gap Close and Reversal
In this scenario, we are looking for a pullback, testing pHi and pWk-Hi. We will look for a rounded base that consolidates here on a lower timeframe, such as the 5-minute timeframe, and look for a reversal back towards the 21710–21720 level.
pWk-Hi: prior Week's High
pHi: prior Day's High
HVN: High Volume Node
LNV: Low Volume Node
VPOC: Volume Point of Control
C: Composite (prefix before VAL, VAH, VPOC, VP, AVP)
mC: micro-Composite (prefix before VAL, VAH, VPOC, VP, AVP)

SHORT Nvidia, Bearish Chart Setup, Resistance ConfirmedThe resistance from 21-May has been confirmed 28-May.
The same level has been working as resistance since 14-May.
After two weeks, this resistance level continues to hold and it is now confirmed.
In November 2024 NVDA produced a high.
Later in January 2025 NVDA produced an all-time high.
18-February 2025 NVDA went to produced a lower high; a rejection that led to a major drop.
The major drop resulted in a recovery and the recovery found resistance earlier this month. This resistance, the same from 14-May, 21 and 28-May, is also a lower high compared to the previous levels just mentioned.
The signal here is double: (1) Resistance confirmed and (2) a lower high.
There is one more. 28-May produced a volume breakout day. The day ended up closing red. So, Nvidia is confirmed bearish now.
Thank you for reading.
Namaste.

$NVDA – Earnings Super Bubble?🚨 Nvidia is reporting earnings tomorrow, and the market is waiting with bated breath.
While analysts pile on with hyper-bullish predictions extrapolating the AI super bubble, they seem to ignore one glaring fact:
👉 The last time Nvidia beat earnings, the stock crashed -45% shortly after.
Technical view:
We’re near resistance at the previous post-earnings high.
RSI sits at 63.80, hinting at possible exhaustion.
Volume spikes hint at indecision, not confirmation.
This could be a make or break moment for NASDAQ:NVDA and by extension, the entire Tech sector.

ALTCOIN ROADMAP: REVISITED!!! Ethereum vs NvidiaOne of the most insightful ratio charts that provides a remarkable glimpse into the vitality of Altcoins and the appetite for risk is when Ethereum outshines one of the fastest rising stars in the stock market, #NVDA!
The conventional Altcoin index indicates how many of the top 100 Altcoins are outperforming #BTC.
This is indeed a valuable metric that we can rely on for identifying peaks.
However, I believe that if we broaden our perspective and examine the ETH ratio against a Tech Titan, we can truly pinpoint the timing of the banana zone. When it starts and when it is confirmed violent uptrend.
My interest in this ratio was sparked when ETH was still a proof of work coin, validated through GPUs; it seemed like a natural starting point to assess whether the ETH price was overvalued or undervalued.
Even after the transition to POS, I still think it’s worth analysing, as shown by the recent double bottom on the ratio!
The next crucial question is when we can break the multi-year downtrend to genuinely confirm the Banana zone. Because without ETH, there’s no party.
If we enter a big strong banana zone, I believe the ratio could swiftly trend towards 100, so we will be keeping a close eye on it!

NVDA NVIDIA Corporation Options Ahead of EarningsIf you haven`t bought NVDA before the previous earnings:
Now analyzing the options chain and the chart patterns of NVDA NVIDIA Corporation prior to the earnings report this week,
I would consider purchasing the 131usd strike price Puts with
an expiration date of 2025-6-20,
for a premium of approximately $7.00.
If these options prove to be profitable prior to the earnings release, I would sell at least half of them.
I`m overall bullish long term on NVDA.
Disclosure: I am part of Trade Nation's Influencer program and receive a monthly fee for using their TradingView charts in my analysis.

This 3 Step System Will Show You The Trending StockThis is a powerful chart for you to watch.
Because its following the Rocket booster
strategy.
The Rocket booster Strategy has 3 Steps;
1-The price has to be above the 50 EMA
2-The price has to be above the 200 EMA
3-The price should gap up or trend up.
In order for us to know whether the price
will trend up we are using the ADX indicator.
We make sure that the Blue line
Is rising between the Green line
and the Red line .
This confirms the last step of the rocket booster
strategy.Also remember that the NASDAQ is up-trending.
Rocket boost this content to learn more.
Disclaimer;Trading is risky please use a simulation account
for trading before you trade with real money.
Also learn risk management and profit taking strategies.

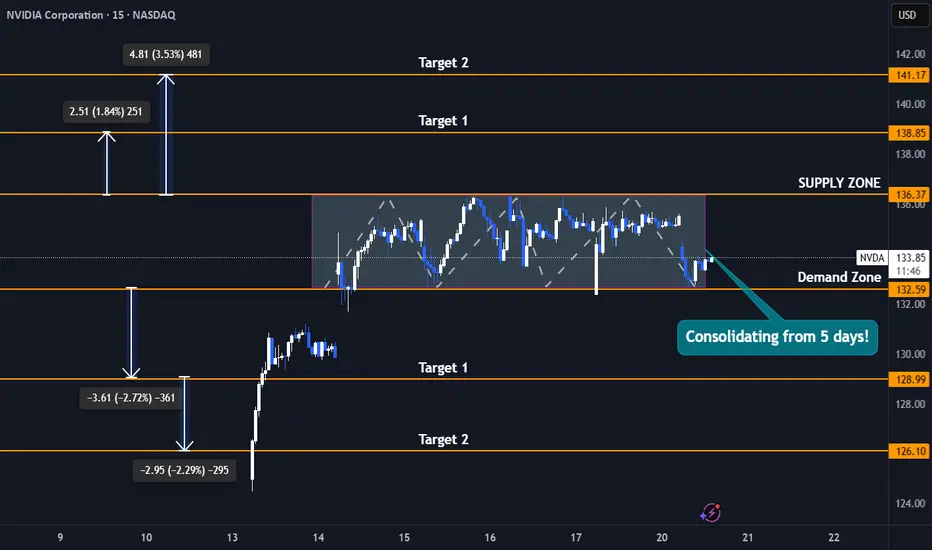
Nvidia Stock 5-Day Consolidation Breakout - Uptrend or Pullback?Trade Duration: Intraday
Trade Type: Breakout
- Nvidia is currently consolidating tightly between $132 and $136, forming a narrow range that reflects a balance between buyers and sellers unwilling to relinquish control. This range-bound action signals indecision, but it won’t last indefinitely.
- Typically, the longer the consolidation, the more significant the subsequent move. As new participants enter the market, a breakout—whether upward or downward—can trigger a powerful surge.
- This move is often amplified by breakout buyers joining in and stop-loss orders of trapped traders being triggered, creating an ideal setup for an intraday breakout trade.
- I plan to initiate either a buy or sell position depending on the breakout direction, capitalizing on the momentum generated by this tight consolidation phase.
Upside Targets : 138$ and 141$
Downside Targets : 128$ and 126$
$NVTS is up 125%, but they might not be done yet!NASDAQ:NVTS Could see more upside if...
We close the week above $4.66 Double Bottom Breakout. This would lead us to the following targets...
🎯$6📏$7.76
- Bullish cross on H5_L indicator
- Volume shelf launch with GAP
- NASDAQ:NVDA Partnership
- Small Cap
- High Short Float

NVIDIA The 1W MA100 rebound is targeting $225 at least.NVIDIA Corporation (NVDA) broke last week above its 1W MA50 (blue trend-line) for the first time in 2.5 months and all this is generated by April's bottom rebound on the 1W MA100 (green trend-line).
The 1W MA100 has been intact since January 23 2023, so this rebound technically initiates a new Bullish Leg. Since the December 2018 bottom (previous U.S. - China Trade War), the minimum rise on such a Bullish Leg has been +156.11%. As a result, NVIDIA can now target $225 at least before the end of 2025.
-------------------------------------------------------------------------------
** Please LIKE 👍, FOLLOW ✅, SHARE 🙌 and COMMENT ✍ if you enjoy this idea! Also share your ideas and charts in the comments section below! This is best way to keep it relevant, support us, keep the content here free and allow the idea to reach as many people as possible. **
-------------------------------------------------------------------------------
💸💸💸💸💸💸
👇 👇 👇 👇 👇 👇
